ALCOHOL-INDUCED INFLAMMASOME ACTIVATION IN THE INTESTINE, LIVER AND
BRAIN
PhD thesis
Dóra Lippai MD
Semmelweis University
Doctoral School of Clinical Medicine
Consultant: Gyöngyi Szabó MD, D.Sc Official reviewers:
Attila Zalatnai MD, Ph.D Pál Demeter MD, Ph.D
Head of the Final Examination Committee:
Ferenc Szalay MD, D.Sc
Members of the Final Examination Committee:
János Banai MD, D.Sc Gábor Veres MD, D.Sc György Székely MD, Ph.D
Budapest, 2016
To my Dearest Family
1. TABLE OF CONTENTS
1. TABLE OF CONTENTS ... 1
2. THE LIST OF ABBREVIATION ... 4
3. INTRODUCTION ... 7
3.1. Burden of alcohol-related diseases ... 7
3.2. Effects of alcohol ... 9
3.2.1. General ... 9
3.2.2. Intestine ... 9
3.2.3. Liver ... 10
3.2.4. Brain ... 11
3.3. Intestine-liver-brain axis ... 11
3.3.1. General considerations ... 11
3.3.2. Alcohol effects ... 13
3.4. Inflammasome... 14
3.4.1. Signal 1 ... 15
3.4.2. Signal 2 ... 16
4. OBJECTIVES ... 17
5. METHODS ... 18
5.1. Animals ... 18
5.1.1. Ethical approval ... 18
5.1.2. Genotypes ... 18
5.1.3. Diet ... 18
5.1.4. Treatment ... 18
5.1.5. Sample collection and storage ... 19
5.2. Laboratory methods ... 19
5.2.1. Alcohol concentration... 19
5.2.2. Quantitative polymerase chain reaction (qPCR) ... 19
5.2.3. Electrophoretic mobility shift assay (EMSA) ... 20
5.2.4. Enzyme-linked immunosorbent assay (ELISA) ... 21
5.2.5. Enzyme-activity assay ... 21
5.2.6. Endotoxin ... 21
5.2.7. Western blot ... 21
5.2.8. Immunoprecipitation ... 22
5.3. Statistical analysis ... 23
6. RESULTS ... 24
6.1. Proximal intestine ... 24
6.1.1. Serum alcohol content in alcohol-fed mice ... 24
6.1.2. Serum-endotoxin level in alcohol-fed mice ... 24
6.1.3. Intestinal antimicrobial protein expression in alcohol-fed mice ... 25
6.1.4. Intestinal NF-κB activation in alcohol-fed mice ... 26
6.1.5. Intestinal TNFα level in alcohol-fed mice ... 26
6.1.6. Intestinal IL-1β level in alcohol-fed mice ... 27
6.1.7. Intestinal inflammasome expression in alcohol-fed mice ... 28
6.2. Cerebellum ... 29
6.2.1. Cerebellar NF-κB activation in chronic alcohol-fed mice ... 30
6.2.2. Cerebellar TNFα level in chronic alcohol-fed mice... 30
6.2.3. Cerebellar IL-1β level in chronic alcohol-fed mice ... 30
6.2.4. Cerebellar inflammasome expression in chronic alcohol-fed mice ... 32
6.2.5. Cerebellar inflammasome activation in chronic alcohol-fed mice ... 32
6.2.6. Serum alcohol content in chronic alcohol-fed mice with different genotypes 33 6.2.7. Cerebellar IL-1β level in chronic alcohol-fed NLRP3-KO and ASC-KO mice34 6.2.8. Cerebellar inflammasome activation in chronic alcohol-fed NLRP3-KO and ASC-KO mice ... 34
6.2.9. Cerebellar receptor expression in chronic alcohol-fed mice ... 35
6.2.10. Cerebellar TNFα level in chronic alcohol-fed TLR4-KO mice... 35
6.2.11. Cerebellar IL-1β level in chronic alcohol-fed TLR4-KO mice ... 36
6.2.12. Cerebellar inflammasome expression in chronic alcohol-fed TLR4-KO mice36 6.2.13. Cerebellar inflammasome activation in chronic alcohol-fed TLR4-KO mice38 6.2.14. Endotoxin level in the cerebellum of chronic alcohol-fed mice ... 39
6.2.15. Cerebellar HMGB1 level and activation of chronic alcohol-fed mice ... 39
6.2.16. Interleukin-1 receptor and interleukin-1 receptor antagonist in the cerebellum of chronic alcohol-fed mice ... 40
6.2.17. Cerebellar TNFα level in chronic alcohol-fed recombinant interleukin-1
receptor antagonist treated mice ... 40
6.2.18. Cerebellar IL-1β level in chronic alcohol-fed recombinant interleukin-1 receptor antagonist treated mice ... 41
6.2.19. Cerebellar receptor and inflammasome expression in chronic alcohol-fed recombinant interleukin-1 receptor antagonist treated mice ... 42
6.2.20. Cerebellar inflammasome activation in chronic alcohol-fed recombinant interleukin-1 receptor antagonist treated mice ... 42
6.2.21. Cerebellar HMGB1 activation in chronic alcohol-fed recombinant interleukin-1 receptor antagonist treated mice ... 44
6.2.22. Cerebellar TNFα and pro-IL-1β levels in response to intracranial recombinant IL-1β injection in mice ... 44
7. DISCUSSION ... 45
7.1. General considerations ... 45
7.2. Proximal small intestine ... 45
7.3. Liver ... 48
7.4. Cerebellum ... 48
7.5. Concluding remarks and human relevance ... 54
7.6. Future perspectives ... 54
8. CONCLUSIONS ... 56
9. SUMMARY ... 57
9.1. English summary ... 57
9.2. Magyar összefoglalás ... 58
10. BIBLIOGRAPHY ... 59
11. BIBLIOGRAPHY OF THE CANDIDATE’S PUBLICATIONS ... 74
11.1. Publications related to the theme of the Ph.D. thesis ... 74
11.2. Other publications and abstracts related to the theme of the Ph.D. thesis . 74 11.2.1. Oral presentations ... 74
11.2.2. Posters ... 74
11.3. Publications not related to the theme of the Ph.D. thesis ... 75
12. ACKNOWLEDGEMENTS ... 78
2. THE LIST OF ABBREVIATION
AIM2: absent in melanoma 2 ALD: alcoholic liver disease AP-1: activator protein-1
ASC: apoptosis-associated speck-like protein containing a caspase recruitment domain ATP: adenosine triphosphate
BSA: bovine serum albumin
cDNA: complementary deoxyribonucleic acid Ctr: control
DAMP: danger-associated molecular pattern dI-dC: poly(deoxyinosinic-deoxycytidylic) acid DSS: dextran sodium sulfate
DTT: dithiothreitol
EDTA: ethylenediaminetetraacetic acid ELISA: enzyme-linked immunosorbent assay EMSA: electrophoretic mobility shift assay EtOH: Lieber-DeCarli ethanol diet
FBS: fetal bovine serum
GFAP: glial fibrillary acidic protein
HEPES: 4-(2-hydroxyethyl)-1-piperazineethanesulfonic acid HMGB1: high-mobility group box-1
HRP: horseradish peroxidase
Iba1: ionized calcium-binding adaptor molecule-1 IBD: inflammatory bowel disease
IL: interleukin IL-1R: IL-1 receptor IL-1Ra: IL-1R antagonist IP: immunoprecipitation i.p.: intraperitoneal KCl: potassium chloride KO: knockout
LPS: lipopolysaccharide, endotoxin LRR: leucine-rich repeat
MCP-1: monocyte chemotactic protein-1 miRNA: micro-RNA
mRNA: messenger RNA
MyD88: myeloid differentiation primary response gene (88) Na3VO4: sodium orthovanadate
Na4P2O7: sodium pyrophosphate decahydrate
NACHT: NAIP (neuronal apoptosis inhibitor protein), C2TA (major histocompatibility complex class 2 transcription activator), HET-E (incompatibility locus protein from Podospora anserina) and TP1 (telomerase-associated protein)
NaF: sodium fluoride NF-κB: nuclear factor-κB
NLRP1: NACHT, LRR and PYD domains-containing protein-1 NLRP3: NACHT, LRR and PYD domains-containing protein-3 NLRP6: nucleotide-binding oligomerization domain-like receptor-6
NLRC4: nucleotide-binding oligomerization-like receptor family caspase recruitment domain-containing protein 4
PAMP: pathogen associated molecular patterns PBS: phosphate buffered saline
PMSF: phenylmethylsulfonyl fluoride PSC: primary sclerosing cholangitis PRR: pattern recognition receptor PYD: pyrin domain
RAGE: receptor for advanced glycation end products Reg3b: regenerating islet-derived protein III-β RIPA: radioimmunoprecipitation assay
RNA: ribonucleic acid
rIL-1Ra: recombinant IL-1Ra ROS: reactive oxygen species SEM: standard error of the mean TBS: tris buffered saline
TLR: Toll-like receptor
TNFα: tumor necrosis factor-α UC: ulcerative colitis
v/v: volume per volume
WHO: World Health Organization WT: wild type
3. INTRODUCTION
3.1. Burden of alcohol-related diseases
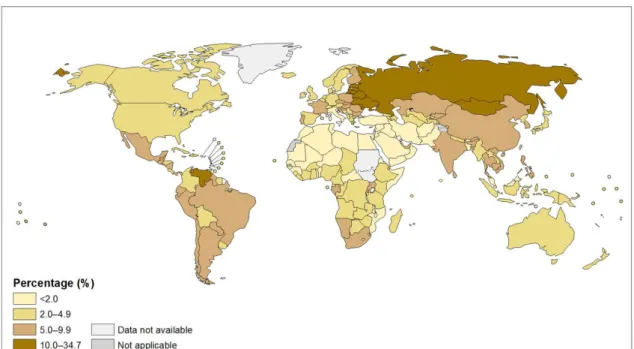
Based on a WHO report from 2012, 5.9% of all global deaths (3.3 million) were attributable to alcohol consumption [1]. Globally, harmful use of alcohol has been ranked among the top five risk factors for diseases and death [2]. Alcohol consumption is associated with the risk of developing a range of health problems including neuropsychiatric conditions (i.e. alcohol dependence), gastrointestinal diseases (liver cirrhosis), malignancies (colorectal cancers), cardiovascular diseases (hemorrhagic stroke), pre-term birth complications, and injuries (such as road accidents) [3]. There is an estimate that alcohol use plays a causal role in almost 200 diseases [3]. Furthermore, regarding its vastness, international classification of disease (ICD-10) dedicated a code for mental and behavioral disorders due to alcohol. The amount of alcohol consumption, mainly containing ethanol, the drinking patterns and rarely the quality of alcohol are the major determinants of harmful outcome [4]. Worldwide, 13.5 gr/day pure alcohol (equal to 6.5 liters) is consumed by drinkers aged 15 and more of which 16% have pattern of heavy drinking episodes [4]. There is a large geographical variation in alcohol related morbidity, and Europe has the highest alcohol-attributable fraction rate [4]. Based on a 2010 report, Hungary was categorized among the countries with high consumption of alcohol per capita (≥12.5 liters) (Figure 1) [5].
Figure 1. Total alcohol per capita (15+ years) consumption, in liters of pure alcohol, 2010 [5]
(Reprinted with permission from publisher’s URL:
http://gamapserver.who.int/mapLibrary/Files/Maps/Global_consumption_percapita_2010.png; date
There is a gender difference in global death related to alcohol, as an epidemiologic study from Hungary in 2003 reported 27.5 and 23.2% casual, 7.7 and 31.3% mild, 2.5 and 17.7% severe alcohol consumption among female and male, respectively [6].
Overall based on a 2010 estimate, prevalence of alcohol use associated diseases and dependence in Hungary was 17.7% (31% for male, 6% for female) [7]. Increase in alcohol consumption per capita is strongly correlated with increase in alcohol- attributable deaths [8, 9]. In Hungary in 2010 alcohol-attributable death was 13.3% in spite of the decrease from 17.1% in 2005, it is still among the highest (Figure 2) [10].
Figure 2. World: Proportion of all deaths attributed to alcohol (alcohol-attributable fractions, %;
all ages), 2012 [10]. (Reprinted with permission from publisher’s URL:
http://gamapserver.who.int/mapLibrary/Files/Maps/Global_deaths_2012.png; date accessed 10-07-2015).
The first line of treatment is prevention, cessation of alcohol use and proper nutrition.
However, once alcoholic organ damage has emerged, even abstinence and our limited non-specific therapeutic options might be ineffective in preventing progression of the disease or death [11]. As a result of easy (even natural) availability, addictive effect and harmful consequences of alcohol our effort should focus on finding a safe, effective and economically beneficial treatment for alcohol related diseases. In order to achieve a refined treatment, understanding the mechanism, cellular and subcellular changes as a result of alcohol consumption is crucial.
3.2. Effects of alcohol 3.2.1. General
Long term use of alcohol generally affects major organ systems – digestive-, circulatory-, nervous-, endocrine-, immune system, etc. The effects include inflammatory changes and carcinogenesis. Furthermore alcohol intake affects the next generation as prevalence of fetal alcohol spectrum disorder as a result of parental alcohol intake is around 1% [12].
The impact of alcohol is not limited to the increased incidence of certain disease, it also affects the course and outcome of other diseases. The mechanism by which alcohol harms organs and tissues is not thoroughly understood, its range varies from direct irritation, conversion to other toxic agents such as acetaldehyde, induction of inflammatory by-products, acting as solvent for other toxic agents, slowing the detoxification of other processes, lowering level of nutrients (such as folate) to completely unknown pathways [13].
3.2.2 Intestine
During alcohol ingestion the oral mucosa, esophagus, stomach and small intestine are exposed to high concentrations of alcohol [14], which leads to the most severe direct and pure effect of alcohol seen among organs. Alcohol impairs the gastrointestinal barrier function by inducing inflammation, epithelial cell apoptosis and necrosis [14- 18]. Furthermore, bacterial overgrowth, decreased antimicrobial peptide level and impaired epithelial tight junction is associated with chronic alcohol use in the proximal small intestine [19-21]. Affected intestinal barrier allows systemic translocation of pathogen- or danger-associated molecular patterns (PAMPs or DAMPs) [22]. PAMPs and DAMPs activate pro-inflammatory pathways via pattern-recognition receptors (PRRs) [22]. The increased amount of bacterial cell wall, endotoxin / lipopolysaccharide (LPS), in the serum is suggestive of impaired gut barrier function, which is observed in animal models of alcoholism as well as patients with chronic alcohol use [23, 24].
Inflammation might occur within the intestinal wall following the loss of barrier integrity, or as a direct effect of alcohol, which could then contribute to further loss of
function. Duodenal inflammation is observed in alcoholic individuals, including increased presence of B lymphocytes [15, 25].
Nuclear factor-κB (NF-κB) activation and as a consequence tumor necrosis alpha (TNFα) production has been suggested to be part of the pathogenesis of intestinal inflammatory processes [26, 27]. Supporting this theory, dysbiosis-induced intestinal inflammation causes loss of barrier function via TNFα receptor which then leads to alcoholic liver disease in mice [28].
Inflammatory cytokine, interleukin-1β (IL-1β), produced by macrophages, contributes to immune tolerance of the intestine via regulating expansion of regulatory T cells through macrophages and dendritic cells [29]. Additionally, NF-κB pathway mediated IL-1β release is associated with increased permeability in Caco2 cell line [30].
Inflammasome activation occurs in dextran sodium sulfate (DSS) induced colitis model in mice and is observed to contribute to the healing process of the intestinal barrier via the maturation of IL-18 which is similarly produced to IL-1β [31].
So far there is no clear data on inflammasome activation, IL-1β or TNFα production or their possible role in alcohol induced inflammatory changes in the small intestine.
3.2.3. Liver
Alcohol and alcohol-induced P/DAMPs have easy access to hepatocytes, stellate and Kupffer cells in the liver because the sinusoids do not form a strong barrier. The major metabolism of alcohol occurs in the liver, therefore the cellular effects of harmful derivates, including acetaldehyde is mainly expected in the liver of alcoholics [32].
Consequences follow as chronic alcohol intake frequently induces steatohepatitis, cirrhosis and can result in hepatic cancer. The most common feature, steatohepatitis consists of fatty transformation and inflammatory changes [33]. Both Kupffer cells and hepatocytes are involved in the process of alcohol-induced inflammation where excess pro-inflammatory cytokine (TNFα and IL-1β) production is observed [34]. Chronic alcohol use induces hepatocyte apoptosis and necrosis [35], which can facilitate the inflammatory changes. Furthermore, long-term alcohol exposure-induced inflammation is associated with fibrotic changes of the liver mediated by stellate cells [34]. Fibrosis and chronic inflammation is associated with increased risk of hepatocellular carcinoma formation [36]. Cellular changes, inflammasome activation, pro-inflammatory cytokine
secretion, reactive oxygen species (ROS) production, apoptosis, changes in micro-RNA (miRNA) expression are all part of the underlying mechanism [34, 37, 38].
3.2.4. Brain
Alcohol can easily pass through the blood-brain barrier, including the endothelial sheet as well as the astrocyte wrap due to its small size and lipophilic property [39]. Neural cell apoptosis, defective neuroregeneration, microglia- and astrocyte activation are some of the cellular hallmarks of alcohol induced changes in the brain [40-44]. Primarily alcohol alters behavior via changes in neurotransmission, further alcoholism leads to dementia, ataxia via neurodegeneration and possibly neuroinflammation, which are mediated by innate immune responses [45, 46]. Long-term alcohol intake results in neuroinflammation and neurodegeneration both in human and animals [43, 44, 47, 48].
Chronic alcohol ingestion increases expression of monocyte chemotactic protein-1 (MCP-1), TNFα, and caspase-3 in the brain [43, 44, 47]. Inflammatory cytokines affect neurons and are associated with disease symptoms [49]. Toll-like receptor-4 (TLR4) signaling pathway plays an important role in the alcohol-induced production of inflammatory cytokines in different regions of the brain [46]. Cellular changes, pro- inflammatory cytokine secretion, ROS production, apoptosis, changes in miRNA expression are all part of the underlying mechanism of alcohol induced neuroinflammation and -degeneration.
Cerebellum although affected by alcohol consumption [50], there is no clear data on inflammasome activation, IL-1β or TNFα production or their possible role in alcohol induced inflammatory changes in this brain region.
3.3. Intestine-liver-brain axis 3.3.1. General considerations
The portal circulation and the biliary system makes the interaction between intestine and the liver bidirectionally strong. Circulation makes an easy channel to communicate between organs. Peripheral nervous system allows the brain to receive and act fast using neural reflexes.
The significance of gut-liver interaction is suggested by the evidences that hepatobiliary involvement in inflammatory bowel disease (IBD) is high; 70-80% of primary
sclerosing cholangitis (PSC) patients have ulcerative colitis (UC) [51]; alcoholic liver disease (ALD) patients have leaky gut and endotoxemia [52]; the altered intestinal microbiome is associated with various liver diseases [53].
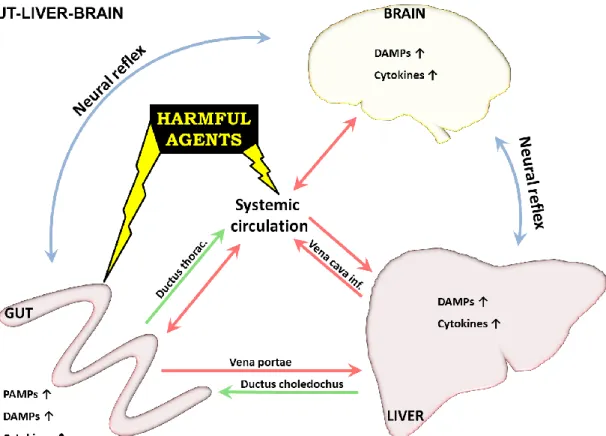
Figure 3. Intestine-liver-brain axis. Most harmful agents enter via the GI system, skin or lung and are distributed through systemic and/or lymph circulation inducing inflammation in different organs including the entering site. The harmful agents can go through first-pass metabolism in the liver and in original or metabolite form can be excreted to the bile entering the intestinal system. Similarly, but to a lesser extent kidney/lung/skin/GI tract, etc. have excretory ability. Neural reflexes quickly deliver signals to the brain and back to the organs, fast responding to the problem. DAMPs and cytokines induced in the inflammatory process can enhance inflammation at the site of origin or can use similar pathways to PAMPs and reach other organs to affect.
The involvement of brain in disease condition results in altered behavior, fatigue, anorexia, loss of appetite, occasionally fever which are caused by the circulating PAMPs and DAMPs including cytokines like TNFα and IL-1β of the affected organ, whereas others are results of direct neuronal interactions [54, 55]. Motor and secretory function of intestine or neutrophil accumulation of the liver can all be affected [54-57].
Consecutively the overall performance of the individual changes [54-57]. Emerging evidences suggest that intestinal-brain interactions play crucial role in the pathogenesis of IBS and IBD [58]. Chronic intestinal inflammation in mice reduces hippocampal neurogenesis [40]. LPS has an indirect role in neuroinflammation, as neuroimmune reflexes can sense and respond to peripheral injuries [49]. Moreover vagotomy
diminishes IL-1β response in the brain, but not on the periphery after intraperitoneal injection with LPS [59]. Inflammatory cytokine TNFα is rapidly induced and remains elevated for a prolonged period of time in the brain after peripheral LPS challenge [60].
Serum radiolabeled TNFα is being transported through the blood-brain barrier via endothelial receptors in a saturable manner [61]. Furthermore, LPS-induced intracerebral IL-6 signaling inhibits neurogenesis in the hippocampus [41].
This finely tuned live system, the intestine-liver-brain axis has a lot of possible connection routes (Figure 3).
3.3.2. Alcohol effects
Alcoholic individuals have altered and increased bacterial load in their intestine [21].
Bacterial endotoxin LPS seeping through alcohol-disrupted barrier of the intestine is increased in the sera of alcoholics [14-18, 23, 62, 63]. LPS contributes to alcoholic liver disease and therefore DAMP secretion from liver [62]. Reversing dysbiosis by certain antibiotics, probiotics or long-chain fatty acids can restore intestinal barrier function and decrease the subsequent liver damage [28, 64-66]. Intestinal mucus is increased in rats after alcohol feeding and mucin-2 deficiency can ameliorate alcoholic liver disease in mice [67, 68], which further underlines the importance of every aspect of the intestinal barrier.
The pro-inflamatory cytokines, PAMPs and DAMPs originating from the intestine enhance the inflammatory changes in other organs, including liver and brain via direct and indirect effects. Liver is a source of excessive inflammatory cytokine production in alcoholics which are released to the serum, as a response to alcohol and its toxic metabolites, as well as PAMPs and DAMPs originating from the intestine [69]. Both primary and secondary bile acids are increased in alcoholics and are currently suggested to play a role in the pathogenesis of colonic inflammation [70].
Brain damage is more common among alcoholics with cirrhosis and liver-failure than without liver disease [71]. High ammonia level is widely known for its neurotoxic effect, and can activate peripheral benzodiazepine receptors, contributing to astrocyte swelling and subsequent coma [72]. As a reverse interaction, intracerebral IL-1β injection results in hepatic recruitment of neutrophils [57]. It is noteworthy that alcohol
induces cortisol secretion modifying the immune system as part of the neuroimmune pathology [56].
The signaling and regulatory pathways might be similar to regulate gene expression in different organs, as there are similarities in gene expression profiles induced by alcohol in astrocytes and hepatocytes [34, 73, 74].
3.4. Inflammasome
Innate immune signaling pathways are hallmarks of alcohol-induced organ damage affecting intestine, liver, cardiovascular system, and brain [43, 69, 75]. Inflammation and these altered innate immune responses play pivotal roles in the pathogenesis of infectious and degenerative disorders [76, 77]. Part of these pro-inflammmatory changes, inflammatory cytokines and mediators including IL-1β, TNFα, high-mobility group protein-B1 (HMGB1) affect neurons and are associated with disease symptoms in animal models [49].
Figure 4. Inflammasome signaling [template [78] with some alterations].
Increased level of the inflammatory cytokine, IL-1β is found in the sera of alcoholics [79] and in brains and livers of rodents after alcohol intake [43, 80]. The inactive form of IL-1β, pro-IL-1β level is increased in response to PRR including TLR activation upon endogenous or exogenous danger signals [81]. Following activation of the receptors, inflammasome processes pro-IL-1 to mature, active IL-1 via caspase-1 activation [81]. Inflammasomes are multi-protein complexes mostly containing NOD-
like receptors (NLRs: NLRP1, NLRP3, NLRC4); an adapter molecule, ASC; and effector pro-caspase-1 [81]. At first, a priming signal, usually an inflammatory stimuli upregulate the expression of these inflammasome components and target proteins, pro- caspase-1 and pro-IL-1β [82]. A second signal is generally required for inflammasome activation [82]. Upon inflammasome activation, pro-caspase-1 is converted to caspase-1 (a proteolytic, effector enzyme) which then cleaves pro-IL-1β to IL-1β, the bioactive, secretable form (Figure 4) [81].
IL-1β exerts its biologic function via the type I IL-1 receptor (IL-1R) and amplifies inflammation through both autocrine and paracrine manner [83]. The endogenous inhibitor of IL-1R, IL-1R antagonist (IL-1Ra) occupies the IL-1R without transducing activation unlike activators IL-1α and IL-1β (Figure 5) [84].
Figure 5. Interleukin-1-receptor signaling.
3.4.1. Signal 1.
PRR activation is needed for inflammatory gene induction [81]. PRR, TLR4 has a pivotal role in the pathogenesis of alcohol-induced liver damage and neuroinflammation [46, 62]. TLR activation via DAMPs and PAMPs leads to NF-κB activation and subsequently increased cytokine production [85].
Transcription factor NF-κB activation is involved in the pathogenesis of alcohol- induced hepatitis and neuroinflammation [45, 86]. NF-κB is known to induce the transcription of pro-inflammatory cytokines and chemokines, like TNFα, IL-1β and MCP1 [85, 87], all of which are increased in alcohol-induced hepatitis and neuroinflammation [34, 45, 46]. NF-κB activation and TNFα production have been suggested to play role in the pathogenesis of intestinal inflammatory processes [26, 27].
3.4.2. Signal 2.
Posttranslational cleavage of pro-IL-1β to mature IL-1 is required for its functional activity and is executed by the inflammasome through caspase-1 activation [81].
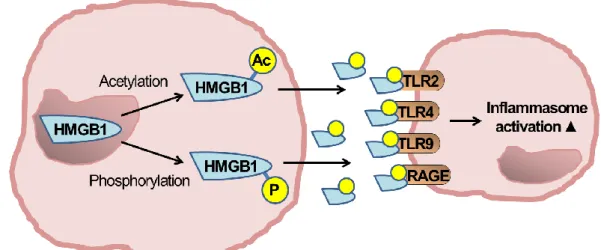
PAMPs or DAMPs in sterile inflammation as a second signal can induce inflammasome activation [22]. DAMPs are molecules or cells that, upon cellular danger/damage, are actively excreted or passively released [88]. A recently widely recognized DAMP, HMGB1 is a nuclear protein that upon cytoplasmic translocation after phosphorylation or acetylation represents a danger signal and activates TLRs and the inflammasome (Figure 6) [89, 90].
Figure 6. HMGB1 activation HMGB1 is passively released from damaged cells or as seen here can actively be excreted from cells after phosphorylation or acetylation.
Inflammasome activation and IL-1β signaling play a role in various liver diseases including acetaminophen injury and non-alcoholic steatohepatitis [91, 92].
Furthermore, inflammasome activation contributes to the pathogenesis of various neurologic disorders including traumatic and thromboembolic brain injury and Alzheimer’s disease [93-96].
The significance of IL-1 signaling and inflammasome activation has not been evaluated in alcoholic intestinal, liver and brain injury which became the target of our research team, the main focus of this thesis is the effect of alcohol on the proximal small intestine and the cerebellum.
4. OBJECTIVES
1. To evaluate the inflammasome activation in the proximal intestine of an animal model of alcoholism.
2. To evaluate the inflammasome activation in the cerebellum of an animal model of alcoholism.
5. METHODS
5.1. Animals
5.1.1. Ethical approval: These studies were conducted according to the regulations of the Institutional Animal Use and Care Committee of the University of Massachusetts Medical School (Worcester, MA).
5.1.2. Genotypes: Six to eight weeks old female C57/BL6J wild type (WT); TLR4 knock-out (KO); apoptosis-associated speck-like protein containing a caspase recruitment domain (ASC) KO; NACHT, LRR and PYD domains-containing protein 3 (NLRP3) KO mice (backcrossed on a C57/BL6J background) were employed.
5.1.3. Diet: The animals on chronic ethanol-regime received 5% (v/v) ethanol (36%
ethanol-derived calories) containing Lieber-DeCarli diet (EtOH) or pair-fed diet (Ctr) with an equal amount of calories where the alcohol-derived calories were substituted with dextran-maltose (Bio-Serv, Frenchtown, NJ, USA) for 5 weeks. The daily consumption of the diet was the same in the WT and KO mouse strains, approximately 10ml/animal. The animals had access to water ad libitum and the consumption was comparable among the different diet groups.
The animals on acute ethanol-regime received 5g/kg 50% (v/v) ethanol diluted in water or an equal amount of water via oral gavage for three consecutive days (otherwise indicated) using a stainless steel 22-gauge feeding tube.
5.1.4. Treatment: Where indicated, WT mice received daily intraperitoneal injection (i.p.) of 25 mg/kg recombinant IL-1Ra (anakinra; Amgen) or equal amount of saline throughout the whole experiment.
Some eight weeks old female C57/BL6J mice were anesthetized with Isoflurane, inhalation, to effect and received 30μl intracranial (posterior fontanelle) injection with recombinant mouse IL-1β (100ng/mouse) (R&D Systems, Inc., Minneapolis, MN) or equal amount of saline solution, these animals were sacrificed six hours after the procedure.
5.1.5. Sample collection and storage: Across the study animals were sacrificed in the morning following cheek bleeding. In the acute model this was 6 or 12 hours after the last gavage (otherwise indicated) and in the chronic alcohol model at 12 hours after the start of the last feeding. The sample collection after chronic feeding in the morning was approximately 3-5 hours following the actual end of the final feeding. Animals were sacrificed by cervical dislocation.
Serum was isolated from blood by centrifugation. The proximal third of the small- intestine was immediately isolated and kept in 2% fetal bovine serum (FBS) containing PBS on ice for further processing. Proximal intestines were immediately flushed with cold PBS, dissected longitudinally, washed further in PBS, until intestinal content was removed. Peyer patches were dissected and discarded. The 1st and the 3rd-6th cm of the proximal intestine were snap frozen in liquid nitrogen for protein evaluation. The 2nd cm was incubated in RNAlater (Qiagen, Hilden, Germany) at 4°C overnight for RNA extraction. Cerebella and cerebra were immediately isolated and were snap frozen or stored in RNAlater. All samples were stored at -80°C.
5.2. Laboratory methods
5.2.1. Alcohol concentration: Blood alcohol content in serum was measured using alcohol analyzer (Analox Instruments, Lunenburg, MA, USA).
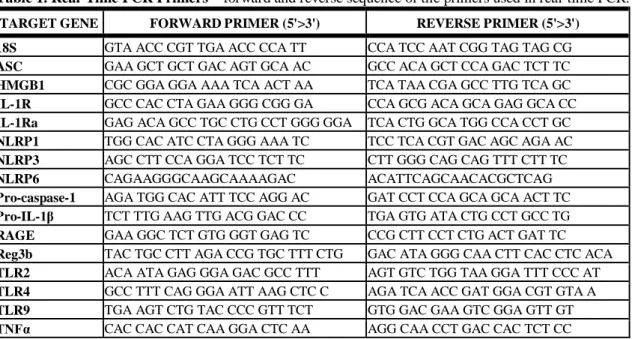
5.2.2. Quantitative polymerase chain reaction (qPCR): RNA was extracted from the 2nd cm of proximal small-intestine, cerebellum or cerebrum using RNeasy kit (Qiagen, Maryland, USA). Optical density (260/280 and 260/230 ratios) was measured to check RNA quality. cDNA was transcribed from 1ug of total RNA by using Reverse Transcription System (Promega Corp., Madison, Wisconsin, USA) in a final volume of 30ul. Sybr-Green-based real-time quantitative PCR was performed using the iCycler (Bio-Rad Laboratories Inc., Hercules, California, USA). Each 25ul reaction contained 200nM of primer mix (1/1, v/v) and 2.5ul of diluted (1/4, v/v) cDNA. Primers used for the experiments are listed in Table 1. The PCR contained a denaturation step for 3 min at 95°C and 45 cycles of 30s at 95°C, 45s at gene-specific annealing temperature and 30s at 72°C for primer extension. MicroAmp optical 96-well reaction plate with optical tape was used for all amplifications and detections. The increase in fluorescence by
double-stranded DNA-binding Sybr-Green was detected each cycle, indicating PCR product accumulation. A dissociation melting curve was performed between 55 and 95°C. Comparative threshold cycle (ΔΔCt) method was used to calculate expressions relative to WT control groups. Ct for the target amplicon and the internal control, 18S gene, were determined. All results were normalized to their own internal control 18S to remove the differences in the amounts of nucleic acid added due to any deficiency of the reverse transcriptase PCR step (ΔCt), the values were then normalized to the average of the actual reference control sample group (ΔΔCt). The final results were expressed as fold changes (2-ΔΔCt) between the sample and the controls corrected with 18S.
Table 1. Real-Time PCR Primers – forward and reverse sequence of the primers used in real-time PCR.
TARGET GENE FORWARD PRIMER (5'>3') REVERSE PRIMER (5'>3') 18S GTA ACC CGT TGA ACC CCA TT CCA TCC AAT CGG TAG TAG CG ASC GAA GCT GCT GAC AGT GCA AC GCC ACA GCT CCA GAC TCT TC HMGB1 CGC GGA GGA AAA TCA ACT AA TCA TAA CGA GCC TTG TCA GC IL-1R GCC CAC CTA GAA GGG CGG GA CCA GCG ACA GCA GAG GCA CC IL-1Ra GAG ACA GCC TGC CTG CCT GGG GGA TCA CTG GCA TGG CCA CCT GC NLRP1 TGG CAC ATC CTA GGG AAA TC TCC TCA CGT GAC AGC AGA AC NLRP3 AGC CTT CCA GGA TCC TCT TC CTT GGG CAG CAG TTT CTT TC
NLRP6 CAGAAGGGCAAGCAAAAGAC ACATTCAGCAACACGCTCAG
Pro-caspase-1 AGA TGG CAC ATT TCC AGG AC GAT CCT CCA GCA GCA ACT TC Pro-IL-1β TCT TTG AAG TTG ACG GAC CC TGA GTG ATA CTG CCT GCC TG RAGE GAA GGC TCT GTG GGT GAG TC CCG CTT CCT CTG ACT GAT TC Reg3b TAC TGC CTT AGA CCG TGC TTT CTG GAC ATA GGG CAA CTT CAC CTC ACA TLR2 ACA ATA GAG GGA GAC GCC TTT AGT GTC TGG TAA GGA TTT CCC AT TLR4 GCC TTT CAG GGA ATT AAG CTC C AGA TCA ACC GAT GGA CGT GTA A TLR9 TGA AGT CTG TAC CCC GTT TCT GTG GAC GAA GTC GGA GTT GT TNFα CAC CAC CAT CAA GGA CTC AA AGG CAA CCT GAC CAC TCT CC
5.2.3. Electrophoretic mobility shift assay (EMSA): End labeling of double-stranded NF-κB oligonucleotide, 5’AGTTGAGGGGACTTTCGC3’ was accomplished by treatment with T4 polynucleotide kinase in the presence of γ32P-ATP (PerkinElmer, Waltham, MA), followed by purification on a polyacrylamide copolymer column (Bio- Rad). Proximal intestinal or cerebellar whole cell lysates (5μg) were incubated with 1μl labeled oligonucleotide (50,000 cpm), 4μl dI-dC (Affymetrix Inc., Santa Clara, CA) and 5X gel buffer (containing 20mM HEPES pH7.9 (Sigma, St. Louis, MO), 50mM KCl (Sigma, St. Louis, MO), 0.1mM EDTA (Boston BioProducts Inc., Ashland, MA), 1mM DTT (Sigma, St. Louis, MO), 5% glycerol (Fisher Scientific, Fair Lawn, NJ), 200 g/ml
BSA in sterile water). A 20 μl final volume was reached by adding nuclease-free water.
For cold competition reaction a 20-fold excess of specific unlabeled double-stranded probe was added to the reaction mixture 20 minutes prior to adding the labeled oligonucleotide. Samples were incubated at room temperature for 20 minutes. Reactions were run on a 4% polyacrylamide gel. Gels were then dried and exposed to an X-ray film at -80°C for 6 hours or overnight where appropriate. Kodak X-OMAT 2000A Processor was used for film development in the darkroom. The films were scanned and densitometry was performed on the images using Multi Gauge Ver.3.2 image software (Fujifilm Corp., USA).
5.2.4. Enzyme-linked immunosorbent assay (ELISA): Tissue lysates were prepared from proximal intestines, cerebella and cerebra in RIPA buffer containing protease and phosphatase inhibitors (1mM PMSF, 1mM NaF, 2mM Na3VO4, 20mM Na4P2O7, protease and phosphatase inhibitor tablet). First, the tissue was homogenized with stainless steel bead (Qiagen, Maryland, USA) in TissueLyser II (Qiagen, Maryland, USA) then clarified by centrifugation. The tissue lysate supernatant was stored at -80°C.
Protein level was measured by ELISA reader using Bio-Rad protein assay dye reagent concentrate (Bio-Rad Laboratories Inc., Hercules, CA). TNFα (BD Biosciences, San Diego, CA) and IL-1β (R&D Systems, Inc., Minneapolis, MN) were measured in whole tissue lysates using specific anti-mouse ELISAs.
5.2.5. Enzyme-activity assay: Caspase-1 colorimetric assay was used to determine the enzymatic activity (R&D Systems, Inc., Minneapolis, MN) from cerebellar and cerebral tissue lysates. It has been shown earlier that the results of caspase-1 activity assay correspond to the Western blot results of cleaved capase-1 p10 protein in liver [34], we further evaluated the method for brain tissue using Western blots (Figure 15E-F).
5.2.6. Endotoxin: Endotoxin levels were evaluated in serum and cerebellar lysates with Limulus Amebocyte Lysate assay (Lonza Group Ltd, Basel, Switzerland).
5.2.7. Western blot: Equal amounts of protein from tissue lysates were run on 15%
polyacrylamide gel. Proteins were transferred to nitrocellulose membrane overnight
then blocked for two hours in blocking buffer-1 or 2. Primary antibodies against mouse Reg3b (R&D Systems Inc., Minnesota, USA), IL-1β (R&D Systems, Inc., Minneapolis, MN), caspase-1 p10 (Santa Cruz Biotechnology Inc., Santa Cruz, CA), HMGB1 (Abcam, Cambridge, MA), and beta-actin (Abcam, Cambridge, MA) were used overnight at 4˚C at different dilution rates varying from 1:100 to 1:30,000 in blocking buffer-1 or 2, followed by three washing steps. For detection, appropriate donkey anti- sheep, goat anti-rat, anti-rabbit or anti-mouse secondary horseradish peroxidase–labeled secondary antibodies (Santa Cruz Biotechnology Inc., Santa Cruz, CA) were used for one hour at a dilution rate of 1:5000 in blocking buffer-1 or 2. The immunoreactive bands of interest were detected by chemiluminescence using Pierce ECL Western blotting substrate (Pierce Biotechnology, Rockford, IL) and LAS-4000IR Ver.2.02 (Fujifilm Corp., USA) for image acquisition. The results were quantified by densitometry analysis using Multi Gauge Ver.3.2 image software (Fujifilm Corp., USA). Blocking buffer-1: 0.1% TWEEN-20 TBS 5% milk. Blocking buffer-2: 0.1%
TWEEN-20 TBS 5% BSA.
5.2.8. Immunoprecipitation: Equal amounts of proteins from cerebellar tissue lysates were pre-cleaned with anti-rabbit Ig IP beads (eBioscience, Inc., San Diego, CA). Beads were removed by centrifuge and supernatants were incubated and rotated overnight at 4˚C with 5 g anti-HMGB1 or anti-acetyl lysine Ab (Abcam, Cambridge, MA) or normal rabbit IgG (Santa Cruz Biotechnology Inc., Santa Cruz, CA) as a negative control. Samples were partially rotated for one hour with anti-rabbit Ig IP beads at 4˚C.
The formed immune complexes were collected by centrifugation, washed three times and boiled with 2X Laemmli’s sodium dodecyl sulfate-sample buffer (Boston BioProducts, Ashland, MA) to dissociate from the beads. The beads were then removed by centrifugation. Protein was separated from the supernatants by polyacrylamide gel electrophoresis. Proteins were transferred to nitrocellulose membrane and blocked for two hours in blocking buffer-2 or TBS with 3% BSA, 0.1% gelatin and 0.2% TWEEN- 20. The membrane was incubated overnight at 4˚C with 3 g/ml anti-phosphoserine or 1
g/ml anti-HMGB1 Ab (Abcam, Cambridge, MA) in blocking buffer-2 or 3. The membrane was washed three times and incubated for an hour with HRP-conjugated secondary anti-rabbit IgG Ab (eBioscience, Inc., San Diego, CA) at 1:5000 dilution in
blocking buffer-2 or 3. The immunoreactive bands were detected by chemiluminescence using Pierce ECL Western blotting substrate and LAS-4000IR. The results were quantified by densitometry using Multi Gauge Ver.3.2 image software. The loading control was detected on a separate gel by monoclonal mouse anti-beta-actin. Blocking buffer-3: 0.2% TWEEN-20 TBS containing 0.5% BSA.
5.3. Statistical analysis:
Since data was not normally distributed, statistical analysis was performed using Kruskal-Wallis nonparametric test. Data are shown as average ± standard error of the mean (SEM). Differences were considered statistically significant at P value ≤ 0.05.
6. RESULTS
6.1. Proximal small intestine
6.1.1. Serum alcohol content in alcohol-fed mice
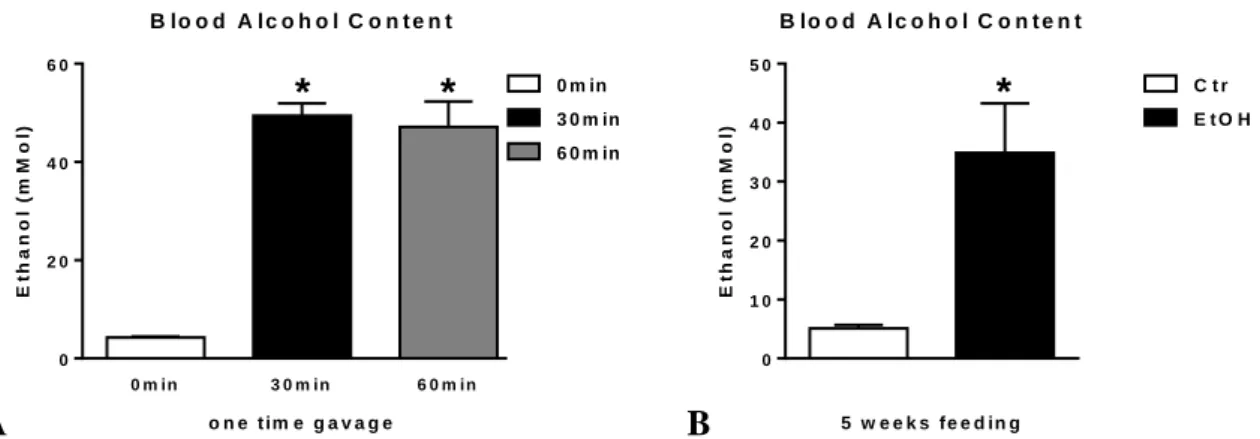
Mice receiving either one-time alcohol gavage (Figure 7A) or 5 weeks of alcohol feeding (Figure 7B) have significantly higher blood alcohol content than their appropriate controls.
A
0 m in 3 0 m in 6 0 m in
0 2 0 4 0 6 0
B lo o d A lc o h o l C o n t e n t
o n e t im e g a v a g e
Ethanol (mMol)
0 m in
* 3 0 m in
6 0 m in
*
0 m in 3 0 m in 6 0 m in
0 2 0 4 0 6 0
B lo o d A lc o h o l C o n t e n t
o n e t im e g a v a g e
Ethanol (mMol)
0 m in
* 3 0 m in
6 0 m in
*
B
0 1 0 2 0 3 0 4 0 5 0
B lo o d A lc o h o l C o n t e n t
5 w e e k s f e e d in g
Ethanol (mMol)
* C t r
E t O H
Figure 7. Serum alcohol content in alcohol-fed mice. Wild type (WT; n=6 or 7) mice were fed with ethanol (EtOH) or isocaloric (Ctr) diet for 5 weeks, or had a single oral gavage of 50% 5g/kg ethanol (WT; n=6) where blood was collected 30 or 60min after. Blood alcohol content in serum was measured using alcohol analyzer (A-B). Bars represent mean±SEM (*: P value<0.05 relative to appropriate isocaloric or 0min controls, respectively, by Kruskal-Wallis non-parametric test).
6.1.2. Serum-endotoxin level in alcohol-fed mice
Mice receiving either three days alcohol gavage (Figure 8A) or 5 weeks of alcohol feeding (Figure 8B) have significantly higher serum-endotoxin levels than their appropriate controls. Twelve hours after alcohol gavage, no difference of serum- endotoxin level is found between alcohol gavage and control groups (Figure 8A).
A
6 h 1 2 h
0 1 2 3
S e r u m - e n d o t o x i n
3 d a y s g a v a g e
Endotoxin (fold change)
*
C t r E t O H
B
0 .0 0 .5 1 .0 1 .5 2 .0 2 .5
S e r u m - e n d o t o x i n
5 w e e k s f e e d in g
Endotoxin (fold change) * C t r
E t O H
Figure 8. Serum-endotoxin level in alcohol-fed mice. Wild type mice were gavaged daily 50% 5g/kg ethanol (EtOH; n=6) or equal amount of saline (Ctr; n=6) for three consecutive days or were fed with 5%
ethanol containing (EtOH; n=8) or isocaloric (Ctr; n=7) diet for 5 weeks. Serum-endotoxin measurement was executed using Limulus Amebocyte Lysate-assay (A-B). Bars represent mean±SEM (*: P value<0.05 relative to appropriate controls by Kruskal-Wallis non-parametric test).
6.1.3. Intestinal antimicrobial protein expression in alcohol-fed mice
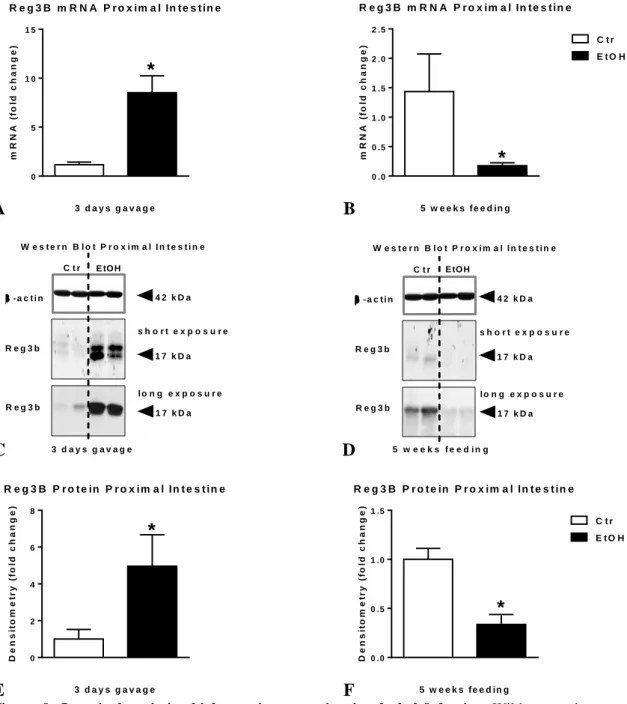
Both mRNA (Figure 9A) as well as protein level (Figure 9C, E) of Reg3b is significantly higher in the small intestine of mice receiving alcohol gavage than their controls.
A
0 5 1 0 1 5
R e g 3 B m R N A P r o x im a l In t e s t in e
3 d a y s g a v a g e
mRNA (fold change)
*
C t r E t O H
B
0 .0 0 .5 1 .0 1 .5 2 .0 2 .5
R e g 3 B m R N A P r o x im a l In t e s t in e
5 w e e k s f e e d in g
mRNA (fold change)
*
E t O H C t r
C
W e s t e r n B l o t P r o x i m a l I n t e s t i n e
4 2 k D a
- a c t i n
R e g 3 b
1 7 k D a C t r E tO H
3 d a y s g a v a g e
1 7 k D a R e g 3 b
s h o r t e x p o s u r e
l o n g e x p o s u r e
W e s t e r n B l o t P r o x i m a l I n t e s t i n e
4 2 k D a
- a c t i n
R e g 3 b
1 7 k D a C t r E tO H
1 7 k D a R e g 3 b
s h o r t e x p o s u r e
l o n g e x p o s u r e
5 w e e k s f e e d i n g
W e s t e r n B l o t P r o x i m a l I n t e s t i n e
4 2 k D a
- a c t i n
R e g 3 b
1 7 k D a
C t r E tO H C t r E tO H
3 D g a v a g e
1 7 k D a R e g 3 b
s h o r t e x p o s u r e
l o n g e x p o s u r e
5 W f e e d i n g
D
W e s t e r n B l o t P r o x i m a l I n t e s t i n e
4 2 k D a
- a c t i n
R e g 3 b
1 7 k D a C t r E tO H
3 d a y s g a v a g e
1 7 k D a R e g 3 b
s h o r t e x p o s u r e
l o n g e x p o s u r e
W e s t e r n B l o t P r o x i m a l I n t e s t i n e
4 2 k D a
- a c t i n
R e g 3 b
1 7 k D a C t r E tO H
1 7 k D a R e g 3 b
s h o r t e x p o s u r e
l o n g e x p o s u r e
5 w e e k s f e e d i n g
W e s t e r n B l o t P r o x i m a l I n t e s t i n e
4 2 k D a
- a c t i n
R e g 3 b
1 7 k D a
C t r E tO H C t r E tO H
3 D g a v a g e
1 7 k D a R e g 3 b
s h o r t e x p o s u r e
l o n g e x p o s u r e
5 W f e e d i n g
E
0 2 4 6 8
R e g 3 B P r o t e in P r o x im a l In t e s t in e
3 d a y s g a v a g e
Densitometry (fold change)
* C t rE t O H
F
0 .0 0 .5 1 .0 1 .5
R e g 3 B P r o t e in P r o x im a l In t e s t in e
5 w e e k s f e e d in g
Densitometry (fold change)
*
E t O H C t r
Figure 9. Intestinal antimicrobial protein expression in alcohol-fed mice. Wild type mice were gavaged daily 50% 5g/kg ethanol (EtOH; n=6) or equal amount of saline (Ctr; n=6) for three consecutive days or were fed with 5% ethanol containing (EtOH; n=8) or isocaloric (Ctr; n=7) diet for 5 weeks.
Regenerating islet-derived protein III-beta (Reg3b) mRNA was assessed by qRT-PCR in proximal small intestine using 18S internal control (A-B). Reg3b protein in whole SB lysates was assessed by Western blot using β-actin loading control (C-D), and further quantified by densitometry (E-F). Bars represent mean±SEM (*: P value<0.05 relative to appropriate controls by Kruskal-Wallis non-parametric test).
In contrast, the expression of Reg3b in the small intestine of chronic alcohol-fed mice is significantly lower both at mRNA (Figure 9B) as well as protein level compared to controls (Figure 9D, F). (Average; SEM of density values of saline vs. alcohol gavage 248; 98 vs. 1226; 426 and PF vs. EtOH-feeding [longer exposure] 265; 20 vs. 107; 31, respectively).
6.1.4. Intestinal NF-κB activation in alcohol-fed mice
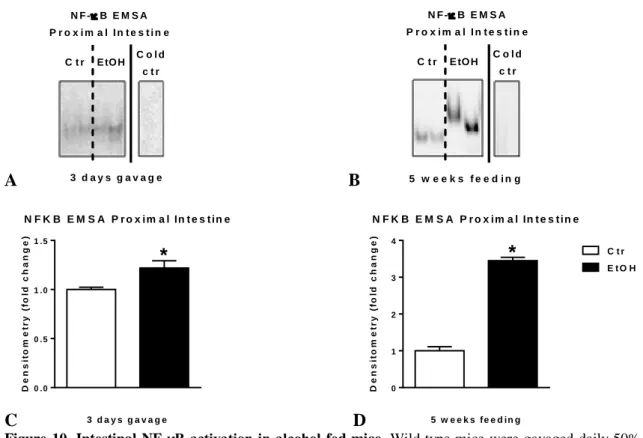
Both alcohol gavage and chronic alcohol feeding results in significantly higher NF-κB activation and DNA binding in proximal small intestine of mice compared to controls (Figure 10A-D). The magnitude of increase is significantly greater in mice with chronic compared to acute binge alcohol administration.
A
N F -B E M S A P r o x i m a l I n t e s t i n e C t r
C o l d c t r
C o l d c t r
3 D g a v a g e 5 W f e e d i n g E tO H C t r E tO H N F -B E M S A
P r o x i m a l I n t e s t i n e
C t r C o l d
c t r
3 d a y s g a v a g e
E tO H C o l d
c t r
5 w e e k s f e e d i n g C t r E tO H
N F -B E M S A P r o x i m a l I n t e s t i n e
B
N F -B E M S A P r o x i m a l I n t e s t i n e C t r
C o l d c t r
C o l d c t r
3 D g a v a g e 5 W f e e d i n g E tO H C t r E tO H N F -B E M S A
P r o x i m a l I n t e s t i n e
C t r C o l d
c t r
3 d a y s g a v a g e
E tO H C o l d
c t r
5 w e e k s f e e d i n g C t r E tO H
N F -B E M S A P r o x i m a l I n t e s t i n e
C
0 .0 0 .5 1 .0 1 .5
N F K B E M S A P r o x im a l In t e s t in e
3 d a y s g a v a g e
Densitometry (fold change)
* C t r
E t O H
D
0 1 2 3 4
N F K B E M S A P r o x im a l In t e s t in e
5 w e e k s f e e d in g
Densitometry (fold change)
*
E t O H C t r
Figure 10. Intestinal NF-κB activation in alcohol-fed mice. Wild type mice were gavaged daily 50%
5g/kg ethanol (EtOH; n=6) or equal amount of saline (Ctr; n=6) for three consecutive days or were fed with 5% ethanol containing (EtOH; n=8) or isocaloric (Ctr; n=7) diet for 5 weeks. Nuclear factor-κB (NF- κB) activation of whole proximal small intestinal lysates was assessed by EMSA (A-B), loading equal amounts of protein, using EtOH-fed intestinal sample for cold competition control (cold ctr), and further quantified by densitometry (C-D). Bars represent mean±SEM (*: P value<0.05 relative to appropriate controls by Kruskal-Wallis non-parametric test).
6.1.5. Intestinal TNFα level in alcohol-fed mice
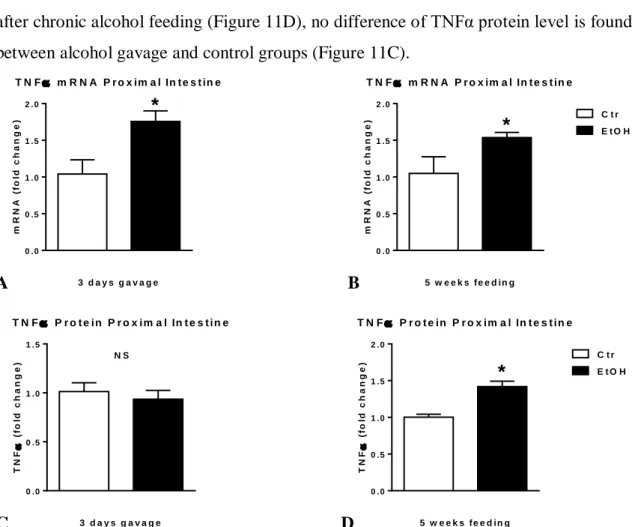
TNFα mRNA levels are significantly higher in the proximal small intestine of mice after both acute binge and chronic alcohol feeding compared to controls (Figure 11A-B).
However, murine proximal small intestinal TNFα protein levels are significantly higher after chronic alcohol feeding (Figure 11D), no difference of TNFα protein level is found between alcohol gavage and control groups (Figure 11C).
A
0 .0 0 .5 1 .0 1 .5 2 .0
T N F m R N A P r o x im a l In t e s t in e
3 d a y s g a v a g e
mRNA (fold change)
*
E t O H C t r
B
0 .0 0 .5 1 .0 1 .5 2 .0
T N F m R N A P r o x im a l In t e s t in e
5 w e e k s f e e d in g
mRNA (fold change)
* E t O H
C t r
C
0 .0 0 .5 1 .0 1 .5
T N F P r o t e in P r o x im a l In t e s t in e
3 d a y s g a v a g e
TNF (fold change) N S
E t O H C t r
D
0 .0 0 .5 1 .0 1 .5 2 .0
T N F P r o t e in P r o x im a l In t e s t in e
5 w e e k s f e e d in g
TNF (fold change)
* E t O H
C t r
Figure 11. Intestinal TNFα level in alcohol-fed mice. Wild type mice were gavaged daily 50% 5g/kg ethanol (EtOH; n=6) or equal amount of saline (Ctr; n=6) for three consecutive days or were fed with 5%
ethanol containing (EtOH; n=8) or isocaloric (Ctr; n=7) diet for 5 weeks. Tumor necrosis factor-α (TNFα) mRNA was assessed by qRT-PCR in proximal small intestine using 18S internal control (A-B). TNFα protein in whole proximal small intestinal lysates was assessed by specific ELISA (C-D). Bars represent mean±SEM (*: P value<0.05; NS: not significant; relative to appropriate controls by Kruskal-Wallis non- parametric test).
6.1.6. Intestinal IL-1β level in alcohol-fed mice
No difference of murine proximal intestinal pro-IL-1β mRNA (Figure 12A-B) or IL-1β protein (Figure 12C-D) level is found between either alcohol gavage or chronic alcohol- feeding and appropriate control groups [unpublished data].
A
0 .0 0 .5 1 .0 1 .5
P r o - IL - 1 m R N A P r o x im a l In t e s t in e
3 d a y s g a v a g e
mRNA (fold change) N S
E t O H C t r
B
0 .0 0 .5 1 .0 1 .5
P r o - IL - 1 m R N A P r o x im a l In t e s t in e
5 w e e k s f e e d in g
mRNA (fold change) N S
E t O H C t r
C
0 .0 0 .5 1 .0 1 .5
IL - 1 P r o t e in P r o x im a l In t e s t in e
3 d a y s g a v a g e
IL-1 (fold change) N S
E t O H C t r
D
0 .0 0 .5 1 .0 1 .5
IL - 1 P r o t e in P r o x im a l In t e s t in e
5 w e e k s f e e d in g
IL-1 (fold change) N S
E t O H C t r
Figure 11. Intestinal IL-1β level in alcohol-fed mice [unpublished data]. Wild type mice were gavaged daily 50% 5g/kg ethanol (EtOH; n=6) or equal amount of saline (Ctr; n=6) for three consecutive days or were fed with 5% ethanol containing (EtOH; n=8) or isocaloric (Ctr; n=7) diet for 5 weeks. Pro- interleukin-β (pro-IL-1β) mRNA was assessed by qRT-PCR in proximal small intestine using 18S internal control (A-B). IL-1β protein in whole proximal small intestinal lysates was assessed by specific ELISA (C-D). Bars represent mean±SEM (NS: not significant relative to appropriate controls by Kruskal- Wallis non-parametric test).
6.1.7. Intestinal inflammasome expression in alcohol-fed mice
No difference of murine proximal small intestinal NLRP3, NLRP6, ASC and pro- caspase-1 mRNA is found between either alcohol gavage (Figure 12A) or chronic alcohol-feeding (Figure 12B) and appropriate control groups [unpublished data].
![Figure 4. Inflammasome signaling [template [78] with some alterations].](https://thumb-eu.123doks.com/thumbv2/9dokorg/1346351.109384/16.892.175.721.558.898/figure-inflammasome-signaling-template-alterations.webp)
![Figure 11. Intestinal IL-1β level in alcohol-fed mice [unpublished data]. Wild type mice were gavaged daily 50% 5g/kg ethanol (EtOH; n=6) or equal amount of saline (Ctr; n=6) for three consecutive days or were fed with 5% ethanol containing](https://thumb-eu.123doks.com/thumbv2/9dokorg/1346351.109384/30.892.129.765.121.634/figure-intestinal-alcohol-unpublished-gavaged-ethanol-consecutive-containing.webp)
