E-mail address: kristoft@almos.uni-pannon.hu
Simulation study of intercalation complexes of kaolinite with simple amides as primary intercalation reagents
Tamás Kristófa*, Zsófia Sarkadia Zoltán Hatóa and Gábor Rutkaib
aDepartment of Physical Chemistry, Institute of Chemistry, University of Pannonia P.O. Box 158, H-8201 Veszprém, Hungary
bThermodynamics and Energy Technology, University of Paderborn, D-33098 Paderborn, Germany
Abstract
Delamination/exfoliation of book-like kaolinite particles is one of the most promising ways to produce aluminosilicate nanoscrolls. For the delamination of the kaolinite layers, multi-step intercalation/deintercalation procedures are used. In the first, direct intercalation step, the intercalation reagents are typically small organic molecules possessing high dipole moment.
We modeled, evaluated and compared the incorporation features of formamide, urea and N- methylformamide molecules into the interlayer space of kaolinite by classical molecular simulations using realistic CHARMM-based atomic force fields. Besides the determination of characteristic basal spacings of the intercalation complexes, we compared the density and orientation distributions of the guest molecules, as well as atomic pair correlation functions.
From the simulations we also calculated the typical intermolecular interaction energies and estimated the translational mobility of the different substances. Our results show that urea has some preference over the other substances in multi-step, heat-treating intercalation/deintercalation procedures with kaolinite.
Keywords: kaolinite intercalation, amide, atomistic simulation, structure and energy analyses
2
1. Introduction
Kaolinite (Al2Si2O5(OH)4) is a layered aluminosilicate with a 1:1 layer structure. An individual layer consists of an octahedral aluminum hydroxide sheet and a tetrahedral silica sheet, sharing a common plane of apical oxygen atoms. Layers are held together by hydrogen bonds between surface hydroxyl groups of the aluminum hydroxide sheet and the basal oxygen atoms of the silica sheet, forming a distinct space between the layers. The equilibrium basal spacing of natural kaolinite is around 0.72 nm. Kaolinite is often used for the preparation of intercalated materials, as it can readily intercalate a few selected molecules.
Highly polar organic molecules such as urea (U), formamide (FA), or dimethyl sulfoxide (DMSO), and alkali salts such as alkali acetates can expand the interlayer space of pure kaolinite by spontaneously replacing the hydrogen bonds between the layers [1]. The expansion caused by such primary intercalation reagents have been studied in several works [2-11]. Multiple intercalation/deintercalation procedures using longer chain molecules as secondary or tertiary reagents (which can replace the already intercalated reagents) [12-16]
are applied to increase the layer spacing, even to the extent that the attraction of the layers is overcome. This delamination process enables the formation of kaolinite nanoscrolls.
Delamination/exfoliation of the book-like kaolinite particles is one of the most favorable ways to produce aluminosilicate nanoscrolls, which have numerous applications in nanocomposite materials (e. g. as catalyst carrier) [17].
In the present work, we focus on the intercalations of kaolinite with FA and its relative compounds, U and N-methyl-formamide (NMF). U has one of the earliest practical applications in preparation of kaolinite organocomplexes [16], but the kaolinite-FA and kaolinite-NMF intercalation complexes have also been widely studied in experiments [3, 4, 9, 13]. Recent findings [18] highlighted the significance of utilizing U as primary reagent in
3
multiple intercalation/deintercalation procedures, and here application of other small amide molecules is also worth considering. To compare the properties of these complexes in detail, we used classical molecular simulation. Adsorption and intercalation of molecules in clays are effectively studied by means of such techniques [19-24], uncovering material features that are currently not available from experiments. In our earlier studies we provided predictions by molecular simulations for intercalation complexes with potassium and ammonium acetates [25-27], methanol [28], and cetyltrimethylammonium chloride [29], using the standard all- atom force field, CHARMM [30], and its highly realistic extension for kaolinite, INTERFACE [31].
2. Material and Methods
Classical Molecular Dynamics (MD) simulations were carried out with constant number of molecules N, at constant pressure p (mostly 1.013 bar) and at constant temperature T (mostly 298 K). The leap-frog integrator was used with the integral time step of 1 fs. The
temperature and pressure controls were realized by using the Nosé-Hoover [32] and Parrinello-Rahman [33, 34] schemes, respectively. The pressure coupling was semi-isotropic:
isotropic in the x- and y-directions, but different in the z-direction, which latter is perpendicular to the kaolinite layers. Periodic boundary conditions were applied in all three spatial directions. The van der Waals interactions were truncated at 1.2 nm and the periodic electrostatic interactions were calculated by the particle mesh Ewald (PME) [35] algorithm with 1.2 nm cutoff. All the simulations were performed using the GROMACS [36, 37]
program package.
The lattice parameters of the kaolinite unit cell, Al2Si2O5(OH)4, are a = 0.5154 nm, b = 0.8942 nm, c = 0.7391 nm, α = 91.93°, β = 105.05°, γ = 89.80° (the space group symmetry is
4
C1) [38]. We constructed a simulation box that consisted of four clay layers built from 96
double unit cells that are arranged in a 6×4×4 composition resulting in 816 atoms (96 Al atoms, 96 Si atoms, 432 O atoms, and 192 H atoms) per kaolinite layers. The layers are stacked upon each other forming four interlayer regions. The initial atomic positions were set according to the experimental crystal structure of kaolinite [38]. This initial arrangement of the simulation cell is shown in Fig. 1.
Fig. 1 Snapshot of the simulation cell with the initial configuration of the non-intercalated kaolinite.
The framework of a standard fully flexible all-atom force field, CHARMM [30] was used for handling the atomic interactions. Only the bond vibrations including hydrogen atoms (which are generally beyond the classical limits of molecular simulations based on force fields) were constrained with the LINCS algorithm [39]. The energy expression of the CHARMM force field contains quadratic bond stretching, angle bending, torsion and out-of- plane potential terms (bonded interactions), as well as standard Coulombic and 12-6 Lennard- Jones potential terms (nonbonded interactions). The van der Waals nonbonded interactions were treated with the Lorentz-Berthelot combination rule. The parameters for kaolinite were taken from the INTERFACE v1.5 force field [40]. For the investigated guest molecules (FA, U, NMF and, for comparison, DMSO) the CHARMM27 force field variant implemented in GROMACS [41] were applied. For U, charges were taken from the work of Caflisch and Karplus [42]. For NMF and DMSO, all the parameters are from CGenFF v. 2b8 [43] and the molecular models were adapted from the work of Fisher et al. [44].
5
Due to moderate convergence of the simulations with such flexible guest molecules, the starting configurations for the production runs were made with special care. Initially, the guest molecules were created with random positions and orientations within artificially enlarged interlayer spaces of the clay, generating four different guest molecule arrangements in the four interlayer spaces. Then, after a short energy minimization of the system, an equilibration period using the more robust Berendsen thermostat and barostat [45, 46] were applied with 10 times the final compressibility (material ‘softness’) parameter in the z- direction. The total production runs using the Nosé-Hoover and Parrinello-Rahman schemes were 20 ns long.
3. Results and Discussion
3.1 Identification of stable complexes
We performed a series of NpT MD simulations with various guest molecule loadings of kaolinite at p = 1.013 bar and T = 298 K and calculated the resulting basal spacings as simulation averages (adsorption on the outer surface of the kaolinite particles was not considered). Following the usual method [47, 23], we identified stable regions in the basal spacing vs. loading plane, where the calculated basal spacing does not change substantially with the guest molecule content. Due to its simplicity, this approach is a straightforward choice for simulation analyses, even if it requires a series of simulation runs and the selection of the lower and upper limits for the composition of the stable complexes is somewhat arbitrary. The approach is upheld by our recent work using stability analysis with chemical potential calculations [48]. An inflexion point that can always be found within the selected region (typically a middle point or a point that falls near the middle point at a slightly higher guest molecule content) can serve as a representative point of the region. Generally, this point
6
can be assigned to the experimentally detected complex, taking into account the similarity between the width of the X-ray peak in experiments and the narrow range of basal spacing identified from simulations (at least a part of the usual X-ray peak broadening can be associated with the small change of basal spacing,for a rather large change of loading, within the stability region in simulations).
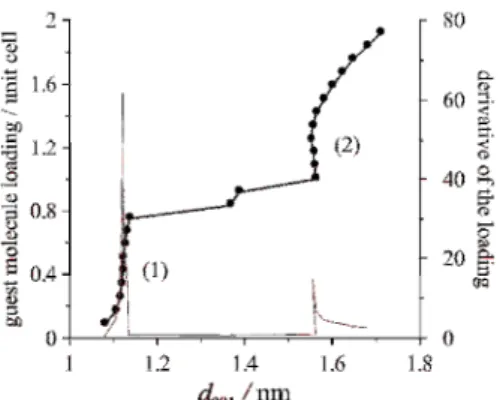
As a demonstrative example, Fig. 2 shows the loading of kaolinite with DMSO as a function of the calculated basal spacing, together with the first derivative of the loading. The shape of the curve of loading and the intense peak of the curve of first derivative of the loading suggest a stable intercalation complex at 1.12 nm, which agrees well with experiment [1]. At this inflexion point, the DMSO loading per unit cell is equal to 0.50. At higher guest molecule contents, the curves indicate another stable complex around 1.55 nm (with guest molecule loading per unit cell around 1.25), but the existence of this complex is not confirmed experimentally. Recently, a combined experimental and atomistic simulation study [49] dealt with the intercalation with DMSO, also confirmed the experimental findings for the 1.12-nm kaolinite-DMSO complex, the supposed monolayer arrangement of the DMSO molecules as well as the role of hydrogen bonds.
Fig. 2 Loading of kaolinite with DMSO as a function of the calculated basal spacing from NpT MD simulations at 298 K and 1.013 bar.
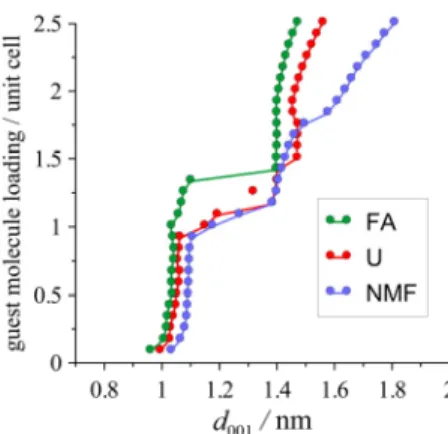
The basic simulation results for the investigated amides are depicted in Fig. 3, and Table 1 lists the key characteristics of the identified complexes in comparison with available
7
experimental data. For the first stable complexes (type-1, lower guest molecule contents), good match was found between the calculated and experimental basal spacing values. The experimental basal spacing is slightly underestimated with U but overestimated with NMF.
FA represents a special case, where two somewhat different experimental data exist with relatively low guest molecule contents, one of which is perfectly reproduced by simulation.
For all the amides, we detected a second stable state (type-2) at higher guest molecule contents, but the identification of this state is subject to higher uncertainty. Although the reality of these complexes is still an open question, it is indirectly confirmed by the experimentally proven existence of a second kaolinite intercalation complex with potassium (and also ammonium) acetate [23, 25, 27].
Fig. 3 Loading of kaolinite with the investigated amides as a function of the calculated basal spacing from NpT MD simulations at 298 K and 1.013 bar (the statistical uncertainties do not exceed the
symbol size).
3.2 Structural comparison of the amide intercalation complexes
The following structural analysis refers to the simulated stable states presented in Table 1. From the above results it seems that incorporation of the investigated amide molecules leads to the formation of fairly similar intercalation complexes, and the obtained differences in the first basal spacing (type-1 complex) only reflect the size dissimilarities between FA, U and NMF molecules.
8
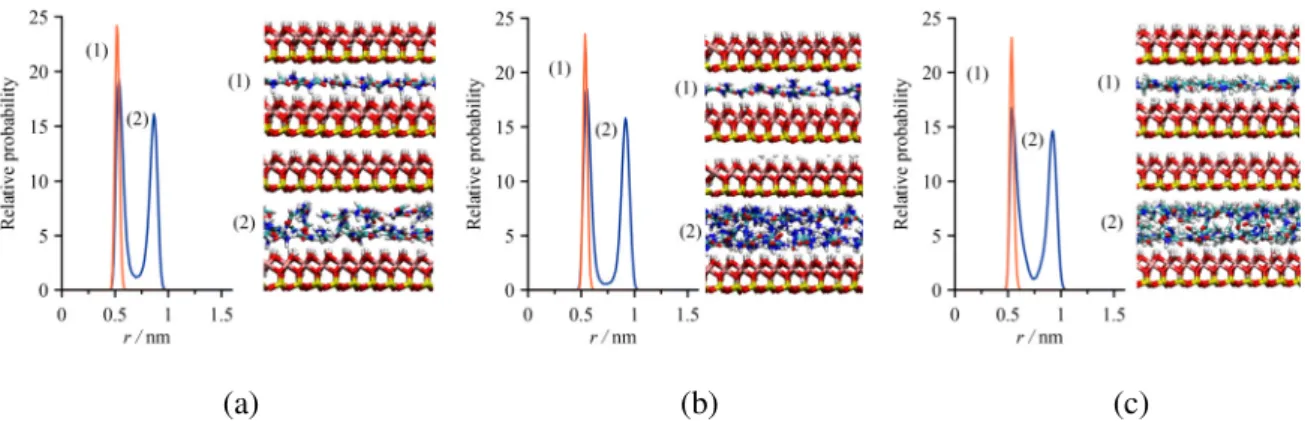
The density distributions of the guest molecules (Fig. 4, left panels) exhibit one intense peak at the calculated first basal spacing (type-1 complex) and two distinct peaks at the second one (type-2 complex), revealing single-layered and double-layered structures, respectively.
(a) (b) (c)
Fig. 4 Left panels: density profiles of the intercalated FA (a), U (b) and NMF (c) for the type-1 (1, orange) and type-2 (2, blue) intercalation complexes (r is the distance from the center of mass of the
lower kaolinite layer with octahedral upper sheet in the direction perpendicular to the clay layers).
Right panels: representative simulation snapshots (the CPK color convention is used for the atoms, except for carbon /cyan/).
The peak positions and intensities are very similar for all the amides, including the small details such as a slight peak broadening when going from type-1 to type-2 complexes. The corresponding simulation snapshots (Fig. 4, right panels) provide a visual confirmation of the layering structure of the guest molecules. Both the density distributions and the snapshots indicate that the double-layered arrangement is the more diffuse one. The snapshots also show that most of the O-C-N planes of the molecules are constrained in more or less parallel alignment with the kaolinite layers. This is also reflected by the orientation distributions (Fig.
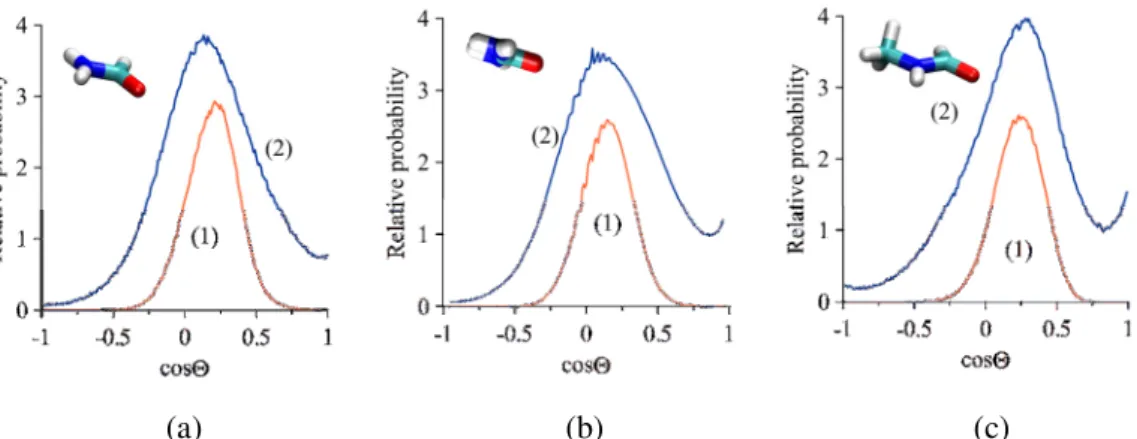
5). The orientation of the guest molecules relative to the clay layers can be characterized by two angles Θ and Φ, whose definitions are given in Fig. 6 [51].
9
(a) (b) (c)
Fig. 5 Distributions of angles Θ of the intercalated FA (a), U (b) and NMF (c) for the type-1 (1) and type-2 (2) intercalation complexes. Insets: most probable orientation of the guest molecules (the CPK
color convention is used for the atoms, except for carbon /cyan/).
Fig. 6 Definition of the orientation of molecules. d is the dipole moment of the molecule, z is the axis normal to the clay surface, and n is a normal vector of the molecular plane (for the molecular plane,
generally an O-C-N plane was used).
The cosine distributions of the dipole moment vector of the guest molecules typically have a local maximum between 0.1 (Θ = 84°) and 0.3 (Θ = 73°) (for convenience, we used here an artificial dipole moment vector along the C=O bond, pointing towards the C atom). This means that, due to geometrical restrictions, the guest molecules tend to align parallel with the kaolinite layers for all the amides, even in the case of type-2 complexes. However, the detected small deviations from the parallel alignment (cosΘ = 0) indicate the preference of the molecules to turn with the dipole moment vector to the tetrahedral silica sheet. In this way, the guest molecules have a chance to form hydrogen bonds between the amine (–NH2) groups and the adjacent silica sheet, as well as between the carbonyl (–CO) groups and the adjacent octahedral aluminum hydroxide sheet. The curves of angle Φ (not shown) turned out to be
10
relatively featureless, and we used them, in combination with the cosΘ distributions, only to determine the favored orientations of the guest molecules (see insets in Fig. 5). It is somewhat surprising that the most probable orientations of the investigated amide molecules in type-2 complexes are practically identical to those of type-1. At the expanded interlayer distance (higher loading) there is more space for the guest molecules to realize orientations other than the parallel one, but this possibility manifests itself only in a more diffuse cosΘ distribution and not in the position change of the peak maximum.
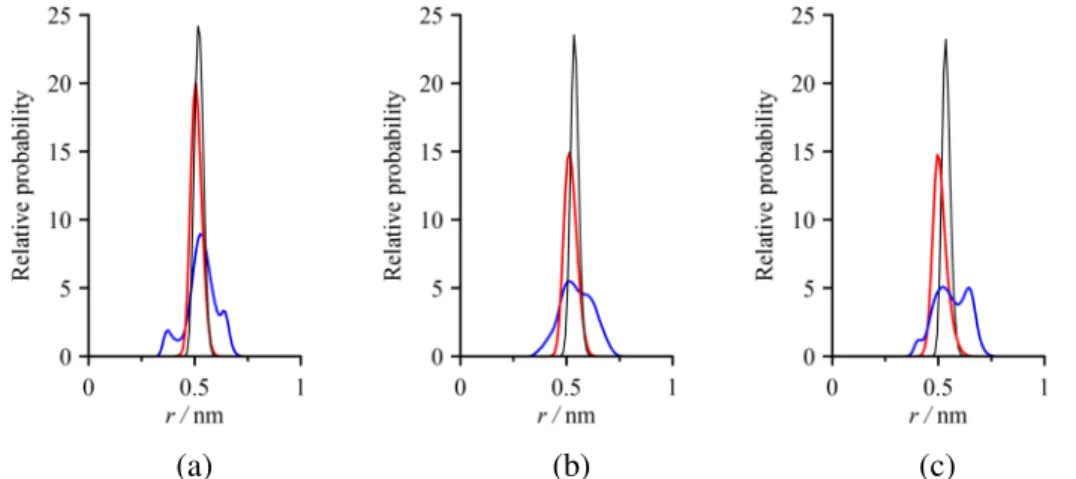
The results for the most probable molecular orientations were cross-checked by analyzing atomic density distributions with type-1 complexes shown in Fig. 7.
(a) (b) (c)
Fig. 7 Atomic density distributions of the intercalated FA (a), U (b) and NMF (c) for the type-1 intercalation complexes (C: black; O: red; H: blue; r is the same as that in Fig. 4).
Here, three different atomic density distributions are displayed. The carbonyl C atom peaks essentially matches the center of mass peaks of molecules (cf. Fig. 4) and the single O atom peaks do not particularly deviate from each other, whereas the shape of the H atom distributions is rather distinctive between these kaolinite-amid complexes. All the carbonyl O atom peaks reside, as expected, between the middle plane of the interlayer space and the plane of the adjacent octahedral sheet of kaolinite. At the same time, the H atom distribution curves show that these atoms are spread over the whole interlayer space. The H atoms of FA form one intense central peak and two weak peaks, near either the adjacent octahedral or tetrahedral
11
sheet. Decomposing the overall H atom distribution into its components reveals that H atoms of the amine group give the peak near the octahedral sheet and part of the central peak, while the formyl (–CHO) H atoms give the peak near the tetrahedral sheet and (the other) part of the central peak. In contrast, U with uniform amine H atoms yields one wide peak, and the average value of the distribution locates closer to the tetrahedral sheet, facilitating the interactions with the silica surface. NMF has three different types of H atom, all of which significantly contribute to the central peak. As obtained from our analysis, the peak appears near the tetrahedral sheet correspond to the methyl (–CH3) and formyl H atoms, and the left shoulder of the central peak being closer to the octahedral sheet correspond to the amine H atoms.
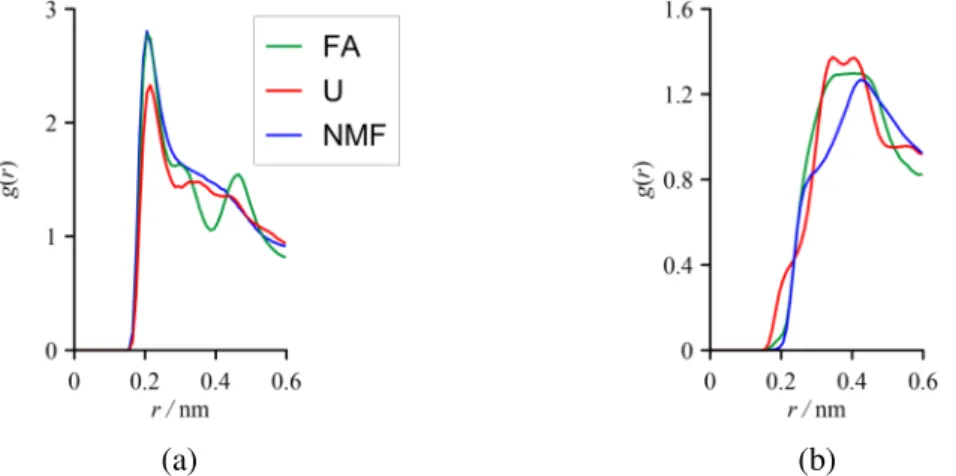
To obtain further details about the character of the hydrogen bonds between the interlayer molecules and the kaolinite surfaces, we calculated the atomic pair correlation functions (local densities in spherical shells relative to the mean density as a function of interatomic distance) for O-H atom pairs (Fig. 8).
(a) (b)
Fig. 8 Atomic pair correlation functions between the carbonyl O atoms and the outer hydroxyl H atoms of the octahedral kaolinite sheet (a) and between the guest H atoms and the surface O atoms of the tetrahedral kaolinite sheet (b) for the type-1 intercalation complexes (r is the interatomic distance).
The positions of the first peak in the atomic pair correlation functions between the outer hydroxyl (–OH) H atoms of the octahedral kaolinite sheet and the carbonyl O atoms of guest
12
molecules are nearly identical for all the amides (0.2 nm) and clearly indicate the existence of medium strong hydrogen bonds. This finding is consistent with a number of infrared spectroscopic results [4, 9]. The peak intensities here are relatively high; the slightly less intense peak of U implies less H-O interactions with the octahedral surface. The pair correlation functions between the surface O atoms of the tetrahedral kaolinite sheet and the different H atoms of guest molecules exhibit broader peaks and their positions suggest weak hydrogen bonds, on average, with the tetrahedral surface. The significantly smaller intensities obtained here indicate that the hydrogen-bonding structure is less probable with the tetrahedral surface. The somewhat exceptional case is again U, where the appearance of the left shoulder of the curve shows that at least a part of the O-H interactions between the silica surface and U are quite strong.
3.3 Energetic analysis of the amide intercalation complexes
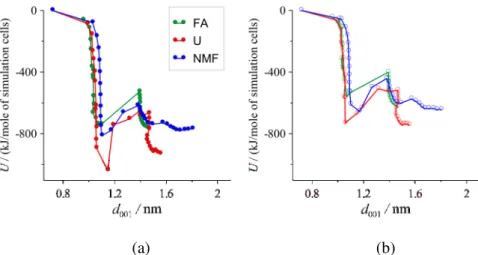
From the outputted trajectory frames of the simulations, we calculated the average minimum image interaction energies between the guest molecules in the interlayer space and between the guest molecules and the adjacent kaolinite layers (the direct layer-layer interaction energy in the complexes was found to be practically zero). The interaction energy between the guest molecules in the interlayer space and the bordering kaolinite layer with octahedral or tetrahedral surface contact sheet are shown in Fig. 9. The curves are, to a certain extent, mirror images of the loading vs. basal spacing curves: their nearly vertical sections locate the stable regions for type-1 and type-2 complexes (the latter with higher uncertainty).
The generally more negative energies in the octahedral case imply stronger attractions between guest molecules and the aluminum hydroxide sheet.
13
(a) (b)
Fig. 9 Average minimum image interaction energies between the guest molecules in the interlayer space and the adjacent kaolinite layer with octahedral (a) or tetrahedral (b) surface contact sheet.
The characteristic energies for the identified type-1 complexes are listed in Table 2. Here, the fairly large negative surface-molecule interaction energies mean an energetically favorable interlayer environment with affinity of the investigated molecules to both kaolinite surfaces. It is also seen, however, that the octahedral surface plays a more important role in the stabilization of these complexes. The contrast is very marked between U and the other amides as U molecules have significantly stronger attraction to the clay surfaces, as well as to each other. This might be connected with the physico-chemical properties of the bulk substance (see, the melting point of U is 406 K, while the melting points of FA and NMF are around room temperature). The apparently higher stability of the complex with U also means that it is more difficult to replace U by additional reagents in room temperature multi-step delamination/exfoliation experiments. The separate interactions of the carbonyl group and the rest of the molecule (mostly amine groups) uncover well-balanced attractions of U to both kaolinite surfaces, whereas the attractions of the other amides to the octahedral or tetrahedral surfaces almost exclusively come from the interactions with the carbonyl group or with the rest of the molecule, respectively (in Table 2, the ratio of group contribution to the total interaction energy above 1 implies net repulsion of that group with the opposite surface).
While from the pair correlation functions (Fig. 8 (b)) it was apparent that a part of the
14
hydrogen bonds between the O atoms of the tetrahedral surface and the H atoms of U are relatively strong, the calculated mean attractive energy between the tetrahedral surface and U without its carbonyl group is the least negative of the three amides (Table 2, last column).
This indicates a more ordered complex, even though it turned out from the corresponding pair correlation functions (not shown) that the strength of the guest-guest hydrogen bonding interactions are very similar to that of the other amides.
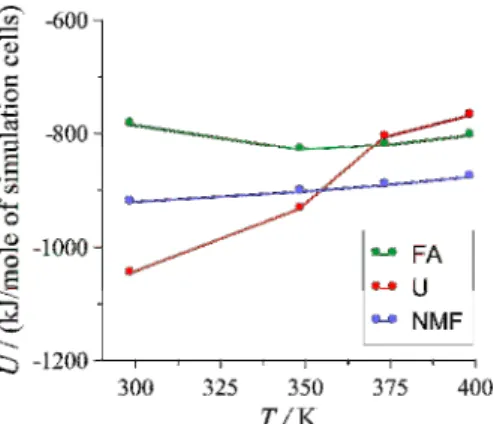
Additional simulations were also performed at elevated temperatures with the kaolinite-guest molecule compositions of type-1 complexes, modeling autoclave experiments with methanol as intermediate intercalation reagent [52, 18]. Using the equilibrium vapor pressure data of methanol, these simulations were carried out at 348.15 K and 1.51 bar, at 373.15 K and 3.54 bar, and at 398.15 K and 7.36 bar. Figure 10 shows the sum of the interaction energies between guest molecules in the interlayer space and the adjacent kaolinite layers.
Fig. 10 Sum of the average minimum image interaction energies between guest molecules in the interlayer space and the adjacent kaolinite layers as a function of temperature for the type-1
intercalation complexes.
As already seen in Table 2, the calculated data predict a more problematic replacement of intercalated U by methanol in conventional room temperature stirring and (multiple) washing experiments. At temperatures near 373 K, however, the attractions of U become weaker than those of FA or NMF, and this fact suggests that U has some preference over the other
15
substances in the autoclave replacement experiments. According to the analysis, the greater energy change of U with temperature, and thus of the shift in the stability order of the complexes, is due to that the interactions of both the carbonyl and amine groups of U weaken profoundly with approaching the melting point of bulk U.
3.4 Mobility of the guest molecules
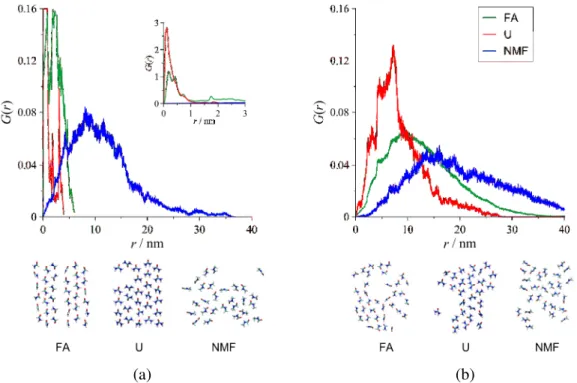
The existence of spatial ordering in the interlayer structure can indirectly be revealed by the low mobility of the interlayer molecules. A suitable way of looking at the translational mobility is provided by the Van Hove correlation function [53], the self-term of which (G(r)) gives the probability that a particle moves a distance of r in a given time interval. The differences between the mobilities of the guest molecules in type-1 complexes at two different temperatures are well illustrated in Fig. 11.
(a) (b)
Fig. 11 Distributions of mobility of the guest molecules in the interlayer space for the type-1 intercalation complexes at 298 K (a) and 373 K (b) (r is the displacement observed in the time interval
of 13 ns). Inset: the whole curves for FA and U at 298 K. Lower panels: simulation snapshots of the typical arrangements of the guest-molecule layers (the CPK color convention is used for the atoms,
except for carbon /cyan/).
16
At 298 K, the curves of FA and U suggest a nearly crystalline character as contrasted to the normal liquid-like behavior of NMF. At 373 K, however, the differences between the curves are not as pronounced, and all the amides show liquid-like mean displacement values.
The inset of Fig. 11 emphasizes that the mobility of U at room temperature is far more constrained than that of FA, which indicates a more ordered complex in the case of U.
Simulation snapshots of some typical arrangements of the guest-molecule layers (perpendicular to the z axis) also show that the most uniform in-plane and out-of-plane molecular orientations develop with U at 298 K.
4. Conclusions
We studied the key characteristics of kaolinite-simple amide intercalation systems by classical atomistic simulation. Using FA, U and NMF, two types of stable kaolinite-amide intercalation complexes were identified and the basal spacings of type-1 complexes are in good agreement with experiments. We characterized the interlayer structure of the complexes by calculating several molecular distribution functions. These confirmed the expected single- layered arrangement of the guest molecules in the first stable (type-1) complexes and a more diffuse double-layered distribution in the second (type-2) ones. It was found that the favored orientations of amide molecules in the first and second stable complexes are similar to each other, exhibiting a roughly perpendicular alignment with the clay layers. Our examinations revealed the existence of weak to fairly strong hydrogen bonds between the amide molecules and the kaolinite surfaces. From energetic analysis of the experimentally relevant type-1 complexes, the prevailing impact of the octahedral surface on stability was detected. At
17
ambient temperature, U shows the largest guest-guest attraction energy as well as the largest binding energies to the clay layers. As opposed to the other amides, its functional groups also have well-balanced attractions to both kaolinite surfaces, which may arise as a consequence of a more oriented and more symmetrical molecular arrangement. A more crystalline-like interlayer structure of its type-1 complex at 298 K is uncovered by the highly constrained mobility of the interlayer molecules. At the same time, this structure turned out to be quite sensitive to temperature increase and the clay-U attraction can weaken with temperature to the utmost extent. This fact facilitates the replacement of U as a primary reagent by other reagents at higher temperatures in multiple intercalation/deintercalation procedures with kaolinite.
The evaluation techniques applied in this work are independent of the type of guest molecules or the layered aluminosilicate. Thus, it can be applied to rank the potential performance of adsorbates and adsorbents of similar systems before any experimental effort is made.
Acknowledgment
Present article was published in the frame of the project GINOP-2.3.2-15-2016-00053 (“Development of engine fuels with high hydrogen content in their molecular structures (contribution to sustainable mobility)”). We gratefully acknowledge the financial support of the Hungarian National Research Fund (OTKA K124353) and the computational support of the Paderborn Center for Parallel Computing (PC2) for providing access to the OCuLUS cluster.
18
References
1. G. Lagaly, M. Ogawa, I. Dékány: Clay Mineral-organic interactions. Ch 10.3 In: F.
Bergaya, G. Lagaly (eds) Handbook of Clay Science, Vol. 5A (Developments in Clay Science). Elsevier, Amsterdam, pp. 435-505 (2013).
2. K. Wada: Lattice expansion of kaolin minerals by treatment with potassium acetate, Am.
Mineral 46 (1961) 78-91.
3. R.L. Ledoux, J.L. White: Infrared studies of hydrogen bonding interaction between kaolinite surfaces and intercalated potassium actate, hydrazine, formamide, and urea, J. Coll.
Int. Sci. 21 (1966) 127-152.
4. S. Olejnik, A.M. Posner, J.P. Quirk: The intercalation of polar organic compounds into kaolinite, Clay Miner. 8 (1970) 421-434.
5. G. Lagaly, R.M. Barrer, K. Goulding: Clay-organic interactions, Phil. Trans. R. Soc.
London A 311 (1984) 315-332.
6. J.J. Tunney, C. Detellier: Chemically modified kaolinite. Grafting of methoxy groups on the interlamellar aluminol surface of kaolinite, J. Mater. Chem. 6(10) (1996) 1679-1685.
7. R.L. Frost, T.H. Tran, J. Kristóf: The structure of an intercalated ordered kaolinite; a Raman microscopy study, Clay Miner. 32 (1997) 587-596.
8. R.L. Frost, J. Kristóf, É. Makó, J.T. Kloprogge: Modification of the hydroxyl surface in potassium-acetate-intercalated kaolinite between 25 and 300°C, Langmuir 16 (2000) 7421- 7428.
9. É. Makó, J. Kristóf, E. Horváth, V. Vágvölgyi: Kaolinite-urea complexes obtained by mechanochemical and aqueous suspension techniques - a comparative study, J. Colloid Interface Sci. 330 (2009) 367-373.
10. C.E. White, J.L. Provis, L.E. Gordon, D.P. Riley, T. Proffen, J.S.J. van Deventer: Effect of temperature on the local structure of kaolinite intercalated with potassium acetate, Chem Mater 23 (2011) 188-199.
11. H. Cheng, Q. Liu, J. Yang, S. Ma, R.L. Frost: The thermal behavior of kaolinite intercalation complexes - A review, Thermochim. Acta 545 (2012) 1-13.
12. J.E.F.C. Gardolinski, G. Lagaly: Grafted organic derivatives of kaolinite: II. Intercalation of primary n-alkylamines and delamination, Clay Miner. 40 (2005) 547-556.
13. Y. Kuroda, K. Ito, K. Itabashi, K. Kuroda: One-step exfoliation of kaolinites and their transformation into nanoscrolls, Langmuir 27 (2011) 2028-2035.
19
14. P. Yuan, D. Tan, F. Annabi-Bergaya, W. Yan, D. Liu and Z. Liu: From platy kaolinite to aluminosilicate nanoroll via one-step delamination of kaolinite: effect of the temperature of intercalation, Appl. Clay Sci. 83-84 (2013) 68-76.
15. J. Matusik, Z. Kłapyta: Characterization of kaolinite intercalation compounds with benzylalkylammonium chlorides using XRD TGA/DTA and CHNS elemental analysis, Appl.
Clay Sci. 83–84 (2013) 433-440.
16. C. Detellier, S. Letaief: Kaolinite-polymer nanocomposites. Ch 13.2 In: F. Bergaya, G.
Lagaly (eds) Handbook of Clay Science, Vol. 5A (Developments in Clay Science), Elsevier, Amsterdam, pp. 707-719 (2013)
17. G. K. Dedzo, C. Detellier: Functional nanohybrid materials derived from kaolinite, Appl.
Clay Sci. 130 (2016) 33-39.
18. É. Makó, A. Kovács, V. Antal, T. Kristóf: One-pot exfoliation of kaolinite by solvothermal cointercalation, Appl. Clay Sci. 146 (2017) 131-139.
19. K.S. Smirnov, D. Bougeard: A molecular dynamics study of structure and short-time dynamics of water in kaolinite, J. Phys. Chem. B. 103 (1999) 5266-5273.
20. M.R. Warne, N.L. Allan, T. Cosgrove: Computer simulation of water molecules at kaolinite and silica surfaces, Phys. Chem. Chem. Phys. 2 (2000) 3663-3668.
21. I.F. Vasconcelos, B.A. Bunker, R.T. Cygan: Molecular dynamics modeling of ion adsorption to the basal surfaces of kaolinite, J. Phys. Chem. C 111 (2007) 6753-6762.
22. G. Rutkai, T. Kristóf: Molecular simulation study of intercalation of small molecules in kaolinite, Chem. Phys. Lett. 462 (2008) 269-274.
23. É. Makó, G. Rutkai, T. Kristóf: Simulation-assisted evidence for the existence of two stable kaolinite/potassium acetate intercalate complexes, J. Colloid Interface Sci. 349 (2010) 442-445.
24. S. Zhang, Q. Liu, H. Cheng, X. Li, F. Zeng, R.L. Frost: Intercalation of dodecylamine into kaolinite and its layering structure investigated by molecular dynamics simulation, J. Colloid Interface Sci. 430 (2014) 345-350.
25. Z. Ható, É. Makó, T. Kristóf: Water-mediated potassium acetate intercalation in kaolinite as revealed by molecular simulation, J. Mol. Model. 20 (2014) 2140.
26. Z. Ható, G. Rutkai, J. Vrabec, T. Kristóf: Molecular simulation study of kaolinite intercalation with realistic layer size, J. Chem. Phys. 141 (2014) 091102.
27. É. Makó, A. Kovács, Z. Ható, B. Zsirka, T. Kristóf: Characterization of kaolinite- ammonium acetate complexes prepared by one-step homogenization method, J. Colloid Interface Sci. 431 (2014) 125-131.
20
28. É. Makó, A. Kovács, Z. Ható, T. Kristóf: Simulation assisted characterization of kaolinite- methanol intercalation complexes synthesized using cost-efficient homogenization method, Appl. Surface Sci. 357 (2015) 626-634.
29. É. Makó, A. Kovács, R. Katona, T. Kristóf: Characterization of kaolinite- cetyltrimethylammonium chloride intercalation complex synthesized through eco-friend kaolinite-urea pre-intercalation complex, Colloid. Surface. A. 508 (2016) 265-273.
30. A.D. MacKerell Jr.: Atomistic Models and Force Fields. In: O.M Becker, A.D. MacKerell Jr., B. Roux, M. Watanabe (eds) Computational Biochemistry and Biophysics, Marcel Dekker, Inc. New York, pp. 7-38 (2001)
31. H. Hein, T.J. Lin, R.K. Mishra, F.S. Emami: Thermodynamically consistent force fields for the assembly of inorganic, organic, and biological nanostructures: The INTERFACE force field, Langmuir 29 (2013) 1754-1765
32. W.G. Hoover: Canonical dynamics: equilibrium phase-space distributions, Phys. Rev. A 31 (1985) 1695–1697.
33. M. Parrinello, A. Rahman: Polymorphic transitions in single crystals: a new molecular dynamics method, J. Appl. Phys. 52 (1981) 7182-7190.
34. S. Nose, M.L. Klein: Constant pressure molecular dynamics for molecular systems, Mol.
Phys. 50 (1983) 1055-1076.
35. T. Darden, D. York, L. Pedersen: Particle mesh Ewald: An N⋅log(N) method for Ewald sums in large systems, J Chem Phys 98 (1993) 10089-10092.
36. H.J.C. Berendsen, D. van der Spoel, R. van Drunen: GROMACS: A message-passing parallel molecular dynamics implementation, Comput. Phys. Commun. 91 (1995) 43-56.
37. B. Hess, C. Kutzner, D. van der Spoel, E. Lindahl: GROMACS 4: Algorithms for highly efficient, load-balanced, and scalable molecular simulation, J. Chem. Theory Comput. 4 (2008) 435-447.
38. D.L. Bish: Rietveld refinement of the kaolinite structure at 1.5 K, Clay. Clay Miner. 41 (1993) 738-744.
39. B. Hess: P-LINCS: A parallel linear constraint solver for molecular simulation, J. Chem.
Theory Comput. 4 (2008) 116-122.
40. Heinz Laboratory USA, INTERFACE FF 1.5, http://bionanostructures.com/interface-md, 2016 (accessed 2016-12-02)
41. P. Bjelkmar, P. Larsson, M.A. Cuendet, B. Bess, E. Lindahl: Implementation of the CHARMM force field in GROMACS: Analysis of protein stability effects from correction maps, virtual interaction sites, and water models, J. Chem. Theory Comput. 6 (2010) 459-466.
21
42. A. Caflisch, M. Karplus: Structural details of urea binding to barnase: a molecular dynamics analysis, Structure 7 (1999) 477-488.
43. K. Vanommeslaeghe, E. Hatcher, C. Acharya, S. Kundu, S. Zhong, J. Shim, E. Darian, O.
Guvench, P. Lopes, I. Vorobyov, A.D. MacKerell Jr.: CHARMM general force field: A force field for drug-like molecules compatible with the CHARMM all-atom additive biological force fields, J. Comput. Chem. 31 (2010) 671-690.
44. N.M. Fischer, P.J. van Maaren, J.C. Ditz, A. Yildirim, D. van der Spoel: Properties of Organic Liquids when Simulated with Long-Range Lennard-Jones interactions, J. Chem.
Theory Comput. 11 (2015) 2938-2944.
45. H.J.C. Berendsen, J.P.M. Postma, A. DiNola, J.R. Haak: Molecular dynamics with coupling to an external bath, J. Chem. Phys. 81 (1984) 3684-3690.
46. G. Bussi, D. Donadio, M. Parrinello: Canonical sampling through velocity rescaling, J.
Chem. Phys. 126 (2007) 014101-1-7
47. Q. Fang, S. Huang, W. Wang: Intercalation of dimethyl sulphoxide in kaolinite: Molecular dynamics simulation study, Chem. Phys. Lett. 411 (2005) 233-237.
48. G. Rutkai, Z. Ható T. Kristóf: Stability of the kaolinite-guest molecule intercalation system: A molecular simulation study, Fluid Phase Equilib. 409 (2016) 434-438.
49. S. Zhang, Q. Liu, H. Cheng, F. Zeng: Combined experimental and theoretical investigation of interactions between kaolinite inner surface and intercalated dimethyl sulfoxide, Appl. Surface Sci. 331 (2015) 234-240.
50. G.J. Churchman, J.S. Whitton, G.C.G. Claridge, B.K.G. Theng: Intercalation method using formamide for differentiated halloysite from kaolinite, Clay. Clay Miner. 32 (1984) 241.
51. P. Jedlovszky, Á. Vincze, G. Horvai: New insight into the orientational order of water molecules at the water/1,2-dichloroethane interface: A Monte Carlo simulation study, J.
Chem. Phys. 117 (2002) 2271-2281.
52. H. Xu, X. Jin, P. Chen, G. Shao, H. Wang, D. Chen, H. Lu, R. Zhang: Preparation of kaolinite nanotubes by a solvothermal method, Ceram. Int. 41 (2015) 6463-6469.
53. L. van Hove: Correlations in Space and Time and Born Approximation Scattering in Systems of Interacting Particles, Phys. Rev. 95(1) (1954) 249.
22
Tables
Table 1 Simulation results for the basal spacing (d001) and number of guest molecules per unit cell (n) of the kaolinite-amide intercalation complexes at 298 K and 1.013 bar.
d001/nm (type-1) n (type-1) d001/nm (type-2) n (type-2) Simulation Experiment
pure kaolinite 0.716 0.713 [38] - - -
kaolinite/FA intercalation complexes 1.039 1.01 [1]
1.04 [50] 0.750 1.40 1.75
kaolinite/U intercalation complexes 1.057 1.07 [1] 0.583 1.47 1.67
kaolinite/NMF intercalation complexes 1.091 1.08 [1] 0.583 1.49 1.75
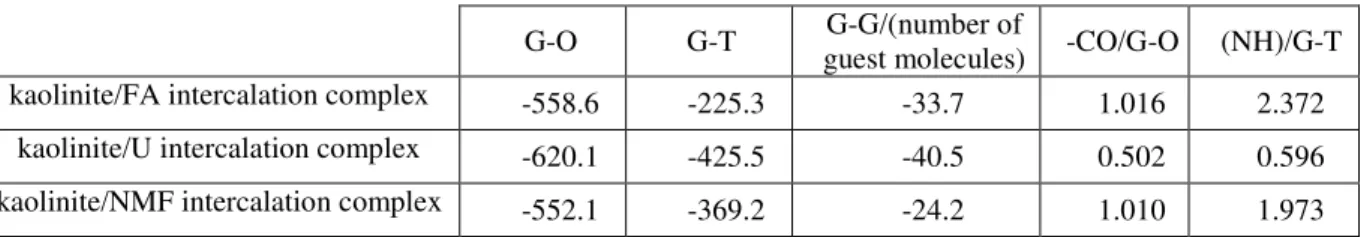
Table 2 Average minimum image interaction energy (in kJ/mole of simulation cells) between the guest molecules in the interlayer space and the adjacent kaolinite layer with octahedral (G- O) or tetrahedral (G-T) surface contact sheet, as well as average intermolecular energy between the guest molecules (G-G) for the type-1 kaolinite-amide intercalation complexes at 298 K and 1.013 bar. -CO/G-O is the ratio of the contribution of carbonyl group to the total G-O interaction energy, (NH)/G-T denotes the contribution of the guest molecule without its carbonyl group to the total G-T interaction energy.
G-O G-T G-G/(number of
guest molecules) -CO/G-O (NH)/G-T kaolinite/FA intercalation complex -558.6 -225.3 -33.7 1.016 2.372
kaolinite/U intercalation complex -620.1 -425.5 -40.5 0.502 0.596 kaolinite/NMF intercalation complex -552.1 -369.2 -24.2 1.010 1.973
23
Figure captions
Fig. 1 Snapshot of the simulation cell with the initial configuration of the non-intercalated kaolinite.
Fig. 2 Loading of kaolinite with DMSO as a function of the calculated basal spacing from NpT MD simulations at 298 K and 1.013 bar.
Fig. 3 Loading of kaolinite with the investigated amides as a function of the calculated basal spacing from NpT MD simulations at 298 K and 1.013 bar (the statistical uncertainties do not exceed the symbol size).
Fig. 4 Left panels: density profiles of the intercalated FA (a), U (b) and NMF (c) for the type- 1 (1, orange) and type-2 (2, blue) intercalation complexes (r is the distance from the center of mass of the lower kaolinite layer with octahedral upper sheet in the direction perpendicular to the clay layers). Right panels: representative simulation snapshots (the CPK color convention is used for the atoms, except for carbon /cyan/).
Fig. 5 Distributions of angles Θ of the intercalated FA (a), U (b) and NMF (c) for the type-1 (1) and type-2 (2) intercalation complexes. Insets: most probable orientation of the guest molecules (the CPK color convention is used for the atoms, except for carbon /cyan/).
Fig. 6 Definition of the orientation of molecules. d is the dipole moment of the molecule, z is the axis normal to the clay surface, and n is a normal vector of the molecular plane (for the molecular plane, generally an O-C-N plane was used).
Fig. 7 Atomic density distributions of the intercalated FA (a), U (b) and NMF (c) for the type-1 intercalation complexes (C: black; O: red; H: blue; r is the same as that in Fig. 4).
Fig. 8 Atomic pair correlation functions between the carbonyl O atoms and the outer hydroxyl H atoms of the octahedral kaolinite sheet (a) and between the guest H atoms and the surface O atoms of the tetrahedral kaolinite sheet (b) for the type-1 intercalation complexes (r is the interatomic distance).
Fig. 9 Average minimum image interaction energies between the guest molecules in the interlayer space and the adjacent kaolinite layer with octahedral (a) and tetrahedral (b) surface contact sheet.
Fig. 10 Sum of the average minimum image interaction energies between guest molecules in the interlayer space and the adjacent kaolinite layers as a function of temperature for the type- 1 intercalation complexes.
Fig. 11 Distributions of mobility of the guest molecules in the interlayer space for the type-1 intercalation complexes at 298 K (a) and 373 K (b) (r is the displacement observed in the time interval of 13 ns). Inset: the whole curves for FA and U at 298 K. Lower panels: simulation snapshots of the typical arrangements of the guest-molecule layers (the CPK color convention is used for the atoms, except for carbon /cyan/).