ISSN 2416-2140 of the European Ecocycles Society
Ecocycles, Ecocycles, Vol. 6, No. 1, pp. 134-145 (2020) DOI: 10.19040/ecocycles.v6i1.167
ORIGINAL PAPER
Evaluation of soil bacteria treatments on some physiological parameters of crops by spectral vegetation indices
R. Láposi
1, L. Bekő
2, T. Kaprinyák
1, S. Molják
3, Sz. Zs. Tóth
11Eszterházy Károly University, Institute of Agricultural Sciences and Environmental Managament, 3200 Gyöngyös, Mátrai u. 36. Hungary, 2University of Debrecen, Remote Sensing Centre, 4032 Debrecen, Böszörményi u. 138.
Hungary, 3Eszterházy Károly University, INNORÉGIÓ Knowledge Centre, 3300 Eger Leányka u. 6-8. Hungary Corresponding author: laposi.reka@.szie.hu
Abstract – The effects of soil bacteria treatments on barley and wheat (1. treatment: stubble decomposers + soil inoculators; 2.
stubble decomposers + soil regenerators; 3. control) were studied at the Agricultural Research Institute in Kompolt on spectral vegetation indices which are closely related to photochemical processes and photosynthetic pigments in barley and wheat leaves.
We applied in vivo field measurements: SPAD 502 relative chlorophyll meter and ASD Field Spec Pro 3 spectroradiometer. This work presents the results of the experiments in 2019, moreover, we compared them with our previously published investigations on several other crops (maize, sunflower, rape, barley) carried out in 2017 and 2018. In 2019 despite the significant level of the standard deviation of data in field conditions, treated (mainly with stubble decomposers + soil inoculators) wheat leaves could be characterized by significantly higher chlorophyll and water content, higher photochemical efficiency, and lower carotenoid content. In the case of barley due to the large standard deviation of data, we couldn’t reveal the beneficial effects of treatments by these methods. Due to the very rainy spring in 2019 some experimental plots - like K9 with barley – were covered by inland water, which negatively influenced living conditions of soil bacteria. Despite this unfavourable conditions, the first treatment resulted in an 18.9% higher yield of barley and 27.8% higher yield of wheat, while the second treatment increased barley yield with 28.9% and wheat yield with 27.7%. In the case of wheat, spectral vegetation indices could indicate beneficial effects of soil bacteria treatments at the beginning of flowering, similarly to our results in 2017 and 2018 in case of maize, sunflower, rape, and barley.
Keywords – spectral vegetation indices, soil bacteria treatments, photosynthetic pigments, barley, wheat Received: April 30, 2020 Accepted: September 23, 2020
1.INTRODUCTION
The Fleischmann Rudolf Research Institute in Kompolt has been engaged in plant breeding and examining, testing, and optimizing various nutrient supply systems in field crops since 1918. The research institute plays an important role in the North Hungarian region as a consultant. Its activity is primarily applied research, and their results - including the development of optimal, environmentally friendly nutrient management - can be adapted for the farmers in the region.
The nutrient supply systems aim at adapting combined technologies, where besides complex fertilizers various soil microbial products also play a significant role.
Soil microbes are known to play an important role in soil organic matter degradation, humus formation, and biogeochemical cycling, and facilitate the formation and
availability of nutrients that can be taken up by plants, thereby improving biomass production and stress tolerance (Kátai 2011). They also have a positive effect on soil life and soil structure. The soil microbe products - we used in our experiments - have been proven on many soil types, in many arable and horticultural crops, and their role in increasing yield and enhancing stress tolerance has been justified (Makádi 2007; Website1). Such preparations have been used in Hungary since the 1960s (Manninger and Szegi 1963).
Today’s preparations contain several components, primarily nitrifying, cellulose-degrading, and solubilizing micro- organisms and biologically available minerals, macro- and micronutrients (Biró 2003).
Since the positive effects of the soil bacteria products do not only manifest themselves in the yield but also in stress
tolerance, therefore we investigated the most critical processes concerning yield and grain quality, photosynthesis during the growing season at the beginning of flowering.
Thus, we used in vivo field measurement techniques that provide the collection of a large amount of data at the plot level, quickly and inexpensively without damaging the plants. For this purpose, leaf reflectance was examined under natural light conditions with a portable field spectroradiometer. From the obtained spectra, we calculated vegetation indices, which are proven to be suitable for the estimation of the leaves’ chlorophyll, carotenoid, anthocyanin and water content, carotenoid/chlorophyll ratio and indirectly their nitrogen content, photochemical efficiency and stress sensitivity of several crops (Merzlyak and Giton 1995; Filella et al. 1995; Moran et al. 2000).
The goal of this study was to analyse the impact of two of the best-known soil bacteria products in Hungary on cereals derived from 2019 experiments with KH Korsó winter barley and Babona (Agromag) winter wheat cultivars. Besides yield values, the effects of combined nutrient supplementation (base fertilizer, top dressing, soil microbe products) were evaluated based on the leaves’ photosynthetic pigment composition, water content, photochemical activity, and stress sensitivity by spectral vegetation indices and SPAD- value before flowering in May 2019. We compared our results with those of the published examinations of other field crops (maize, sunflower, rape, barley) carried out in 2017 and 2018 (Láposi et al. 2018a; 2018b; 2019).
2.MATERIALS AND METHODS 2.1. Study sites
The experimental area is located in Kompolt, on the southern side of the Mátra, between Eger and Gyöngyös. The elevation of the area is 125 meters above sea level. Its weather is moderately warm, prone to drought, and the distribution of precipitation is unpredictable (Holló et al.
2009). The tendency of drought is indicated by the fact that every 5 years the annual precipitation is around 400 mm or less, only a part of which is during the growing season.
Winter is harsh, usually snow-free, and therefore it provides excellent conditions for breeding autumn-sown plant species. The proximity to the North Hungarian Mountains, its rain shadow, and the harsh winter weather are excellent for plant breeding as the varieties produced here are characterized by a high plasticity, adaptation, relative frugality, and abiotic stress resistance (Tóth 2011).
The annual average temperature in 2018 was 12.24 oC; in 2019 it was 11.64 oC, which is higher than what was recorded in the last 70 years (9.98 oC). In 2018, the annual precipitation was 408.65 mm, in 2019 it was 381.64 mm, well below the average of the last 100 years (520.6 mm) (based on Tóth 2011 and our measurements). The annual distribution of precipitation was not favorable for the two investigated plants, since 2-3 months of low rainfall during the time of anthesis and grain filling resulted in the fact that the tested plants did even not reach the usual average yields in Kompolt.
Based on previous soil analysis, it can be said that the soil type is chiefly non-carbonate Chernozem brown forest soil, which was formed on mostly sedimentary, andesitic detritus loess clay. Soil pH is acidic (pH 4.7-5.1), its lime (CaCO3
0%) and humus content are low (2.8-2.9%). The subsoil is harder, less acidic. The lower soil layers have a neutral pH and at depths of 130-150 cm, the soil is alkaline. The humus layer has a thickness of 50-80 cm and the humus content of the plowed layer is 2.5-3.0%. It is characterized by a moderate N-supply based on its humus content and poor P and a satisfactory K-supply based on the P and K content that can be taken up. The soil has unfavorable physical properties. Groundwater levels vary from about 11 m to about 12 m and the amount and distribution of precipitation primarily determine the effectiveness of fertilizer and yield.
The water absorption of the soil is moderate, its water conductivity is poor, it can store and retain large amounts of water, but it is difficult to cultivate. Soil drought is exacerbated by high dead water content and cracking, which results in even greater evaporation of water (Holló and Kádár 2003; Holló al. 2009; Tóth 2011).
2.2. Soil bacteria treatments
We carried out our examination presented in this study in 2019 on two field crops (KH Korsó winter barley, Agromag Babona winter wheat) on two experimental plots (wheat:
Plot K3 – 3.969 ha; barley: Plot K9 – 9.43 ha) treated with Phylazonit stubble decomposer (Website2), soil inoculator (Website3) and soil regenerator (Website4). The preceding crop for winter wheat was winter rape, and for winter barley it was sunflower.
In the case of both plants, three plots were selected on the experimental sites, each of which received basic fertilizer (250kg/ha NPK-10:20:10) 3 weeks before sowing. 15 l/ha stubble decomposer (SD) were placed into plot 1 and plot 2 2 weeks before sowing. The cellulose-degrading bacteria were directly placed on the chopped stem residue, and they were evenly mixed with the stem residues into the soil by the disk as these are the nutrients for the bacteria. Soil inoculator (SI, 15l/ha) was placed into plot 1, and 15l/ha soil regenerator (SR) was placed into plot 2 at the time of sowing (October 2018). The preparations were worked into the soil immediately after placement. The soil inoculator facilitates the rooting of the germinating plant, produces hormones and vitamins, and assists in the nutrient release, nitrogen-fixing (Website 3).
The soil regenerator protects the germinating plant from fungal infections (Alternaria, Fusarium spp.) as microbes can produce antibiotics and some of them very strong competitor of pathogen microbes, moreover this product also enhances nutrient release and stress tolerance of plants (Website4). In February 2019, all three treatments received 27% 150 kg/ha calcium-ammonium-nitrate. Plot 3 (C) received treatment with base fertilizer and top dressing, which is considered to be the control.
135
2.3. Physiological measurements
The effects of soil bacterial treatments were evaluated not only by the average yield and grain quality but also by the photosynthetic pigment composition of the leaves as this is one of the most important parameters for biomass production during the growing season, and we can also get an insight into the plants’ stress sensitivity. The advantage of in vivo field investigation opposite to lab tests is that they allow cheaper, fast, and a large number of measurements in the long run without plant damage. Traditionally leaf extraction with organic solvents and spectrophotometric determination was required for pigment analysis. Recently alternative solutions of leaf pigment analysis with non-destructive optical methods have been developed as near-ground remote sensing with multi- and hyperspectral imaging and the deter- mination of several spectral vegetation indices using them (Gitelson and Merzlyak 2004).
For calculating these spectral vegetation indices, field spectroscopic reflectance measurements were conducted on 80-100 leaves per treatment using an ASD FieldSpec3 portable spectroradiometer from 400 to 2500nm in the middle of May in 2019. Using the values at given wavelengths, we calculated the vegetation indices according
to the formulas presented in Table 1, from which the leaves’
chlorophyll, nitrogen, anthocyanin, carotenoids, water content, stress sensitivity, and photochemical activity can be estimated (Zarco-Tejada et al. 2005). A Spectralon reflectance standard was scanned before every plot measurement and scans were corrected for the instrument’s dark current.
A large amount of data is needed to evaluate the effects of multi-hectare treatments, and it is worth mapping the heterogeneity of the plot, for which drone (UAV-Unmanned Aerial Vehicle) mounted multispectral cameras are excellently suited. From the spectra they measure, some of the spectral vegetation indices also can be calculated (NDVI, RDVI, GNDVI, SAVI). These spectral vegetation indices have been successfully tested in many crops (wheat – Filella et al 1995; Haboudane et al. 2002; maize - Gabriel et al.
2017). We carried out UAV measurements with Parrot Sequoia multispectral camera in case of wheat (K3 plot) on 16/04/2019, while in case of barley (K9 plot) on 8/05/2019.
Detected spectral ranges were: Green 530 – 570 nm; Red 640 – 680 nm; Red EDGE 730 – 740 nm; Near Infrared 770 –810 nm.
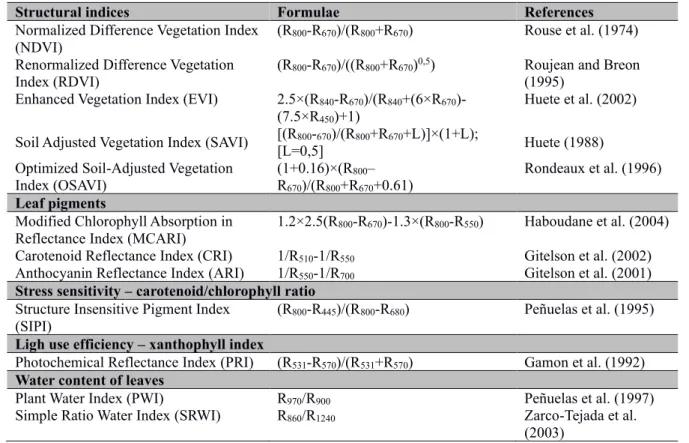
Table 1. Summary of applied vegetation indices and related physiological parameters based on measurements by ASD FieldSpecPro 3 instrument and UAV-based multispectral sensor (References in Zarco-Tejada et al. 2005).
Structural indices Formulae References
Normalized Difference Vegetation Index
(NDVI) (R800-R670)/(R800+R670) Rouse et al. (1974)
Renormalized Difference Vegetation Index (RDVI)
(R800-R670)/((R800+R670)0,5) Roujean and Breon (1995)
Enhanced Vegetation Index (EVI) 2.5×(R840-R670)/(R840+(6×R670)-
(7.5×R450)+1) Huete et al. (2002)
Soil Adjusted Vegetation Index (SAVI) [(R800-670)/(R800+R670+L)]×(1+L);
[L=0,5] Huete (1988)
Optimized Soil-Adjusted Vegetation
Index (OSAVI) (1+0.16)×(R800–
R670)/(R800+R670+0.61) Rondeaux et al. (1996) Leaf pigments
Modified Chlorophyll Absorption in
Reflectance Index (MCARI) 1.2×2.5(R800-R670)-1.3×(R800-R550) Haboudane et al. (2004) Carotenoid Reflectance Index (CRI) 1/R510-1/R550 Gitelson et al. (2002) Anthocyanin Reflectance Index (ARI) 1/R550-1/R700 Gitelson et al. (2001) Stress sensitivity – carotenoid/chlorophyll ratio
Structure Insensitive Pigment Index
(SIPI) (R800-R445)/(R800-R680) Peñuelas et al. (1995)
Ligh use efficiency – xanthophyll index
Photochemical Reflectance Index (PRI) (R531-R570)/(R531+R570) Gamon et al. (1992) Water content of leaves
Plant Water Index (PWI) R970/R900 Peñuelas et al. (1997)
Simple Ratio Water Index (SRWI) R860/R1240 Zarco-Tejada et al.
(2003)
Leaf relative chlorophyll content was measured using a SPAD 502 instrument (KONICA, MINOLTA, JAPAN) at the same time and on the same leaves as in the case of the spectroradiometer. SPAD has a 0.06 cm-2 measurement area
and calculates an index in SPAD-units based on absorbance at 650 nm and 940 nm (Gitelson and Merzlyak 2004).
During harvest (07/17/2020) besides yield we investigated grain quality by FOSS Infratec 1241 Grain Analyzer, which can measure water- and protein content (% of dry weight) of both crops, besides gluten content (% of dry weight), W- value and Zeleny-index (ml) of wheat.
The significant differences between treatments were assessed based on relative chlorophyll content (SPAD- value), vegetation indices, and grain quality by one-way
analysis of variance (ANOVA) and Tukey’s-b test (SPSS 20.0).
In 2018 some parameters of soil quality of these experimental plots were investigated by the Laboratory of Agro- and Environmental Sciences of Eszterházy Károly University. Available P-forms, K- and Ca-content were determined by ammon-lactate extraction, while available N- forms and sulfate by KCl extraction.
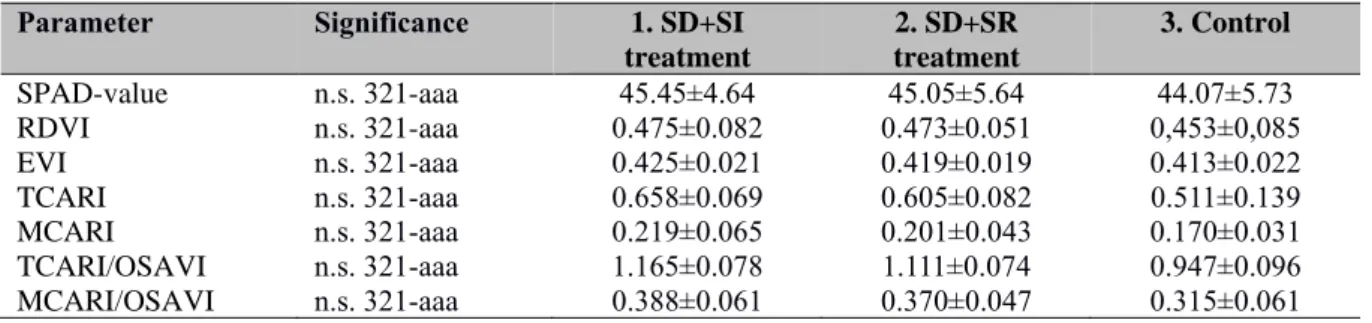
Table 2. Relative chlorophyll content and spectral vegetation indices related to chlorophyll content in the leaves of barley in the middle of May in 2019. (Note: a, b, c index: significance groups by Tukey’s-b test (p<0.05); n.s. – not significant by ANOVA)
Parameter Significance 1. SD+SI
treatment
2. SD+SR treatment
3. Control
SPAD-value n.s. 321-aaa 45.45±4.64 45.05±5.64 44.07±5.73
RDVI n.s. 321-aaa 0.475±0.082 0.473±0.051 0,453±0,085
EVI n.s. 321-aaa 0.425±0.021 0.419±0.019 0.413±0.022
TCARI n.s. 321-aaa 0.658±0.069 0.605±0.082 0.511±0.139
MCARI n.s. 321-aaa 0.219±0.065 0.201±0.043 0.170±0.031
TCARI/OSAVI n.s. 321-aaa 1.165±0.078 1.111±0.074 0.947±0.096
MCARI/OSAVI n.s. 321-aaa 0.388±0.061 0.370±0.047 0.315±0.061
3.RESULTS AND DISCUSSION 3.1. Chlorophyll content of leaves
Chlorophylls, in addition to being the most important pigments in the conversion of light energy into chemical energy, directly determine the biomass production potential
of the plant (Curran et al. 1990), they are indirectly suitable for estimating plant nutrient supply (nitrogen content) (Filella et al 1995; Moran et al. 2000) and are closely related to plant stress and aging (Peñuelas and Filella 1998, Merzyak et al. 1999). Leaf chlorophyll content can be determined by several vegetation indices besides the SPAD value (Zarco and Tejada 2005).
Table 3. Relative chlorophyll content and chlorophyll related spectral vegetation indices in wheat leaves in the middle of May in 2019. (Note: a, b, c index: significance groups by Tukey’s-b test (p<0.05); ANOVA significance: *** - p<0.001, ** - p<0.01,
* - p<0.05)
Parameter Significance 1. SD+SI treatment 2. SD+SR treatment 3. Control
SPAD-value *** 312-a b b 40.75±3.70 42.5±2.65 36.5±5.05
RDVI ** 321-a b b 0.510±0.074 0.493±0.099 0.413±0.101
EVI *** 321-a b b 0.601±0.089 0.587±0.090 0.462±0.172
MCARI1 ***312-a a b 0.160±0.074 0.184±0.056 0.148±0.075
VOG1 *** 312-a b b 1.297±0.044 1.317±0.061 1.257±0.078
NDMI * 321-a ab b 0.217±0.037 0.201±0.038 0.187±0.051
OSAVI * 321-a ab b 0.638±0.086 0.610±0.152 0.541±0.168
REDGE * 123-a ab b -0.038±0.008 -0.034±0.013 -0.031±0.012
In our experiments, the chlorophyll content of both crops characterized by SPAD value showed a high level of standard deviation in the plot-level tests. In case of winter barley, in 2019 no significant difference between the treatments was observed based on the SPAD value, and no significant difference could be detected based on the vegetation indices (RDVI, EVI, TCARI, MCARI, TCARI/OSAVI, MCARI/OSAVI) as well, either although both cases showed the tendency that chlorophyll content was the highest in treatment 1 (SD+SI) (Table 2.). At the time of measurement, autumn barley was already in a very advanced stage of
flowering since very frequent precipitation in spring made it impossible to perform measurements, so the results of the reflectance measurements showed a high level of standard deviation at plot-level. In our previous studies (in 2017), SPAD value was significantly higher in winter barley leaves in case of treatment 1 (SD+SI), which was confirmed by the chlorophyll related vegetation indices (NDVI, RDVI, EVI) (Láposi et al 2019). Measuring time in that year was optimal, so we could confirm the importance of not only weather conditions but also appropriate phenophase of plants during reflectance measurements (Sultana et al 2014).
137
In 2019, both treatments (SD+SI, SD+SR) resulted in a significantly higher SPAD value of winter wheat leaves than in the control. In parallel, of the spectral indices, the RDVI, EVI, MCARI, MCARI2, and VOG1 index showed higher chlorophyll content in both treatments. Based on the NDMI, OSAVI, REDGE indices, chlorophyll content was the highest only in treatment 1 (SD+SI) (Table 3.). NDVI is a very frequently used index for determining biomass production of plants, but in our studies, this index was not usually significant, as presumably not sensitive to the favorable effects of soil bacteria treatment at the beginning of anthesis. Sultana et al (2014) described in their study that there were strong correlations between grain yield and NDVI measured at maturity stage, booting and tillering, but in case of NDVI values recorded at other growth stages of wheat (stem elongation, anthesis, grain filling) correlation with grain yield was not so strong. Several studies indicated that measuring time is very critical in the prediction of yield by spectral vegetation indices because the correlation between final crop production (and yield) and VIs changes through the crop growing season (Doraiswamy et al. 2005; Ren at al.
2008; Huang et al. 2013). Therefore, the seasonal maximum NDVI and EVI were selected as this enabled timely forecasting of crop production around a month and a half before harvest.
In our previous studies (in case of maize in 2017 or rape and sunflower in 2018) the high level of standard deviations in the SPAD values also hid the effect of treatments (Láposi et al. 2018a; 2018b). However, chlorophyll-related spectral vegetation indices were able to indicate significant differences in the leaf chlorophyll content in these plants as well. In the case of rape, the NDVI and VOG1 values were significantly higher only in treatment 2 (SD+SR), whereas the RDVI, EVI, MCARI1, and OSAVI values were significantly higher in case of both treatments than in the control. In the sunflower leaves the VOG1 index was higher in both treatments whereas the NDVI, EVI, MCARI, TCARI, TCARI/OSAVI, and MCARI/OSAVI indices were significantly higher only in treatment 2 compared to the control (Láposi et al. 2018b). In the case of maize NDVI and TCARI/OSAVI indices (the latter of which was described for maize; Haboudane et al. 2002) were significantly higher in treatment 2, whereas the RDVI and EVI indices were significantly higher in both treatments compared to the control. (Láposi et al. 2018a). It is expected that there will be a difference between plant species as to which of the chlorophyll vegetation indices show greater sensitivity to the effects of the treatments, and thus more suitable for detecting significant differences.
High level of standard deviation of data can be demonstrated by UAV-based multispectral imaging, which is very suitable for detecting heterogeneity of plots. Between all the possible existent vegetation indices, the most used ones and derivable from a triband multispectral sensor are NDVI, GNDVI, and SAVI. In our experiments, the SAVI index was the most suitable for the demonstration of differences between plots and heterogeneity of them, more than NDVI and GNDVI.
Values of SAVI in both experiments were the highest in the
case of treatment 1 (SD+SI) and the lowest in control plot (C), but due to the high standard deviation of data, differences were not significant (Figure 1.). The Soil Adjusted Vegetation Index (Huete 1988) is used to eliminate the effect of soil in the vegetation observation for those areas where vegetative cover is poor and the soil surface is exposed. SAVI ranges from −1.0 to 1.0, with low values corresponding to a little amount/cover of green vegetation.
In 2019 rainy springtime resulted in waterlogging within the experimental plots, thus plant cover was not continuous on each experimental plot. Differences between treatments based NDVI and GNDVI indices were not significant as well, but they also could indicate large heterogeneity of plots. The NDVI (Rouse et al. 1973) ranges from −1.0 to 1.0.
Positive values indicate greenness while negative values indicate water, barren areas, ice, snow, or clouds (Pettorelli et al. 2005). The common range for crops is 0.4–0.9 (Weier and Herring 1999). The GNDVI (Gitelson et al. 1996) is related to the proportion of photosynthetically absorbed radiation and is linearly correlated with the Leaf Area Index (LAI) and biomass (Hunt et al. 2008). Thus it is originally more sensitive to the chlorophyll content of leaves than NDVI and ranges from 0 to 1.0 (Candiagi et al. 2015).
3.2. Carotenoids, photochemical activity, water content In addition to chlorophylls, we also investigated spectral vegetation indices, which can reveal the amount and composition of carotenoids, the carotenoid/chlorophyll ratio, photochemical activity, anthocyanin, and water content in leaves. These parameters are suitable for characterizing the physiological state of plants, determining the stress sensitivity of them, moreover these factors also significantly influence plant biomass production.
Several specific physiological functions have been attributed to carotenoids due to their special structural properties (Gitelson and Merzlyak 2004). For example, they have a structural role in the organization of photosynthetic membranes, participation in light-harvesting, energy transfer, quenching of excited states of chlorophylls, singlet oxygen, and other oxygen radicals (Demmig-Adams et al 1996). The changes in leaf carotenoid content and composition, moreover their proportion to chlorophyll are widely used for determining various environmental stresses (Young and Britton 1990). Anthocyanins are water-soluble vacuolar pigments that are responsible for the red coloration of plant tissues (Gitelson and Merzlyak 2004). Significant accumulation of them is induced as a result of high light intensity, UV-B radiation, drought, wounding, bacterial and fungal infections, nitrogen and phosphorus deficiencies, thus they can serve as indicators of environmental stresses and leaf senescence.
In our experiments in 2019, in the case of winter barley, we experienced that the value of the photochemical reflectance index (PRI), plant water content (PWI, SRWI) was the highest in treatment 2, and the SIPI index, the carotenoid (CRI) and anthocyanin content (ARI) were the highest in the control, but the differences between treatments were not significant (Table 4).
Figure 1. Chlorophyll related SAVI index of winter barley and winter wheat on K3 and K9 experimental plots in 2019 determined by UAV-based multispectral imaging.
In 2017 we observed significant effects of soil bacteria treatments on barley leaves. Namely, the photochemical reflectance index (PRI) was higher in treatment 1, the structure insensitive pigment index (SIPI), which is the indicator of stress sensitivity, furthermore the carotenoid/chlorophyll ratio was lower in both treatments than in the control. It can also indicate a state of stress that
the value of vegetation indices for anthocyanin content (ARI) and carotenoid content (CRI) was the highest in the control, but the PWI (plant water index) SRWI (simple ratio water index), the indicators of plant water content were the lowest. In the long run, this can lead to lower plant biomass production.
Table 4. Spectral vegetation indices related to photochemical reflectance (PRI), carotenoid/chlorophyll ratio – stress sensitivity (SIPI), carotenoid content (CRI), anthocyanin content (ARI), water content (PWI, SRWI) in barley leaves in the middle of May in 2019. (Note: a, b, c index: significance groups by Tukey’s-b test (p<0,05); n.s.- not significant by ANOVA)
Parameter Significance 1. SD+SI treatment 2. SD+SR treatment 3. Control
PRI n.s. 312-aaa 0.224±0.050 0.229±0.059 0.207±0.097
SIPI n.s. 213-aaa 0.552±0.080 0.550±0.078 0.559±0.081
CRI n.s. 213-aaa 2.889±0.045 2.517±0.845 2.917±0.651
ARI n.s. 213-aaa 1.796±0.357 1.495±0.606 2.971±1.196
PWI n.s. 132-aaa 0.980±0.028 0.983±0.031 0.981±0.031
SRWI n.s. 132-aaa 0.870±0.035 0.904±0.025 0.901±0.048
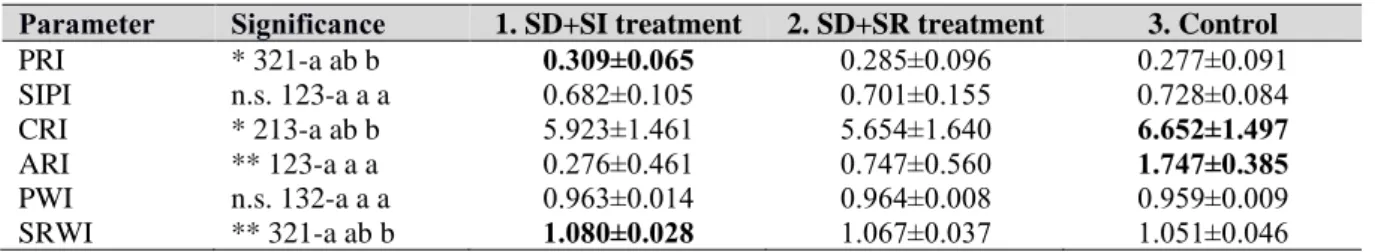
In 2019, in the case of winter wheat photochemical activity (PRI) and water content of leaves (SRWI) were significantly the highest in treatment 1 (SD+SI). The carotenoid (CRI) and anthocyanin contents (ARI) were significantly the highest in the control, like SIPI, but it did not show a significant difference (Table 5). At the time of measurement, the wheat had healthy green leaves and did not show any signs of aging yet, moreover, the carotenoid content was higher, anthocyanin content was lower than in barley leaves.
In our previous studies, we found that the photochemical reflectance index (PRI) was significantly higher for maize in treatment 1 (SD+SI), for rape in both treatments and
sunflowers in treatment 2. The anthocyanin reflectance index (ARI) and carotenoid reflectance index (CRI) in maize and rape were significantly the highest in the control plot, just like the leaf structure-independent pigment index (SIPI), the indicator of the carotenoid/chlorophyll-a ratio. In parallel, PWI and SRWI indexes, the indicators of leaf water content were also significantly lower in the control plot (Láposi et al.
2018a, 2018b). In the case of sunflower, the content of carotenoids and anthocyanins in the leaves was also the highest in the control, but the carotenoid/chlorophyll ratio (SIPI), – although showing the same tendency, – did not differ significantly. Leaf water content (PWI, SRWI) was C
SD+SI SD+SR
C SD+SR
SD+SI
K3 – SAVI [(R800-R680)/(R800+R680+L)]*(1+L); [L=0,5]
Means: C – 0,186 SD+SR – 0,215 SD+SI – 0,262
K9 – SAVI [(R800-R680)/(R800+R680+L)]*(1+L); [L=0,5]
Means: C – 0,215 SD+SR – 0,249 SD+SI – 0,281
1.13 -1.05
0.93 -1.03
139
also higher only in treatment 2 (SD+SR) (Láposi et al.
2018b). Overall, based on the photosynthetic and other protective pigments, the photochemical activity and the water content of the leaves, it can be stated that in case of
barley and wheat treatment 1, in case of maize, sunflower and rape treatment 2 caused more effects compared to the control during the examined years.
Table 5. Spectral vegetation indices related to photochemical reflectance (PRI), carotenoid/chlorophyll ratio–stress sensitivity (SIPI), carotenoid content (CRI), anthocyanin content (ARI), water content (PWI, SRWI) in wheat leaves in the middle of May in 2019. (Note: a, b, c index: significance groups by Tukey’s-b test (p<0,05); ANOVA significances: *** - p<0.001; ** - p<0.01;
* - p<0.05)
Parameter Significance 1. SD+SI treatment 2. SD+SR treatment 3. Control
PRI * 321-a ab b 0.309±0.065 0.285±0.096 0.277±0.091
SIPI n.s. 123-a a a 0.682±0.105 0.701±0.155 0.728±0.084
CRI * 213-a ab b 5.923±1.461 5.654±1.640 6.652±1.497
ARI ** 123-a a a 0.276±0.461 0.747±0.560 1.747±0.385
PWI n.s. 132-a a a 0.963±0.014 0.964±0.008 0.959±0.009
SRWI ** 321-a ab b 1.080±0.028 1.067±0.037 1.051±0.046
Not only the SIPI, which is the indicator of carotenoid/chlorophyll ratio in leaves, but also PRI that is the photochemical reflectance or xanthophyll index can signify the stress-sensitivity of plants (Peñuelas et al. 1995). PRI is closely related to the photochemical activity of leaves, inversely proportional to the amount of photoprotective xanthophylls and the intensity of their membrane protection process, namely the xanthophyll-cycle (Gamon et al. 1997).
Xanthophylls can radiate excess excitation energy from the leaves in the form of heat during the conversion of violaxanthin to zeaxanthin, which can be caused by the high light intensity at noon in the summer, but high heat, drought and increased ultraviolet B radiation can also increase the intensity of the xanthophyll cycle (Demmig-Adams and Adams 1992). The carotenoid/chlorophyll ratio is in many cases more informative than the chlorophyll or carotenoid content alone since the carotenoid content increases, the chlorophyll content decreases under stress, e.g. at a high light intensity, the chlorophyll-a/b ratio also increases as chlorophyll-b is more easily damaged (Tevini et al. 1981).
Thus, the vegetation indices in our previous experiments showed that the individuals of the control plot were in the least optimal condition when they were measured. This is also indicated by the fact that the water content index (PWI) was the lowest in the control. Incidentally, the plant water index was found to be affected not only by water content but also by canopy structure (Serrano et al. 2000). In line with SRWI Zarco-Tejada and Ustin (2001) showed in a simulation study that on leaf-level variables leaf structure and dry matter content can be an influential factor, while on canopy-level LAI can be a modifier. Accordingly, the sensitivity of PWI and SRWI to the changes in leaf water content during stress can be different in the case of crops with various leaf and canopy structures.
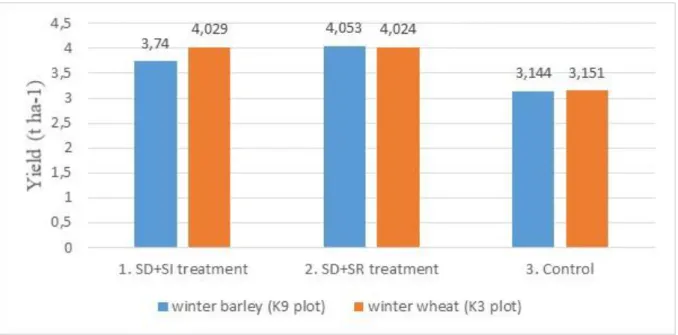
3.3. Yield
Our yield values also confirmed that soil bacterial products can enhance biomass production of crops. In 2019, in case of winter barley, the stubble decomposer+soil inoculant (treatment 1: SD+SI) resulted in a higher yield by 18.9%
(3.74 t ha-1), while the stubble decomposer+soil regenerator (treatment 2: SD+SR) by 28.9% (4,053 t ha-1) compared to the control (3,144 t ha-1). In the case of winter wheat both bacterial products resulted in similar results, the first treatment increased the yield by 27.8% (4,029 t ha-1), and the second treatment by 27.7% (4.024 t ha-1) (Figure 2).
In our previous experiment – in 2017 – the yield of winter barley was by 63% higher (2.9 t ha-1) in treatment 1 whereas it was higher by 98% in treatment 2 (3.6 t ha-1) compared to the control (1.8 t ha-1), which is a huge result since in case of Phylazonit products farmers usually reported a 20-40%
increase in yield in cereals (Website 1). However, this can still be regarded as a very low average yield as the KH Korsó winter barley can also reach a yield average of 6.8 t/ha in Kompolt. On the one hand, low crop yields had agro- technical reasons, and on the other hand, there was very little rainfall in the area between December and the end of April of 2016. In 2017, the yield of maize was only by 13.7%
higher in treatment 1 (5.6 t ha-1) and by 15.9% in treatment 2 (5.7 t ha-1) than in the control plot (4.9 t ha-1). In that year maize was also below the average of 8 t/ha as the rainfall was low at the time of flowering and tasselling, which greatly influences the yield. In 2018, in case of rape, treatment 1 increased yields only by 5.5% (1.38 t ha-1) and treatment 2 by 14.7% (1.50 t ha-1). Rape was also below the yield of 3t/ha, typical of Kompolt as there was very little rainfall in April and May. The control plot had only 1.31 t ha-1 yield that year. In 2018, the yield of sunflower was raised by 18%
by treatment 1(2.33 t ha-1) and by 36% by treatment 2 (2.56 t ha-1) compared to the control (1.89 t ha-1), but it was still below the standard 3.5 t/ha. The reason for this was the drought in August-September, which reduced plant growth.
All in all, the soil bacterial products were able to exert their effects despite the drought, which is due to the proper agrotechnical procedures of placement and work-in of the products and proper soil preparation.
In 2019 we could investigate the grain quality of wheat and barley by Infratec Grain Analyzer, specifically water and protein content of both crops, and besides gluten content, W-
value and Zeleny-index in case of wheat. After the harvest, the protein-, gluten content, and Zeleny-index of wheat were significantly higher in the case of both soil bacteria treatments, besides we measured significantly higher water-
and protein content of barley treated by both soil bacteria products as well, compared to the control (Figure 3.). It means that treatments have positive effects not only on the yield but also the grain quality.
Figure 2. Yield (t ha-1) of winter barley and winter wheat on K3 and K9 experimental plots in 2019 (Data source: Agricultural Research Institute of Kompolt; Harvest time: 17/07/2019).
Figure 3. Quality parameters of winter wheat and winter barley after harvest (17/07/2019). (Note: a, b, c index: significance groups by Tukey’s-b test (p<0,05); ANOVA significances: *** - p<0.001; ** - p<0.01)
141
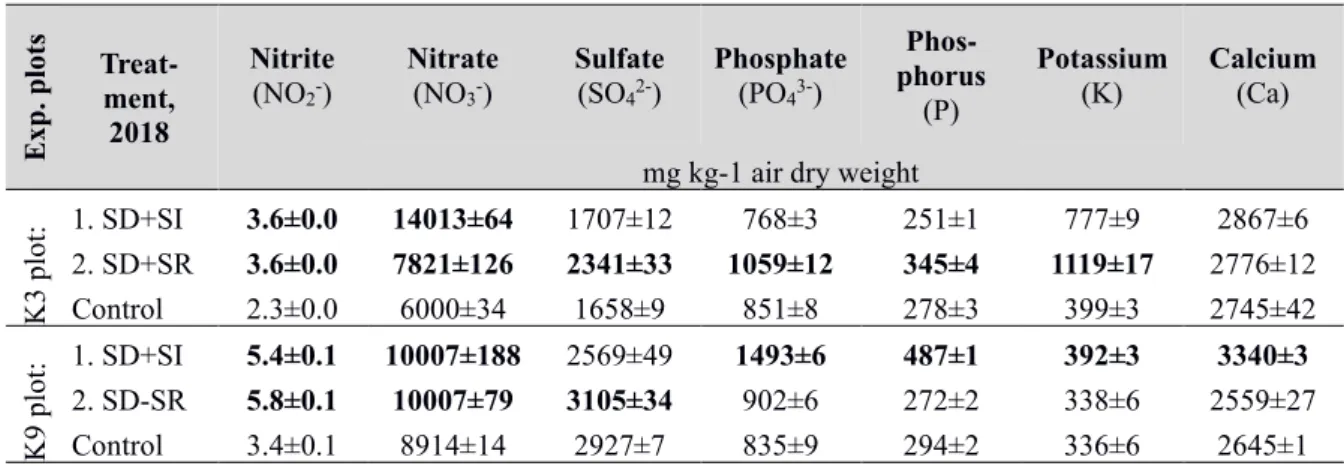
Table 6. Soil parameters of experimental plots (K3 and K9) in Kompolt in 2018. (Data source: Laboratory of Agro- and Environmental Sciences, Eszterházy Károly University)
Exp. plots Treat- ment, 2018
Nitrite
(NO2-) Nitrate
(NO3-) Sulfate
(SO42-) Phosphate (PO43-)
Phos- phorus
(P)
Potassium
(K) Calcium (Ca) mg kg-1 air dry weight
K3 plo
t: 1. SD+SI 3.6±0.0 14013±64 1707±12 768±3 251±1 777±9 2867±6
2. SD+SR 3.6±0.0 7821±126 2341±33 1059±12 345±4 1119±17 2776±12
Control 2.3±0.0 6000±34 1658±9 851±8 278±3 399±3 2745±42
K9 plo
t: 1. SD+SI 5.4±0.1 10007±188 2569±49 1493±6 487±1 392±3 3340±3
2. SD-SR 5.8±0.1 10007±79 3105±34 902±6 272±2 338±6 2559±27
Control 3.4±0.1 8914±14 2927±7 835±9 294±2 336±6 2645±1
The nutrient-mobilization and nitrogen-binding effect of soil bacteria is also apparent in soil test results although a large number of samples are required to determine this. In 2018, the plot K3 had higher nitrate and nitrite content in both treatments whereas the contents of phosphorus, phosphate and potassium were higher only in treatment 2. In the case of plot K9, higher phosphorus, potassium and calcium contents were measured only in treatment 1 (Table 6).
CONCLUSIONS
Under field conditions, it was due not only to soil heterogeneity but also to the differences between individuals that we have to reckon with a significant standard deviation of data compared to controlled laboratory experiments.
Despite the heterogeneity of the plots and the high level of standard deviations, both soil bacterial products resulted in higher yields on both plots compared to the control for each crop. Of the soil bacterial products used, it was primarily the soil decomposer-soil regenerator (SD+SR) that produced the highest average yield in case of winter barley and in earlier years in case of rape, sunflower, and maize. In the case of wheat, there was no difference between the two treatments, both of them produced an increase of about 30%.
Based on the examined physiological parameters, we can state that due to the large deviation we could detect a significant difference among treatments only in winter barley in 2017 based on SPAD values, but based on several spectral vegetation indices we applied, significantly higher chlorophyll content and N content, more active photosynthesis, lower stress sensitivity and, in parallel, lower carotenoid/chlorophyll ratio, and anthocyanin content and higher water content were measured in case of the other examined crops at the beginning of flowering than in control plants, during the three experimental years.
The soil bacteria treatments presumably enhance plant stress tolerance by providing the plants with more balanced nutrition and water supply. This can increase the homogeneity of the plots, which is a very important factor for crop safety.
We plan to further investigate the vegetation indices applicable to certain species in the future by carrying out remote sensing measurements several times during the vegetation period. As the age and the structure of the leaves change, the proportion of sclerenchymatous tissues increases, the water content decreases, and the level of chlorophylls decreases whereas the concentration of carotenoids increases.
These changes can greatly influence the spectral properties.
Vegetation indices determined by UAV-based multispectral imaging can be an important part of precision crop production as it can provide accurate information not only on the condition of plants plant stress sensitivity during the vegetation period but also on soil heterogeneity, relative nutrient deficiency, which are essential for designing modern nutrient supply.
This study demonstrated not only the usefulness of soil treatment with soil bacteria in arable land but, above all, the importance of a healthy soil biota in agro-ecosystems, where soil depletion is well known due to monoculture or monocropping, use of synthetic fertilizers and pesticides, which disrupt or destroy the microbial ecology of soils.
Natural soil development is a long process, which takes several decades while soil depletion caused by intensive monoculture and excessive use of artificial fertilizers and pesticides occurs in much shorter periods of time.
Monocropping alters the microbial landscape of soil, decreasing beneficial microbes and causing poor plant growth. The chemical and biological soil degradation can be prevented by sustainable practices such as crop rotation, use of compost, green manure, irrigation with well-controlled, chemically and biologically purified waste water, use of biosolids, cover cropping and mulching, no-till or low-till techniques, limited to zero pesticide use and sustainable pest management techniques, such as using buffer zones and beneficial insects. Although the here presented soil bacteria cultures cannot be regarded as a magic wand, which renders ecological practices obsolete giving free way to harmful industrial agriculture, they can be very useful for conditioning and regenerative purposes where microbial soil remediation may be required.
ACKNOWLEDGMENTS
This work was supported by EFOP 3-6-1-16-2016-00001 project „Complex improvement of research and service capacity in Eszterházy Károly University”.
REFERENCES
Biró B.: 2003. The role of plant-soil-microbe interactions in nutrient uptake (in Hungarian). In: Mikroelemek a taplaleklancban. (Eds.: Simon L. & Szilágyi M.) Bessenyei György Konyvkiado. Nyiregyhaza. 1-11.
Curran P.J., Dungan J.L., Gholz D.L.: 1990. Exploring the relationship between reflectance red edge and chlorophyll content in slash pine. Tree Physiol. 7: 33-48.
DOI: 10.1093/treephys/7.1-2-3-4.33
Demmig-Adams B., Adams W.W.: 1992. Photoprotection and other responses of plants to high light stress. Ann. Rev. of Plant Phys. and Plants Mol. Biol. Vol 43: 599-626.
DOI: 10.1146/annurev.pp.43.060192.003123
Demmig-Adams B., Gilmore A.M., Adams W.W.: 1996. In vivo functions of carotenoids in higher plants. FASEB J. 10:
403-412.
DOI: 10.1096/fasebj.10.4.8647339
Doraiswamy, P. C., Sinclair, T. R., Hollinger, S., Akhmedov, B., Stern, A., & Prueger, J.: 2005. Application of MODIS derived parameters for regional crop yield assessment.
Remote Sensing of Environment, 97(2), 192-202.
DOI: 10.1016/j.rse.2005.03.015
Filella I., Serrano I., Serra J., Peñuelas J.: 1995. Evaluating wheat nitrogen status with canopy reflectance indices and discriminant analysis. Crop Sci. 35: 1400-1405.
DOI: 10.2135/cropsci1995.0011183X003500050023x Gabriel J.L., Zarco-Tejada P.J., Lopez-Herrera P.J., Perez- Martín E., Alonso-Ayuso M., Quemada M.: 2017. Airborne and ground level sensors for monitoring nitrogen status in a maize crop. Biosystems Engineering 160: 124-133.
DOI: 10.1016/j.biosystemseng.2017.06.003
Gamon J.A., Serrano L., Surfus J.S.: 1997. The photochemical reflectance index: an optical indicator of photosynthetic radiation use efficiency across species, functional types, and nutrient levels. Oecologia 112: 492-499.
DOI: 10.1007/s004420050337
Gitelson, A.A.; Kaufman, Y.J.; Merzlyak, M.N. 1996. Use of a green channel in remote sensing of global vegetation from EOS-MODIS. Remote Sens. Environ. 58, 289–298.
DOI: 10.1016/S0034-4257(96)00072-7
Gitelson A.A., Merzlyak M.N.: 2004. Non-destructive assessment of chlorophyll carotenoid and anthocyanin content in higher plant leaves: principles and algorithms.
Papers in Natural Resources. 263.
http://digitalcommons.unl.edu/natrespapares/263
Haboudane D., Miller J.R., Tremblay N., Zarco-Tejada P.J., Dextraze L.: 2002. Integrated narrow-band vegetation indices for prediction of crop chlorophyll content for application to precision agriculture. Remote Sensing of Environment 81:
416-426.
DOI: 10.1016/S0034-4257(02)00018-4
Holló S., Kádár I.: 2003. Effects of using mineral fertilizers and lime on soil fertility (in Hungarian). In: Blaskó L., Zsigrai Gy. (Eds.), Mutragyazas, talajsavanyodas es meszezes osszefuggesei az OMTK kiserlethalozat talajain (Karcag- Keszthely), Kompolt, pp. 217-224.
Holló S., Pethes J., Ambrus A.: 2009. Effects of permanent use of organic and mineral fertilizers on easily soluble P content of Chernozem brown forest soil in Kompolt (in Hungarian). Tartamkiserletek jelentosege a novenytermesztes fejleszteseben. Jubileumi tudomanyos konferencia.
Martonvasar, 2009.10.15. pp. 227-234.
Huang, J., Wang, X., Li, X., Tian, H., & Pan, Z.: 2013.
Remotely sensed rice yield prediction using multi-temporal NDVI data derived from NOAA's-AVHRR. Plos One, 8(8).
DOI: 10.1371/journal.pone.0070816
Huete, A.R.: 1988. A soil adjusted vegetation index (SAVI).
Remote Sens. Environ. 25, 295–309.
DOI: 10.1016/0034-4257(88)90106-X
Hunt, E.R.J.; Hively, W.D.; Daugtry, C.S.T.; McCarty, G.W.:
2008. Remote sensing of crop leaf area index using unmanned airborne vehicles. In Proceedings of the Pecora 17 Conference, American Society for Photogrammetry and Remote Sensing, Denver, Colorado, 18–20 November 2008.
https://pdfs.semanticscholar.org/3e2c/9f6f570099e5a250d70 45c6a131eab920c2a.pdf?_ga=2.72098131.136779736.1588 531003-1318022898.1585250478
Kátai I.: 2011. Applied Soil Science (in Hungarian).
Debreceni Egyetem, Nyugat-Magyarorszagi Egyetem, Pannon Egyetem.
https://regi.tankonyvtar.hu/hu/tartalom/tamop425/0010_1A_
Book_02_Alkalmazott_talajtan/adatok.html
Láposi R., Kaprinyák T., Bekő L., Tóth Sz.: 2019. Effects of soil bacteria treatments on some physiological parameters of winter barley based on in vivo field measurements (in Hungarian). In: Karsai, Ildiko Ed.) Novenynemesites a 21.
szazad elejen: kihivasok és valaszok: XXV.
Novénynemesitesi Tudomanyos Nap 06/03/2019. Budapest, pp. 376-379.
Láposi R., Kaprinyák T., Bekő L., Tóth Sz.: 2018a.
Investigation of some physiological parameters of maize treated by different soil bacteria products (in Hungarian). In:
Dinya L., Baranyi A. (Eds.) XVI. International Scientific Day, Gyongyos, Hungary, 12-13/04/2018. Líceum Kiadó, pp.
1143-1151. (ISBN:978-615-5621-75-8 online) https://ntn2018.uni-
eszterhazy.hu/files/NTN_2018_tanulmanyok.pdf
143
Láposi R., Kaprinyák T., Bekő L., Tóth Sz. Tury R. Bélteki I.
(2018b): Results of Phylazonit treatments on field crops in Kompolt Research Site (in Hungarian). In: Kovácsné B.E.P.
(Ed.) Agrarinnovaciot segito kutatasok az Eszterhazy Karoly Egyetem Agrartudomanyi és Videkfejlesztesi Karan.
Gyongyos, Karoly Robert Kft., pp. 22-27.
https://uni-eszterhazy.hu/public/uploads/mtu-2018- kiadvany_5c652d4aaec31.pdf
Makádi M., Tomócsik A., Orosz V., Lengyel J., Biró B., Márton Á.: 2007. Effects of biogas ferment juice and Phylazonit MC soil bacteria product on green biomass of silage maize and biological activity of the soil (in Hungarian).
Agrokemia es Talajtan 56: 367-378.
DOI: 10.1556/Agrokem.56.2007.2.12
Manninger E., Szegi J.: 1963. International conference in Leningrad about application of soil bacteria products.
Agrokemia es talajtan. 12: 171-174.
Merzlyak M.N., Gitelson A.A., Chivkunova O.B., Rakitin V.Y.: 1999. Non-destructive optical detection of pigment changes during leaf senescence and fruit ripening. Physiol Plant. 106: 135-141.
DOI: 10.1034/j.1399-3054.1999.106119.x
Moran J.A., Mitchell A.K., Goodmanson G., Stockburger K.A.: 2000. Differentiation among effects of nitrogen fertilization treatments on conifer seedlings by foliar reflectance: a comparison of methods. Tree physiology 20:
1113-1120.
DOI: 10.1093/treephys/20.16.1113
Peñuelas J., Baret F., Filella I.: 1995. Semi-empirical indices to assess carotenoids/chlorophyll a ratio from leaf spectral reflectance. Photosynthetica 31(2): 221-230.
https://www.researchgate.net/publication/229084513 Peñuelas J., Pinol J., Ogaya R., Filella I.: 1997. Estimation of plant water concentration by the reflectance water index (R900/R970). Int. J. Remote Sens.,18, 2869-2875.
DOI: 10.1080/014311697217396
Peñuelas J., Filella I.: 1998. Visible and near-infrared reflectance techniques for diagnosing plant physiological status. Trends Plant Sci 3: 151-156.
DOI: 10.1016/S1360-1385(98)01213-8
Pettorelli N., Vik J.O., Mysterud A., Gaillard J.M., Tucker C.J., Stenseth N.C.: 2005. Using the satellite-derived NDVI to assess ecological responses to environmental change.
Trends Ecol. Evol. 20, 503–510.
DOI: 10.1016/j.tree.2005.05.011
Ren, J. Q., Chen, Z. X., Zhou, Q. B., & Tang, H. J.: 2008.
Regional yield estimation for winter wheat with MODIS- NDVI data in Shandong, China. International Journal of Applied Earth Observation and Geoinformation, 10(4), 403- 413.
DOI: 10.1016/j.jag.2007.11.003
Rouse, J.W.; Haas, R.H.; Schell, J.A.; Deering D.W.: 1973.
Monitoring vegetation systems in the Great Plains with ERTS. In Proceedings of the Third ERTS Symposium, NASA: Washington, DC, USA, 10-14 December 1973;
NASA SP-351; pp. 309–317.
Serrano, L., Ustin, S. L., Roberts, D. A., Gamon, J. A., &
Peñuelas, J.: 2000. Deriving water content of chaparral vegetation from AVIRIS data. Remote Sens. Environ., 74, 570– 581.
DOI: 10.1016/S0034-4257(00)00147-4
Sultana S.R., Ali A., Ahmad A., Mubeen M., Zia-Ul-Haq M., Ahmad S., Ercisli S., Jaafar H.Z.E.: 2014. Normalized Difference Vegetation Index as a Tool for Wheat Yield Faisalabad, Pakistan. Hindawi Publishing Corporation The Scientific World Journal, Volume 2014, Article ID 725326, 8 pages,
DOI: 10.1155/2014/725326
Tevini M., Iwanzik M.W., Thoma U.: 1981. Some effects of enhanced UV-B radiation on the growth and pigment composition of plants. Planta, 153: 388-394.
DOI: 10.1016/S0044-328X(83)80127-5
Tóth N.: 2011. Effects of environmental factors on brewing characteristics of malting barley and malt (In Hungarian).
PhD Thesis, Szent Istvan Egyetem. Godollo
https://szie.hu/file/tti/archivum/Toth_Nikolett_ertekezes.pdf Weier, J., Herring, D.: 2000. Measuring Vegetation (NDVI &
RVI). Available online:
https://earthobservatory.nasa.gov/features/MeasuringVegetat ion (accessed on 26/04/2020).
Young A and Britton G.: 1990. Carotenoids and stress. In Stress Responses in Plants: Adaptation and Acclimation Mechanisms (edited by Alscher R.G. and Cumming J.R.), pp.
87-112. Wiley-Liss, New York
Zarco-Tejada, P. J., & Ustin, S. L.: 2001. Modeling canopy water content for carbon estimates from MODIS data at land EOS validation sites. International Geoscience and Remote Sensing Symposium, 2001. IGARSS ’01, Vol. 1 (pp. 342–
344).
DOI: 10.1109/IGARSS.2001.976152
https://quantalab.ias.csic.es/pdf/carbon_IGARSS_2001.pdf Rueda C., Ustin S.: 2003. Water Content estimation in vegetation with MODIS reflectance data and model inversion methods. Remote Sens. Env., 85(1), 109- 124.
DOI: 10.1016/S0034-4257(02)00197-9
Zarco-Tejada P.J., Ustin S.L., Whitting M.L.: 2005. Temporal and Spatial Relationships between Within-Field Yield Variability in Cotton and High-Spatial Hyperspectral Remote Sensing Imagery. Agronomy Journal, 97(3): 641-653.
DOI: 10.2134/agronj2003.0257
Website references
Website1: https://phylazonit.hu/termeloink-velemenye/
(accessed on 26/04/2020)
Website2: https://phylazonit.hu/termekek/phylazonit- tarlobonto/ (accessed on 26/04/2020)
Website3: https://phylazonit.hu/termekek/phylazonit- talajolto/ (accessed on 26/04/2020)
Website4: https://phylazonit.hu/termekek/phylazonit- talajregeneralo/ (accessed on 26/04/2020)
______________________________________________________________________________________________________
© 2020 by the author(s). This article is an open-access article distributed under the terms and conditions of the Creative Commons Attribution (CC-BY) license (http://creativecommons.org/licenses/by/4.0/).
145