M. B. Robin
Bell Telephone Laboratories, Inc.
Murray Hill, New Jersey
1. The Rare Gases 217 2. Hydrogen 221 3. Carbon Monoxide 232
4. Oxygen 235 5. Nitrogen 242 6. Methane 243 References 247
At the suggestion of the editors, the author has investigated the literature on vibrational and optical, i.e., electronic excitations in simple liquids, looking for spectroscopic information which might be of significance to statistical mechanicians in understanding other physical properties of these systems. While there is no immediately obvious reason for expecting the results of spectroscopic experiments to bear on the problems of statistical mechanics, the fact remains that the literature has not been searched from this point of view and the possi- bility exists therefore that molecular spectroscopy can uncover useful facts about simple fluids. Such a literature search reveals, first, the large amount of experimental spectroscopic work remaining to be done on simple liquids; second, that whereas it is as yet not clear what significance, if any, optical spectroscopy in liquids holds for statistical mechanics, the situation is potentially much brighter in the cases of Raman and infrared spectroscopy; and, third, that in many cases where there is experimental spectroscopic work done on a liquid system, there has not been as yet any theory advanced for the observations, and in one case where there are theoretical predictions, there is no experimental data.
Regarding the use of optical spectra as probes for the study of the structure of liquids, there have been two stumbling blocks, only one
215
216 M. B. ROBIN
of which is experimental. The experimental problems stem first from the fact that the very small particles of interest to the statistical mecha- nician, H2 , CO, CH4 , the rare gases, etc., have excitation frequencies which necessitate the use of vacuum ultraviolet hardware, something which is only very recently available commercially. Though such vacuum ultraviolet spectroscopic equipment is now readily available for studies of liquids, one is still faced with the problems presented by working with thin films of cryogenic fluids in vacuo, problems not encountered when working either with room temperature gases or with gases frozen onto a cold window. Consequently, virtually all of the newer optical work on these small molecules and atoms is being done in either the gas phase or in low temperature matrices. One hopes that as these techniques become more and more routine, experimentalists and then theoreticians will turn to optical spectroscopy in simple cryo- genic liquids as something interesting and unexplored, as indeed it is.
The second factor to be considered is that whereas the statistical mechanician is interested in the properties of a fluid with all particles in their ground state, optical excitation experiments necessarily involve a ground state and an excited state. Because atoms and molecules can be much more reactive in their excited states than in their ground states, the possibility exists then that the actual chemical composition of a simple fluid may change when it bears electronic excitation or, at the very least, that the interatomic or intermolecular forces will be altered drastically at sites of optical excitation. As an example, the picture of the liquefied rare gases as monatomic fluids may not be appropriate when considering their optical luminescence spectra, for in the gas phase, all of these ''noble" gases are known to form dimers through chemical bond formation between one excited atom and one ground state atom.
Indeed, there are experiments which suggest that this is the case in the liquefied rare gases as well.
Unlike the situation in optical spectroscopy, the experimental problems involved in doing vibrational spectroscopy on the small molecule fluids have been solved to a large extent and, theoretically, the excited states encountered in vibrational spectroscopy pose no new and unmanageable problems regarding the intermolecular potential. Consequently, con- siderable work has been reported on the infrared and Raman spectra of the diatomic and polyatomic small molecule fluids, yielding much information on the intramolecular and intermolecular motions of molecules in condensed phases. Unfortunately, though there are a number of interesting effects which have been uncovered in the vibra- tional spectra of simple molecule fluids, there is little agreement as to their explanation.
The substances considered in this study are the rare gases He, Ne, Ar, Kr, and Xe, the first row diatomic molecules H2, N2, 02, and CO, and the polyatomic molecule CH4 . With regard to energy units, the wave number (cm- 1) is used exclusively in the infrared and Raman work, whereas the Angstrom (A), wave number, and electron volt (eV) are used interchangeably in optical spectroscopy. One electron volt equals 8067.5 cm- 1, and the wavelength in A is 108 times the reciprocal of the wave number.
1* The Rare Gases
The first excited state of the neutral helium atom lies 19.8 eV above the ground state. Because of the compounded difficulties of working at such a high excitation energy with a substance having such a low boiling point, it is understandable that the absorption spectrum of the liquid has not yet been measured. A spectroscopy of sorts does exist, however, for liquid helium, springing from the technological discovery that liquid helium scintillates under bombardment with high energy neutrons (20 MeV), electrons (0.5 MeV), and alpha particles (5 MeV).
Protons and deuterons are known to excite scintillation in gaseous helium, but this phenomenon has not yet been reported for liquid helium. The various reports on this phenomenon describe the scintilla- tion radiation as being virtually unattenuated by liquid helium [1-3], as being excited in the liquid and in the saturated vapor above the liquid with approximately the same efficiency [2, 4], as having a wavelength below 1600 A [1,5], and as having a scintillation decay time of 15-25 X 10~9sec [4]. Moss and Hereford [6] have shown that the scintillation intensity in liquid helium falls by about 10% on lowering the temperature below the lambda point. This discontinuity at Τλ was also reported by Kane et al. [7], who studied the liquid helium scintilla- tion stimulated by 5.3 MeV alpha particles and also by 1.06 MeV electrons.
The only work on scintillating liquid helium having a direct spectros- copic orientation is that of Jortner et al. [8], who confirmed the intensity fall off on crossing the lambda point and who also scanned the emitted light in the range of 6000 to 1200 A, finding no measurable intensity in this region. They did find, however, a very strong emission on addition of N2 or 02 to the helium, the emission bands corresponding to well- known luminescences of these substances. Since the particle radiation does not excite these luminescences in the pure N2 or 02 liquids, it appears that the primary step is excitation of helium with subsequent
218 M. B. ROBIN
energy transfer to the 02 or N2. The yield of photons per alpha particle is estimated by Jortner et al. to be about 0 . 1 % in "pure" helium, but rises to approximately 10% on adding N2 or 02. A similar effect has been noted in He-N2 gas phase scintillation experiments [9-11], in which a few parts per million of N2 were sufficient to give easily observable nitrogen luminescences.
The fact that the scintillation pulse height does not change measurably as the liquid helium level falls below the radiation source and the fact that the pulse height increases dramatically on adding nitrogen to both liquid and gaseous helium would appear to open the possibility that the same process is responsible for scintillation in both the gas and liquid phases. However, it is to be noticed that the nitrogen luminescence in liquid helium consists of the Vegard-Kaplan bands of neutral N2, A ZZU+ —> X 12g+
y whereas in gaseous helium it is the first negative system of N2+, B *EU+ —> X 2i ^+, which appears [10, 11]. A complete study of the alpha-excited scintillation of the rare gases is presented by Bennett [11], but it is yet to be determined how much of what transpires in the gas phase is of importance in the liquefied rare gases. Moreover, there is every possibility, vide infra, that the luminescent species in the liquid rare gases is charged, dimeric, or both, thereby necessitating consideration of the electronically unexcited state of the liquid as a pure solvent but the excited liquids as solute-solvent mixtures.
Scintillation experiments have also been carried out in liquid argon [12, 13]. Though the accent was partially on the development of particle detectors and not on the nature of the luminescent light, rather more is known about the scintillation process in liquid argon and the heavier rare gases than is known for liquid helium. As in the case of liquid helium, the scintillation decay time in liquid argon was found to be short (20 X 10~9sec); however, unlike liquid helium, there is a measurable self-absorption of the scintillation radiation in liquid argon [3].
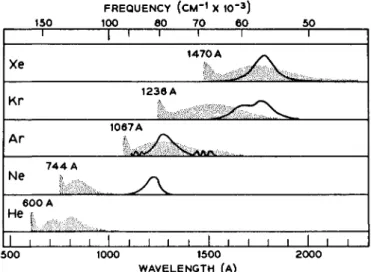
Jortner et al. have scanned the alpha-particle stimulated scintillation spectrum of liquid argon as well as those of liquid neon, krypton, and xenon [13]. Though liquid neon did not give any measurable spectrum, the other liquids gave broad, structureless emissions which were centered near the luminescences which can be excited in these substances by an electrical discharge in the gas phase [14]. Tanaka [14] has assigned these luminescences in the gas phase to bound rare gas dimer molecules in an excited state undergoing radiative transitions to the unbound ground state. The continua observed by Jortner et al. in the liquid phase are centered at 77,220 and 49,380 cm"1 in argon, 56,500 c m- 1 in krypton, and 56,180 cm- 1 in xenon, the widths at half-height being 4000 to 6000 cm- 1. Since the corresponding emission in the excited He2*
molecule falls at about 125,000 c m- 1 [15], it is perhaps understandable why Jortner et al. [8] did not find any luminescence with a spectrometer which scans to only 91,000 cm- 1. The Ne2* luminescence in the gas phase is similarly beyond 91,000 cm- 1. A graphical comparison of the alpha-particle-excited luminescence in the liquefied rare gases and the luminescences excited electrically in the gas phase is presented in Fig. 1.
In this figure, the luminescence drawn in for liquid neon is actually that of the solid, the liquid phase luminescence not having been observed.
It was also found [13] that the addition of N2 or 02 to the liquefied rare gases tended to quench the continuum luminescence. There is
150
FREQUENCY (CM"1 X 10"3)
100 80 70 60 50
I I | 1 1 1 1 1 1
Xe
ΚΓ
ΑΓ
744 A
Ne *
1470 A ^ v I
1236A I
1067A
Λ Λ / Χ Λ Α Λ . 600 A
y\
He f
1 1 1 1 1 1 I 1 1 1 1 1 1 1 1 1 1 1 1 1 500 1000 1500
WAVELENGTH (A)
2000
FIG. 1. The alpha-particle-excited luminescence (—) in the liquified rare gases, and the luminescence (stippled) excited electrically in the gas phase. The full line luminescence shown for neon is that of the solid.
perhaps a connection here with the observation [8] that the addition of 02 or N2 to liquid helium resulted in bright luminescences characteristic of the N2 and 02 molecules, these molecules acting as traps then for the excitation energy and relaxing the excited rare gas dimers to the ground state radiationlessly. In the purified krypton and xenon liquids, the efficiency of conversion of the kinetic energy of the alpha particle to dimer luminescence was judged to be 10 to 100%.
The 500- to 1125-A Hopfield continuum in gaseous helium [16] has been assigned to the spin and symmetry allowed transition XEU+ —> λΣα+ in the He2 molecule. The very short scintillation time measured for liquid helium [4] is in agreement with such an assignment. Tanaka and
220 M. B. ROBIN
Wilkinson [14, 17, 18] propose that the lowest energy continua in gaseous argon, krypton, and xenon are principally of the type 3Σι*+ —* 1Σ^+>
with a minor contribution from 1Σι+ —► χΣϋ+. However, the near equality of the scintillation times in liquid helium and liquid argon suggests that in liquid argon the emission is a spin allowed singlet-to-singlet transition.
Since the binding energy of the excited rare gas dimer ("eximer") as derived from the absorption and luminescence spectra is approxi- mately 25 to 50 kcal/mole, it is clear that if Jortner et al. are actually observing eximer luminescence, the interaction between adjacent atoms in the liquid rare gases is completely altered once electronic excitation energy enters the system. However, it should be pointed out that even though the liquid rare gas scintillation spectra are dominated by eximer luminescence, the absorption spectra of the liquids need not necessarily suffer from dimer complications, since the dimerization to form eximers may follow the absorption act.
An attempt to photographically record the absorption spectrum of liquid xenon has been reported [19], with surprising results. The first electronic transition in the isolated xenon atom falls at 1470 A. Though experiments on this absorption line in the liquid phase did not permit measurement of the entire line profile, the long wavelength onset of absorption of liquid xenon has been measured at various temperatures and pressures. From Table I, one sees that as the pressure on the gas at 285°K is increased from virtually 0 to 50 atm, the long wavelength absorption edge Xred is pressure-broadened from 1470 to 1584 A. The same pressure range can be spanned in the liquid at various temperatures, under which conditions the edge moves from 1783 A (163°K, 0.1 atm) to 2558 A (263°K, 38 atm). Most interestingly, as the temperature of the liquid decreases monotonically and the pressure concomitantly decreases monotonically, the wavelength of the absorption edge first increases and then decreases. The wavelength shifts observed here on going from the gas to the liquid phase at constant pressure are extremely large and have no counterparts in the area of solvent shifts as ordinarily studied. Interestingly, a number of features of the yet-to-be-observed electronic spectrum of liquid xenon already have been predicted by Phillips [20], following his study of the spectra of excitons in thin films of the solid.
The possibility of observing infrared absorption in solutions of the liquified rare gases receives credability from the high pressure gas phase work of Kiss and Welsh [21], in which He-Ne, He-Ar, and Ne-Ar gas mixtures were shown to demonstrate monotonically increasing absorption in the 700- to 300-cm- 1 region. The intensity of absorption is propor- tional to the product of the partial densities of the two gases, the pure
TABLE I
THE LONG WAVELENGTH ABSORPTION EDGE Ared IN GASEOUS AND LIQUID XENON"
Gas, Pressure (atm) 0.0013 0.013 1 10 20 30 40 50
285°K
Ared (A) 1470 1475 1507 1550 1562 1574 1578 1584
Temp. (°K) 283 273 268 263 153
Liquid Pressure (atm)
52 45 42 38
0.105
Ared (A) 2062 2265 2502 2558 1783
β Taken from McLennan and Turnbull [19].
gases taken separately giving no absorption. The absorption is explained as a collision-induced translational absorption in which the absorption of light results in a change of the relative kinetic energy of the colliding particles. Since the collision partners in a homoatomic collision are always related by a center of symmetry, the dipole necessary for the absorption of light cannot develop as it can in a heteroatomic collision, thus accounting for the lack of absorption in the pure gases. Such transi- tions involving excitation of translational modes have been discussed as being responsible for certain lines in the spectrum of liquid and high pressure gaseous hydrogen, and might appear as well in mixtures of the liquefied rare gases.
There is clearly a great deal of optical spectroscopy yet to be done on the liquefied rare gases. Hopefully, more information will come to hand for Rice's Chicago group, and workers in our laboratories are now concentrating on these problems.
2* Hydrogen
Though optical excitation data are nonexistent for liquid hydrogen, the infrared and Raman spectra have been extensively investigated, and they provide one of the best examples of the potential of the spectros- copic method for the elucidation of the motions of diatomic and poly- atomic molecules in the liquid phase. As with all homonuclear diatomic molecules, absorption of the fundamental vibrational frequency is forbidden in the free hydrogen molecule, but it can be induced in
222 M. B. ROBIN
condensed phases as a consequence of the effectively lower symmetry of the molecule in these phases. A similar effect is achieved in the gas phase by operating at high pressures. The induced vibrational spectrum of liquid hydrogen is a rather complex affair whose interpretation is not yet agreed upon by all workers in this field.
The infrared spectrum of normal liquid hydrogen is complicated by the fact that the liquid is actually a mixture, containing 2 5 % para- hydrogen (nuclear moments antiparallel) and 7 5 % orthohydrogen (nuclear moments parallel). As is well known for hydrogen, the differences in nuclear symmetry lead to a rotational ground state having / = 0 for parahydrogen and / = 1 for orthohydrogen. Moreover, because the molecule in a condensed phase is subject to the electric fields of its neighbors, the rotational selection rules for absorption are no longer those usually presumed for absorption, but instead are those appropriate for Raman scattering, i.e., Δ] = 0, ± 2 [22].
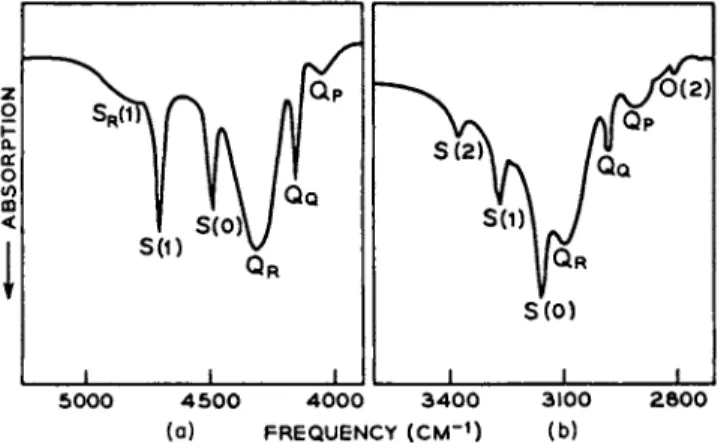
In Fig. 2, the infrared absorption spectrum of normal liquid hydrogen at 17.5°K is presented along with the spectrum of the solid
o.e
0.4
2 o.e
3
0.4h
k
Q Q A
Γ" \
J
1 1 \ ^
\ ♦
NVQR
A
|sR(o) ,
U
-S(O)- >^s IB
SR(D
Λΐ l c
» ( D - N ^
uJ_
D (b)E
IM
01 A 1
4 0 0 0 4 500 5000
FREQUENCY (CM~1)
FIG. 2. The vibrational-rotational-translational spectrum of (a) liquid hydrogen (17.5°K) and (b) solid hydrogen (11.5°K) in the frequency region of 4000 to 5000 cm"1.
at 11.5°K [23]. Interpretation of these spectra is aided immensely by the near coincidence of several of their features with lines of the gas phase Raman spectrum, taken together with due cognizance of the different ground state J's of the ortho- and parahydrogen, and the modified selection rules for condensed phases. The assignments presented below have been summarized by Gush et al. [23] in their discussion of
the infrared spectra of liquid and solid hydrogen. The line QQ in both the liquid and solid phase (Fig. 2) is an unresolved blend of two lines, each component corresponding t o a # = 0 — * ^ = 1 vibrational transi- tion unaccompanied by any change in the rotational quantum number / , one component of QQ being for orthohydrogen and one for parahydrogen.
The intense, broad band QR in the solid is similar to QQ except that the molecular vibration is here accompanied by lattice vibrations, the QR
band shape corresponding to part of the phonon spectrum of the solid.
The appearance of the QR band in the spectrum of the liquid phase as well suggests that in this phase the QR absorption is due to the excitation of the fundamental vibration simultaneous with an increase in the kinetic energy of the exciting molecule relative to its immediate sur- roundings [24]. In the high pressure gas phase at room temperature, a third Q component QP is found corresponding to a decrease of relative kinetic energy on vibrational excitation.
The difference in the rotational states of orthohydrogen and para- hydrogen is distinctly expressed in the S branch (Av = 1, AJ = 2) of the liquid hydrogen spectrum, for the S branch of orthohydrogen, *S(1), has / = 1 —> J = 3 and falls at about 4500 cm- 1, whereas the S branch of parahydrogen, 5(0), has / = 0 -> / = 2 and falls at 4750 cm- 1.*
In the S branch of each of these molecules, there appears a component SR with a band shape much like that of QR . Because of the similarity of band shapes, it is natural to assume that SR(0) and SR{\) correspond to the simultaneous excitation of the fundamental vibration along with an increase of the rotational quantum number by two and an increase in the kinetic energy of the excited molecule relative to its environment. The presence of the S branches in the infrared spectrum of liquid hydrogen at very nearly the gas phase frequencies is clear evidence that the molecules are undergoing free rotation in the liquid phase.
A most curious feature of the S branches are the sharp bands labeled A and B in Fig. 2. It has been shown [25] that the frequencies of these bands are in agreement with those expected if the absorption involved the vibrational excitation of one molecule {Av = 1, AJ = 0) plus the rotational excitation (Av = 0, AJ = 2) of a neighboring molecule in its vibrational ground state. Because the possibility exists that the molecule excited vibrationally in each of the bands A and B is either ortho or para, the A line is an unresolved doublet consisting of the two components Q±(l) + S0(0) and Q^O) + *S0(0), while B is composed of Öi(l) + *S0(1) and Q^O) + S0(l). The subscripts denote the number
* The number in parentheses following the branch letter refers to the rotational quantum number / of the molecule in the lower state involved in the vibrational-rotational transition.
224 M. B. ROBIN
of vibrational quanta in each of the two molecules of interest. The single molecule transitions ^(O) and S^l) are found in the solid as very weak shoulders on the low frequency wings of the double molecule transitions A and B [25], and only ^ ( l ) is distinguishable in the spectrum of the liquid [24]. Three other double molecule transitions, C, D, and Ey have been assigned in the liquid hydrogen spectrum as 5^(0) + *50(0), 5^(0) + *50(1), and S^l) + S0(l), respectively. Each of these transitions involves the excitation of a vibration and a rotation in one molecule and simultaneously a rotation in a neighboring molecule. The double molecule transition expected in the overtone frequency region has been reported for crystalline hydrogen, this region having both the weak v = 0 -> v = 2 single molecule overtone transition and the stronger double molecule transition in which each of two neighboring molecules undergo v = 0 -> v = 1 transitions [25, 26].
The assignments presented above are supported by the fact that all of the lines claimed to involve orthohydrogen are missing in the spectrum of 100% parahydrogen [27] and the fact that the intensity of the double molecule excitations shows a different concentration dependence than do the other bands in dilute solutions of hydrogen in liquid neon [28].
The phenomena of induced infrared absorption, translational spectra, and double molecule transitions, now well documented for liquid hydrogen, all have been observed in the spectrum of compressed hydrogen gas. From the theoretical studies of these effects in the gas phase presented by Van Kranendonk and co-workers [29-33], it is possible to glean several ideas which are appropriate for liquids as well. Thus it was found that in hydrogen the induced intensities of the QR and QP
branches arise from short-range overlap interactions between the absorber and its neighbors, whereas the intensities of the S branches and QQ arise from the interaction of permanent quadrupole moments.
It is also found that in condensed phases there is operative an induced intensity "cancellation effect/' due to the fact that the magnitude of the dipole moment induced in the absorber molecule is lessened by placing more and more nearest neighbor molecules symmetrically about it. Thus for single molecule transitions the induced dipole moment will be largest for binary collisions, smaller for ternary collisions, and smallest for the absorber in a condensed phase. Because the cancellation effect is valid for single molecule absorptions only, this effect is no doubt res- ponsible for the prominence of the induced double molecule transitions as compared to single molecule transitions in the spectra of liquid and solid hydrogen. Reviews concerned with induced infrared absorption in compressed gases have been published by Filimonov [22] and Ketelaar [34].
Figure 2 strikingly demonstrates the close similarity between the infrared spectra of liquid and solid hydrogen, the difference being solely the slightly larger bandwidths observed in the liquid phase. The fact that the QR band has the same shape in the liquid and solid phases suggests that the liquid phase has a local phonon spectrum very much like that of the solid material. It is interesting to note that the total absorption intensity of the liquid and solid phases are very nearly equal and that in solid parahydrogen about 98 % of the absorption intensity stems from double molecule transitions.
The infrared spectra of hydrogen and deuterium as solutes in liquid argon, neon, and carbon tetrachloride have also been reported [23, 35, 35a, 36-38]. According to Ewing and Trajmar [38], the infrared spectrum of two mole percent hydrogen in liquid argon at 87.4°K (Fig. 3) shows
z o
\-\
o </>
m <
Spîïïxpv ΛΙ 1 l|\ M
'
S(0)w so) y
QR
1 1 i l
v \ A|Qp
\t\ 1
S(1)\ / WQR S ( 0 )
l l 1 1
5000 4 5 0 0 4 0 0 0 3 4 0 0 3100 2 8 0 0 (a) FREQUEN CY (CM"1) (b)
FIG. 3. The vibrational-rotational-translational spectra of (a) hydrogen in liquid argon and (b) deuterium in liquid argon, both at 87.4°K.
only those features expected from our discussion of the pure normal hydrogen spectrum. A similar figure has been presented by Vu et al. [36], who determined the spectrum of one percent solution of hydrogen in liquid argon. In liquid argon solution, the familiar bands QQ , S^O), and Srfl) are found at very nearly their gas phase frequencies, whereas the bands QR and SR{\) are shifted by a rather large amount. This is perhaps not unexpected considering that the R branches involve the phonon spectra of the "solvent" molecules or atoms. The intense double molecule transitions found in liquid hydrogen are understandably absent in the dilute solution spectrum, but by virtue of the relatively high temperature, the "hot band" Qp is observed here though it is absent in liquid hydrogen. In solutions of deuterium in liquid argon,
226 M. B. ROBIN
the rotational spacings are smaller and the 0(2) [A] = —2) "hot band"
is also observed. It is clear once again from the spectra that both H2
and D2 undergo free rotation in liquid argon at 87.4°K.
The difference frequencies QR — QQ and QQ — QP are thought to reflect in some undefined way the gain or loss, respectively, of energy associated with the relative motion of the molecules in the liquid when a particular molecule undergoes the v = 0 —>■ v = 1 vibrational excitation. In an attempt to be more explicit about these energies of intermolecular (interatomic) motion, Ewing and Trajmar consider a cell model of the liquid argon with a hydrogen or deuterium molecule bound to the center of a spherical cavity by a potential V = ^kr2, k being a force constant and r the radial coordinate. Solution of the isotropic harmonic oscillator eigenvalue equation gives the energy of the nth quantum state of the molecules taken as points of mass M to be
F
_ (* + t ) / * \
1 / 2lue \M)
Thus, in this model, the separations QR — QQ and QQ — QP should be 1/V2 as large for D2 as H2 . Assuming the experimental hydrogen separation of 158 c m- 1 for QR — QQ and 95 c m- 1 for QQ — QP, the corresponding deuterium frequency differences are predicted to be 112 and 67 cm- 1, comparing nicely with the observed separations of 113 and 69 cm- 1. The difference between QR — QQ and QQ — QP for a given solute in liquid argon is explained as being due to a distribution of cells, each with a different k. Consideration of the selection rules for a diatomic molecule bound to such a quadratic potential shows that the QP and QR lines, having Av = 1 and An = ± 1 , are allowed transitions, as is also the one having An = + 3 .
The isotropic harmonic oscillator model, when used earlier by Volk and Halsey [39] to describe the relative solubilities of hydrogen and deuterium in liquid argon, was found by them to require a value of k= 1.3 X 10³ dyn/cm in order to explain their observations. The value of k = 3.0 X 10³ dyn/cm calculated from the spectroscopic QR ~ QQ separation is in adequate agreement with the thermo- dynamically derived one.
A study of the pressure-induced displacements of the QQ , ^ ( 0 ) , and
JS1(1) vibrational band frequencies of hydrogen in liquid argon at 133°K has been presented by Vu [37]. The frequency shifts were found to be approximately linear with pressure in the density range of 600 to 900 amagats, and the pressure coefficients of the frequency for the QQ , 5^(0), and 6Ί(1) lines are 1.6 X 10"2, 3.2 X 10"2, and 2.2 X 10~2 cm"1/ amagat, respectively.
In a companion study to the one reported above, Ewing and Trajmar [28] have also investigated the infrared spectra of hydrogen and deute- rium as solutes in liquid neon at 27°K. Qualitatively, the spectra are little different than was found in liquid argon except that for a few mole percent of hydrogen in neon, the two components QQ(0) and QQ{\) of QQ are resolved and the double molecule transitions Q^O) + S0(l), 0 i ( l ) + S0(1) and Q^O) + S0(0), Q^l) + S0(0) are observed. Thus the hydrogen and deuterium molecules are also freely rotating in liquid neon.
Again, as in the case of hydrogen and deuterium in liquid argon, the frequency differences QR — QQ for H2 and D2 in liquid neon are in the ratio V 2 , as is also the ratio of the QQ — QP differences. Working on the assumption that the QR — QQ difference represents the quantized oscillations of the diatomic molecules bound to a point by a quadratic potential given by ^kr2f the force constant k for D2 and H2 in neon is derived from the Q differences to be 1.8 X 10³ dyn/cm. The same quantity as determined from the 5-branch differences was found to be 1.2 X 10³ dyn/cm.
Because the Ne — Ne, Ne — H2, and H2 — H2 interaction para- meters are so very nearly equal in the Lennard-Jones and Devonshire (LJD) theory of the intermolecular potential, it was thought that this potential, which is appropriate for pure liquids, would be adequate for H2 — Ne solutions [28]. In Fig. 4, a graphical comparison is made between the spectroscopically determined potential, the Volk-Halsey [39]
potential, and the L J D potential for hydrogen in liquid argon and neon.
It is seen from this figure that for hydrogen in liquid neon, the spectro- scopic and L J D potentials are qualitatively similar but that the L J D curve is noticeably different from the spectroscopic and Volk-Halsey curves for hydrogen in argon. The general success of the Ewing-Trajmar interpretation of the hydrogen and deuterium spectra led them to conclude that the translational motion of these solutes in the liquified rare gases is best regarded as quantized.
Spectra of solutions of H D in argon show additional complications due to the coupling of the rotational and translation motions of the H D molecules in the argon cavities [39a]. This coupling results from the noncoincidence of the center of mass and the center of interaction (midpoint) of the H D molecule and expresses itself spectroscopically as a violation of the usual rotational selection rules, irregular frequency shifts, and broadened absorption bands.
An interesting double molecule transition involving two vibrations has been observed in solutions of hydrogen in carbon tetrachloride.
According to Bulanin and Orlova [35], at room temperature and pressures of 15 to 100 atm of hydrogen, the usual H2 vibrational spec-
2 2 8 M. B. ROBIN
200
100
Γ °
T Σ
^ -100
UJ D
σ UJ
ce IL
-200
-300
-400
1.5 1.0 0.5 0 0.5 1.0 1.5 15 1.0 0.5 0 0.5 1.0 1.5 Γ (A) Γ (A)
(a) (b) FIG. 4. (a) Hydrogen in liquid argon and (b) hydrogen in liquid neon potential functions as derived spectroscopically (—), from solubility data ( ), and from the Lennard-Jones and Devonshire theory ( ).
trum, consisting of Qp , QQ , QR , 5(0), and 5(1) bands, is accompanied in H2-CC14 solution by three transitions with frequencies which corre- spond to the simultaneous excitation of QQ of H2 and the 768-, 797-, and 982-cm- 1 vibrations of CC14 , all of which have symmetry T2. Similar H2-solvent combination bands were subsequently discovered in many other liquid solvent systems [35a]. Bulanin and Orlova also have observed the spectrum of hydrogen in carbon tetrachloride in the hydrogen ^ = 0 —* ^ = 2 overtone region [40] and found the Q2(l)>
S2(0), and S2(l) bands centered approximately 35 c m- 1 below their gas phase frequencies. Unlike the fundamental absorption, the overtone of hydrogen in CC14 solution does not display Qp or QR branches. A value of the force constant k = 4.1 X 10³ dyn/cm can be calculated from the QR ~ QQ split observed in the fundamental band of hydrogen dissolved in carbon tetrachloride.
The vibrational-rotational spectrum of liquid hydrogen is con- siderably simplified when studied as Raman scattering. In the Raman
h
1 1
j 1 n=i 11
\ n=o / /
\J/
1 1 1 1 1
spectrum of normal hydrogen [41-45] only the S0(0) and S0(l) rotational and <2i(l) and 0i(O) vibrational lines appear. According to the most recent Raman data (Table II), the rotational constants B0 , Bx, and D are
TABLE II
THE RAMAN SHIFTS, BAND ORIGINS,
AND ROTATIONAL CONSTANTS FOR GASEOUS, LIQUID, AND SOLID HYDROGEN
5.(0) Sod) 0i(0) Oi(l)
"o
A,
B i £>
Gas (cm-1) 354.1 587.0 4161.3 4155.5 4161.3 59.2 56.3 0.04
Liquid 355.6 588.4 4150.6 4144.4 4150.6 59.6 56.5 0.05
Solid 355.3 588.8 4150.4 4143.8 4150.4 59.5 56.2 0.04
virtually identical in the gas, liquid, and solid phases, whereas the band origin v0 , seems to be shifted by 0.25 % in the condensed phases as compared with the gas [45]. In these spectra, the Q lines have half- widths of 2 c m- 1 or less, whereas the S lines have widths of about
10 cm- 1. The anti-Stokes line / = 2 —> J = 0 has also been observed at —351 c m- 1 in the Raman spectrum of liquid hydrogen [42].
It is interesting to note with regard to the double molecule transitions in liquid hydrogen that spectroscopic [46] and theoretical [47] evidence has been presented for the formation of an (H2)2 double molecule complex having a binding energy of 3.5 cm- 1. The complex is described by Gordon and Cashion [47] as one in which "Each molecule of the pair is rotating freely about its own center of mass, and the pair is orbiting about its own center of mass." Because of the low binding energy, only 0.1 % of the H2 molecules in liquid hydrogen are dimerized at 20°K. A weakly bound Ar-H2 complex also has been discovered spectroscopically in compressed Ar-H2 gas mixtures at 100°K [48], and there is mass spectrometric evidence for the presence of Ar2, X e2, (N2)2, and (02)2 in the low pressure gases [48a].
A photochemical experiment of sorts is described by Akerib et al. [49]
in which the ortho —► para conversion in liquid hydrogen is stimulated by simultaneously irradiating the liquid at a frequency corresponding to the heat released on undergoing the transition (339 cal/mole; 86 μ) and applying an electric field. An appreciable enhancement of the transition rate was achieved in this way.
230 M. B. ROBIN
TABLE
T H E FREQUENCIES AND ASSIGNMENTS OF THE INFRARED
0,(0) 0,(0) + 5„(0) Qp o l d ) QR 5,(0) S,(l) SR(0) SR(1) 0,(1) + S„(0) H2 gas, 3400 atm,
298°K H2/Ar, 87.4°K H2/Ne, 27.2°K H2/CC14, 298°K
15-100 atm H2 , low pressure gas
Solid H2, 1.9°K
H2 liquid
D2, low pressure gas
4050 4054 4107
3950 4161.1 4155.2 4149 4160.2 4154.8
4131
4153.0 4146.5 4144.4°
4150.6 2993.5 2991.4
4360 4307 4280
4315
4223 4500 4489 4499.2
4470 4498.7
4484.5
3166.2 4750 4707 4719.1
4695 4712.7
3278.4
4598
4547
—4856 4823
4770
4507.4
4515.5 4509.6 4503.5 4497
D2/Ne. 27.2°K D2/Ar, 87.4°K HD, gas HD/Ar, 87.4°K
2948 2917
3518 2992.8 2986 3632 3628 3621
3078 3099
3748 3167.3 3160 3888 3886
3278.
3272 4052 4052
-3230 —3340
α Raman spectrum.
III
BANDS OF H2, D2, AND HD IN VARIOUS ENVIRONMENTS
(MO) + S„(l)
( M l ) + S„(l) Sx(0) + S„(0) ^ ( 1 ) + S„(0) 5,(0) + 5„(1) 5Ί(1) + 5„(1) Q2(l) S2(0) S2(l) Ref.
8075 8406 8604 [24,40]
[38]
4746.8 [28]
4748.2 4742.3
8040 8360 8570 [35,40]
[28]
4738
4835 5060 5072 5295 [23]
4732
[45]
[28]
[28]
[38]
[39a]
[39a]
232 M. B. ROBIN
A compilation of the vibrational-rotational-translational frequencies of H2, D2, and HD as pure liquids and as solutes in argon, neon, and carbon tetrachloride is presented in Table III.
3* Carbon Monoxide
Ewing was one of the first to observe and discuss the infrared fun- damental band of liquid carbon monoxide [50] pointing out the rela- tionship between the band shape and rotational motion in the liquid phase. The fundamental band of C1 201 6 falls at 2143.1 c m- 1 in the gas phase and consists of prominent P [Δ] = —1) and R(AJ= + 1 )
i l l l l l l i
1
1
! i
1 1
Q
V
1 1
1 . 1
(o)
1 (b)
1
(0
1 I
2 2 0 0 2100 FREQUENCY (CM"1)
FIG. 5. The v = 0 -> v = 1 transition of CO in the gas phase (a), as a solute in CC14 (b), and as liquid at 80°K (c).
branches only, whereas in pure liquid C1 201 6 there appears at 2139 c m- 1 a strong Q (AJ = 0) branch with relatively weak P and R branches (Fig. 5). Ewing derives in a semiquantitative fashion the rotational selection rules for a hindered rotator-vibrator, and concludes that those molecules with rotational energy sufficiently in excess of the barrier to rotation will show P- and R- branch envelopes similar to the gas phase envelopes, whereas those molecules which perform librational motions because they have rotational energies much below the barrier will have a strong Q branch, weak P and R branches, and very weak O and S branches. This second prediction would seem to be appropriate to a discussion of the spectrum of liquid CO and solutions of CO in carbon tetrachloride. Working on the assumption that the hindering potential V is given by ^V0(l — cos 20), a value of V0 , the barrier height in liquid CO equal to 42 cm- 1, is derived from the rotational-vibrational band shape observed at 80°K. The observed band shape suggests that all molecules with / > 4 (55 % of all molecules in the sample) are freely rotating in the liquid phase at this temperature.
On cooling from 80° to 69°K, the half-width of the fundamental band decreases from 22 to 16 c m- 1 as more and more molecules perform hindered rotation and thereby add intensity to the Q branch but not to P and R. Significantly, there is no abrupt change in band half-width on solidification (14 c m- 1 at 67°K), suggesting to Ewing that the liquid contains clusters of CO molecules with relative geometries much like that found in the ß-CO solid phase.
Dilute solutions of CO in liquid nitrogen and argon have band half- widths of 26 c m- 1 (80°K) and 18 c m- 1 (83°K), respectively, indicating that the barrier to rotation of CO is smaller in liquid nitrogen and larger in liquid argon than in pure liquid CO [50]. The fact that the band half- width in a dilute solution of CO in liquid nitrogen is larger than in pure liquid CO shows that the resonance transfer of vibrational excitation energy is not of any consequence in liquid CO.
Bulanin and Orlova [51] have also studied the spectrum of CO as a solute in carbon tetrachloride at room temperature and in liquid oxygen at 80°K. They find that the CO rotation is partially hindered in carbon tetrachloride, so that clear evidence of P, Q, and R branches is observed and from which a barrier to rotation of 190 to 210 c m- 1 can be derived. However, in liquid oxygen solution, only a Q branch is observed (in agreement with Vu [52]), and the motion is here presumed to be purely librational.
The experiments of Vu et al. [53, 54, 55] extend Ewing's work to the first and second overtone bands of CO in the liquid phase and as a solute in liquid nitrogen and argon. The first overtone in liquid C1 201 6 occurs
234 M. B. ROBIN
at 4252 cm- 1, and the second overtone falls at 6338 cm- 1. These overtone frequencies are just those expected if the anharmonicity term xeœe
remained the same on going from the gas to the liquid and solid phase.
However, because a 50% solution of CO in liquid nitrogen at 77°K does show a double molecule band at 4467.5 cm- 1, wherein one molecule of CO and one of N2 are simultaneously excited vibrationally, it is quite possible that the band assigned by Vu et al. as the first overtone in pure liquid CO is a composite of overtone and double molecule absorptions.
Abramowitz and Broida [56] studied the CO first overtone band shape as a function of temperature in various solvents and feel that the con- clusions of Ewing [50] do not explain the facts. For example, they find the band half-width of the CO first overtone in liquid oxygen solution decreases from 18.4 cm- 1 at 82°K to 10.0 cm- 1 at 57°K, a decrease which is much too large to be accounted for by the change in rotational popula- tions on lowering the temperature. It is perhaps appropriate to mention here that the apparent fusion of the P and R branches to form a strong Q branch, as observed by Ewing in liquid CO and attributed by him to hindered rotation, is also observed in gaseous CO under high pressure [53]. However, Abramowitz and Broida point out that the temperature dependence of the band half-width of CO in liquid oxygen is also not accounted for by the theory of collisional broadening, which predicts a temperature-dependent half-width proportional to T1!2.
The spectrum of CO in the gas phase and as a solute in CC14 at room temperature, published by Lascombe et al. [57] (Fig. 5), shows very nicely the development of the Q branch and the diffuse appearance of the P and R branches on dissolution.
Gordon [58, 59] pointed out that an analysis of absorption band shapes by consideration of the moments of their intensity distribution can lead, in principle, to very useful information. Thus, experimental evaluation of the normalized first moment
M(n = 1) = J (ω — ω0)ηω~1σ(ω) άω \ ω-^ω) άω,
where ω is the angular frequency, ω0 is the band origin, and σ(ω) is the total optical absorption cross section, allows one to find the true frequency of the transition in question, without the usual assumption that it falls at the absorption band maximum. Such an analysis would be of great use in solvent shift studies. The second moment of an absorption band, M(2), is the mean square bandwidth of the transition and is a measure of the upper limit of the average rotational kinetic energy of the molecules. Thus, from the 0—^1 vibrational band shape of CO in N2 [50], Gordon calculates M(2) = 450 cm- 2, which compares well
with the 420 c m- 2 calculated assuming the average rotational kinetic energy of the CO is kT, as given by the equipartition theorem. A measure- ment of the third moment of an absorption band contains information relating to the averages of the first and second angular derivatives of the intermolecular potential energy, and because of this the third moment increases as the rotation becomes hindered. Thus the third moment of the 0 —► 3 overtone band of CO in a low pressure gas approximately doubles on going to the liquid and solid phases, indicating the rotation is highly hindered in these condensed phases. Because the higher moments of an absorption band can be ascertained faithfully only if the band shape and intensity have been corrected for reflection losses, background radiation, interference effects, etc., the possibility of extract- ing information on molecular dynamics in liquids using a moment analysis of the band intensity awaits the more accurate experimental determination of absorption profiles.
4* Oxygen
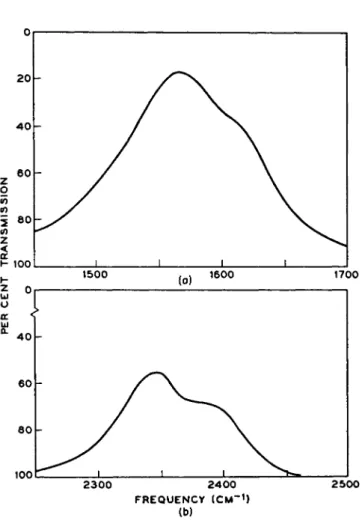
Because the oxygen molecule is centrosymmetric, excitation of the vibrational motion by electric dipole radiation is forbidden. In apparent contradiction to this are the numerous reports [60-65] of a strong band centered at 1556 to 1559 c m- 1 in the infrared absorption spectrum of liquified oxygen (Fig. 6). This frequency correlates well with the ground state vibrational frequency of 1556.4 c m- 1 determined in luminescence studies of oxygen in the gas phase. What is thought to be the overtone absorption is observed in liquid oxygen as a weak band at 3102 c m- 1 [64].
Though the 1559-cm-1 band of oxygen is not observed in the gas phase at atmospheric pressure [66], increase of the pressure induces the fundamental absorption at 1556 c m- 1 with a band profile very much like that observed in the liquid phase. Since the induced intensity in the gas phase depends upon the square of the pressure [62], it is clear that the nonzero absorption in the gas, and almost certainly in the liquid too, is due to the effect of collisional perturbations, and is not due to magnetic dipole or electric quadrupole transitions as earlier conjectured. As we shall see, both the forbidden electronic and vibrational transitions of oxygen seem particularly susceptible to this type of perturbation.
As shown in Fig. 6, the 1559-cm-1 vibrational band of liquid oxygen shows a broad, prominent shoulder centered at 1610 cm- 1. It has been claimed that the double-humped shape of the vibrational-rotational band envelope is in disagreement with that calculated on the assumption that the 02 molecules are freely rotating [64]. This, together with the claim
236 M. B. ROBIN
1700
100 2 3 0 0 2 4 0 0 FREQUENCY (CM*1)
(b)
2 5 0 0
FIG. 6. The fundamental absorption bands of (a) liquid oxygen and (b) liquid nitrogen at 86.2° and 69.0°K, respectively.
that the 1610 cm- 1 absorption intensity falls on diluting the 02 with N2 , has lead to the suggestion that the 1610-cm-1 band is due to the 04
molecule [64]. This is not a new suggestion, Lewis [67] having postulated large amounts (approximately 50%) of diamagnetic 04 in liquid 02 on the basis of the weak paramagnetism of the liquid. Contrary to this, other workers conclude that the calculated 1559 to 1610 cm"1 band shape is in satisfactory agreement with experiment [62], and that since the 1610-cm-1 band is present in dilute solutions of Ö2 in N2 [65] there is no spectroscopic evidence for the presence of 04 in liquid 02 . Thus the infrared spectrum of liquid oxygen is as yet still rather muddled by conflicting experimental results and conclusions.
It is interesting to note that the infrared spectrum of the high tem- perature phase of solid oxygen, y - 02 , is virtually identical with that of liquid oxygen [63, 64].
The Raman spectrum of liquid oxygen has also been extensively studied, with even less agreement as to the results than in the case of the infrared spectrum. Unlike the infrared absorption, the Raman scattering is allowed and results in a sharp, prominent line displaced by
1557 cm- 1 from the exciting line. This spectrum, first reported by McLennan and McLeod [41, 44, 60], is characterized by the presence of wings on the Rayleigh scattered line as well as on the Raman scattered line. Whereas all investigators up to the present acknowledge these wings as being about 100 cm- 1 wide and as being due to rotational transitions in the oxygen molecule, there is no agreement as to the detailed intensity distribution within the wings.
In the work of Crawford et al. [68], the wings on the exciting line and the 1557-cm_1 scattered line were found to be approximately 100 cm- 1 wide, with an intensity which decreased monotonically on moving outward from the centers of the lines without any sign of substructure.
The wings of both the scattered and Rayleigh lines are superposable and are claimed to have an intensity distribution in agreement with the theoretical one presuming free rotation of the oxygen molecules. Con- trary to the structureless band envelope found by Crawford et al.9
Saha [69] claims that the wing of the rotational Raman spectrum of liquid oxygen shows a maximum at 50 cm- 1, Kastha [70] claims a maxi- mum at 40 cm- 1, and Sirkar et al. [71] find inflections at 38, 49, and 60 cm- 1. The gas phase rotational lines occur at 37.36, 48.88, and 60.20 cm- 1. Sirkar and co-workers concluded that the scattered intensity observed by them in the 0 to 14-cm-1 region is too low in frequency to be due to rotation of 02 and is therefore due to motions of 04 .
StoichefF [72] has observed the stimulated Raman spectrum of liquid oxygen using a giant pulse ruby laser, and though he reports the 1552-cm-1 line as being very sharp, he does not comment on the wings.
Unlike the other substances considered here, oxygen is an open shell molecule and consequently has electronic transitions at relatively low energies. According to Herzberg's compilation [73], the first four excited states above the 32^~ ground state are xAg (infrared atmospheric bands, v00 = 7882.39 cm"1) λΣα+ (atmospheric bands, vm = 13,120.91 cm"1),
ΖΣΗ+ (Herzberg bands, v00 = 35,713 cm- 1), and ZEU~ (Schumann-Runge bands, *>00 = 49,363.1 cm- 1). Absorption from the ground state to all four of the above electronic excited states has been measured in liquid oxygen with results in some cases, which are genuinely surprising.
Bass and Broida [74] have observed the Schumann-Runge bands of
238 M. B. ROBIN
oxygen in the 1750 to 2000-A region using oxygen as a solute (0.01-3 %) in both liquid nitrogen and liquid argon. They report that the vibronic bands in these solutions are broad, structureless, and shaded to the violet, whereas the bands of the vapor are shaded to the red and are shifted 50 to 400 cm-1 to higher frequencies with respect to the bands of the liquid. The shift between gas and liquid absorption frequencies in the Schumann-Runge bands (Table IV) is seen to be more than an
T A B L E IV
FREQUENCIES OF THE SCHUMANN-RUNGE BANDS OF OXYGEN IN LIQUID AND SOLID ARGON AND NITROGEN
Liquid Solid Gasa
50,712.5 51,353.2 51,969.6 52,562.4 53,123.7 53,659.6 54,159.4 54,623.9 55,054.0 55,441.6 55,788.0 56,088.4
Liquid argonb
50,960.6 51,581.0 52,170.3 52,748.2 53,302.1 53,803.9 54,303.6 54,770.5 55,187.6 55,567.9 55,928.4
Solid argonc
50,911.3 51,565.0 52,148.5 52,764.9 53,299.2 53,824.2 54,362.6 54,836.6 55,300.6 55,663.8 56,044.4
nitrogen
50,982.2 51,642.2 52,241.1 52,784.4 53,347.6 53,888.0 54,371.4 54,815.5 55,245.6 55,632.8 55,966.0
nitrogen
50,971.0 51,602.2 52,211.1 52,806.7 53,333.3
° Band head frequencies (cm- 1) of the vibronic lines (0, 2) to (0,13).
6 85°K.
c 76°K.
order of magnitude smaller than the shifts observed in the electronic spectra of gaseous and liquid xenon (Table I). As Table IV indicates, changes in the frequencies of the vibronic components of the Schumann- Runge transition are quite small on going from the liquid phase to solid y-oxygen, just as was found in the infrared spectra of these phases [63, 64].
The vibrational spacings within the Schumann-Runge bands of oxygen in liquid nitrogen and argon differ from the gas phase spacings (Table IV) due to the O-N and O-Ar intermolecular potentials. If a parametrized intermolecular potential function is added to the experi- mentally determined gas phase intramolecular potential function, then the fitting of the vibrational spacings observed in solution leads to