PROCEEDINGS OF THE 26th International Symposium
on Analytical and Environmental Problems
Szeged, Hungary November 23-24, 2020
University of Szeged
Edited by:
Tünde Alapi Robert Berkecz
István Ilisz
Publisher:
University of Szeged, H-6720 Szeged, Dugonics ter 13, Hungary
ISBN 978-963-306-771-0
2020.
Szeged, Hungary
EVAPORATION FROM CARBON NANOTUBE BUCKYPAPERS WITH DIFFERENT FUNCTIONALIZATION: ANALYTICAL POSSIBILITIES OF THE
MASS MEASUREMENTS I. Y. Toth1, J. Papp1 and A. Kukovecz1
departm ent o f Applied and Environmental Chemistry, University o f Szeged, Interdisciplinary Excellence Centre, H-6720, Szeged, Rerrich Bela ter 1, Hungary
e-mail: kolozska@citromail.hu (J.P.); ildiko.toth@chem.u-szeged.hu (I.Y.T.) Abstract
The evaporation o f liquids from porous films is a very complex phenomenon, which can be followed by simultaneous weight monitoring, electric resistance measurement, infrared imaging and contact angel measurement. The appropriate evaluation o f these measurement results can carry both quantitative and qualitative analytical information. The aim o f our recent work is to demonstrate this opportunity through the example o f the evaporation o f simple solvents from porous buckypapers prepared from carbon nanotubes with different functionalization. In this work the focus will be on the analytical possibilities o f the mass measurements.
Introduction
Recent developments in nanotechnology have highlighted the importance o f the classical topics of wetting, droplet spreading and evaporation due to their pronounced effect in technological applications (e.g., air/fuel premixing, micro-fluidics, oil recovery, etc.) [1,2]. Multiple phenomena take place simultaneously when a liquid droplet contacts a porous surface: wetting, spreading, capillary filling, gravity induced convective flow, adsorption, evaporation from the surface, evaporation from the pores, etc. The evaporation of a sessile droplet can be studied by several experimental methods: transmission electron microscopy, environmental scanning electron microscopy, contact angle measurement, high speed camera recordings, thermal imaging, just to name a few. The evaporation o f sessile droplets can be followed by an equipment assembled at the Department o f Applied and Environmental Chemistry, University o f Szeged: this equipment can guide simultaneous weight monitoring, electric resistance measurement and infrared imaging at a controlled temperature (typically at 50 °C). There Eire several experimental results characteristic for the evaporation process, the most important ones being the total evaporation time, time of evaporation only from the surface, full width at half maximum of the time-dependent mass and resistance curves, evaporation rate, initial area of the droplet, and the wetted area at the moment o f total evaporation from the surface, etc. [3-6].
The main goal of this work was to demonstrate the analytical possibilities of the mass measurements through the example of sessile droplet evaporation (water and ethanol) from porous buckypapers (BP) prepared from pristine non-functionalized carbon nanotubes (nf- CNT), from ■ COOH functionalized CNT (f-CNT) and from their mixtures.
Experimental
Materials: The multiwall carbon nanotubes were synthesized by 2 h o f catalytic chemical vapor deposition from a C2H4:N2 (30:300 cm3/min) gas mixture at 650 °C over Fe,Co/Al2O3 catalyst (metal loading: 2.5-2.5 m/m%). The synthesized materials were purified by repeating 4 h of refluxing in 10 mol/dm3 aqueous NaOH, then 4 h in cc. HCl solution four times. Some pristine non-functionalized carbon nanotubes (nf-CNT) were subjected to oxidative chemical functionalization (8 h reflux o f 4 g CNT in 500 cm3 cc. HNO3 solution) to facilitate surface carboxyl group formation and improve their hydrophilicity to get so called functionalized
carbon nanotubes /-C N T ). The typical length o f CNTs was over 10 pm and their outer diameter fell in the 15-25 nm range as determined from TEM image analysis. CNTs were converted into buckypaper (BP) by filtering 70 cm3 o f their 0.1 g/dm3 suspensions through a 0.45 pm nominal pore diameter Whatmann nylon membrane filter. The n/-CNTs and /-C N T s were suspended by 40 min ultrasonication in N,N-dimethylformamide and water, respectively [3,4]. The functionality (ration o f the /-C N T ) o f the BP samples were 0.00; 0.25; 0.50; 0.75 and 1.00, prepared by the filtration o f the n/-CNT’s and/-C N T ’s physical mixtures.
Methods:
Electrophoretic mobilities o f the CNTs were measured in a Nano ZS (Malvern) apparatus with a 4 mW H e-N e laser source ( / = 633 nm) using disposable zeta cells (DTS 1070) at 25±0.1
°C. The zeta-standard o f M alvern (-55±5 mV) was used for calibration and the samples were diluted to give an optimal intensity. To get comparable data, the dispersions were homogenized in an ultrasonic bath for 10 s, after which 2 min relaxation was allowed. The influence o f the functionality and the effect o f pH variation were studied at 10 mM NaCl. The Smoluchowski equation was applied to convert electrophoretic mobilities to electrokinetic potential values.
The accuracy o f the measurements was ±5 mV.
Liquid droplet evaporation (distilled water and ethanol) was studied from the buckypaper films. The droplets (5 pL, 25 °C) were instilled with an Eppendorf Xplorer electronic pipette on the surface o f the porous films. The temperature, the electric resistance and weight variations could be simultaneously monitored by the equipment assembled at the Department o f Applied and Environmental Chemistry, University o f Szeged.
Buckypaper was placed onto a purpose-built sample holder and kept in place by a top piece that had a 1.4 cm diameter circular opening in it for placing the liquid droplet. The setup included a type K thermocouple in contact with the non-wetted part o f the BP. The distance between the porous film and the heater was 1 cm. Data from the thermocouple was fed back to the temperature controller that maintained a base BP temperature o f 25 ± 0.5 °C by continuously adjusting the heater power using fuzzy logic control.
The sample holder was placed on a Sartorius Cubis microbalance with 0.01 mg readability and the weigh variation during droplet evaporation was recorded.
For thermal imaging a FLIR A655sc infrared (IR) camera was used. This unit has a thermal sensitivity o f 30 mK, an accuracy o f ±2 °C for temperatures up to 650 °C at 640x480 resolution.
Its uncooled microbolometer detector has a spectral range o f 7.5-14.0 pm. The IR camera is equipped with a 2.9x (50 pm) IR close-up lens, with 32x24 mm field o f view and 50 pm spatial resolution. The recorded images are transferred to a PC with FLIR ResearchIR Max software.
Sessile droplet evaporation movies were acquired at maximum resolution with 50 Hz frame rate. Each CNT film's emissivity (sfilm) was determined by calibration at the initial film temperature (25 °C) with a black electrical tape (s = 0.95). During liquid surface evaporation the temperature was determined by taking into account the emissivity o f the liquid (el= 0.95);
after surface evaporation, the emissivity o f the wetted film was calculated as the average between the emissivities o f the studied liquid and the porous film.
The sample holder plastic plate with the 0.7 cm radius gap in the center was equipped with two copper electrical connections at the opposite edges o f the gap on the bottom o f the sheet. The BP was fixed to the bottom o f the plastic section with magnetic clips. The copper electrodes were contacted to the source meter by 0.3 mm diameter copper wires. The rigidity o f these wires did not affect the balance because o f the large inertia o f the whole assembly mounted on the balance plate. This was confirmed by independent experiments before the evaporation profile (electrical resistance variation as a function o f time) measurements. The computer recorded the electrical resistance o f the buckypaper as measured by a Keithley 2612A Source Meter.
Before the measurements, the BP film was mounted in the assembly and heating at initial temperature was applied until the electrical resistance and the sample weight both stabilized.
Then all three recordings (resistivity, IR imaging and sample weight) were started a few seconds before dropping. The evaporation was studied by dropping a single droplet o f a selected solvent to the center o f the BP film and simultaneously recording the IR video, the mass and electrical resistance until they returned to their original values.
The schematics o f the equipment is presented in Fig. 1. The ambient air temperature and the relative humidity o f the ambient atmosphere were kept constant (at 25 °C and 55 RH%, respectively) [3-6]. In our experiments the electric resistance and weight variations were simultaneously monitored, but in this work we will focus only on the results o f the mass measurements.
- Temperature variation, -Shape of drop - Shape of
wetted region
- Resistance measurement
- Weight monitoring
Figure 1. Evaporation monitoring equipment schematic.
Results and discussion
The zeta potentials o f different CNTs are plotted as a function o f pH in Fig. 2. The isoelectric point (IEP, at which the net charge o f CNT is zero) shifts gradually to more acidic pH with the increasing functionality. The values o f zeta potential shift to more negative region with the increasing pH and/or with the increasing amount o f -CO O H .
Figure 2. Functionality and pH dependent zeta potential o f CNT samples (10 mM NaCl, 25°C).
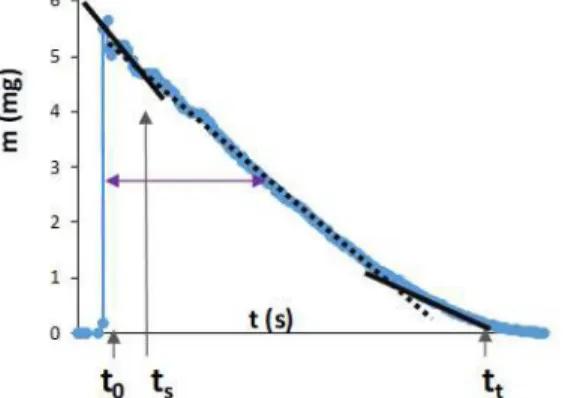
In general at the moment we drop the liquid on the buckypaper film (ta), the liquid starts to diffuse immediately into the pores o f the BP, but a part o f it remains spread on the surface of the film. The evaporation o f this liquid from the surface takes place together with the diffusion.
Once all liquid evaporates from the surface, namely the primary surface evaporation is complete (ts), liquid is left only in the pores. The solvent gradually evaporates from the pores as well. The
complete evaporation o f the solvent (tt) was confirmed by the fact that the mass o f the buckypaper returned to the baseline.
One typical mass variation is illustrated in Fig. 3. where t0 marks the time when the drop was instilled. The mass o f the BP increased as soon as the solvent was dropped to the film and this is followed by a quasi-linear weight decrease. Once the primary surface evaporation is complete (ts), the mass o f the buckypaper decreases as linear (within experimental error) functions of time due to the continuous evaporation o f the solvent. The total evaporation time (tt) was at the moment when the mass o f the BP returned to the baseline. At the linear weight decreasing ranges, the rate o f evaporation (-dm/dt) is constant. The change o f -dm/dt value suggests the change o f the dominant evaporation process, e.g., evaporation o f the droplet sitting on the surface of the BP, evaporation of the condensed water from the porous system or the evaporation o f the adsorbed water from the microscopical surface o f the porous system (see the linear ranges in Fig. 3.). From this type o f measurement, the typical experimentally determined data are the shape o f the curve: mmax, area, FWHM; the ts and tt, the evaporation rate -dm/dt and its change. These data are characteristic for the measured system and can be used to identify them [3-6].
Figure 3. Illustration: weight variation o f a buckypaper as a functions o f time during the evaporation process.
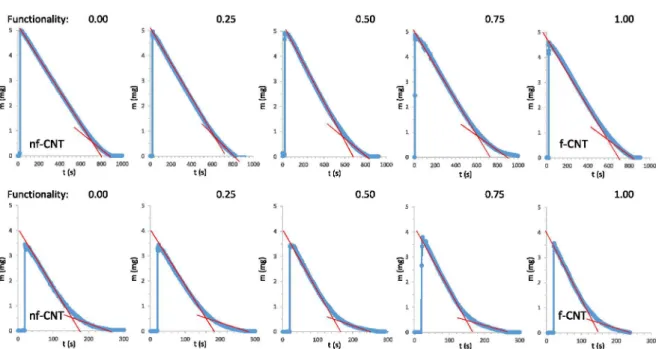
The evaporation o f water and ethanol from the surface o f CNT buckypapers with different functionality can be seen in Fig. 4. It is clear that ethanol evaporates faster than water in case o f all solid materials. Based on the detailed analysis the tt, the area, the FWHM, the evaporation rate for the condensed water in the porous system and for the adsorbed water can be determined.
Conclusion
The weight monitoring of the evaporation of liquids from porous films can provide information about the mechanism o f wetting and vaporization which is a significant area o f the basic researches. Furthermore, it can be proved by using appropriate statistical methods (e.g., matrix o f Pearson correlation coefficients, hierarchical cluster analysis, functional analysis, etc.), that the experimentally determined characteristic values are specific for the physical properties of the solvents, and they are also dependent on the quality of the solid materials, therefore, they can be used for qualitative chemical and quantitative analysis via the estimation of physical properties. The results allow us to presume the possibility o f this experimental setup and theoretical approach for a potential future application in the field o f analytics.
Functionality: 0.00 0.25 0.50 0.75 1.00
Figure 4. Evaporation o f water (1st row) and ethanol (2nd row) from CNT buckypapers with different functionality (5 pL, 25°C).
Acknowledgements
W e thank Krisztina Nagy for the technical contribution during the measurements. Financial support from the Hungarian National Research, Development and Innovation Office through the GINOP-2.3.2-15-2016-
syntheses to applications” project is acknowledged. I.Y. Toth also acknowledge the support by the János Bolyai Research Scholarship o f the Hungarian Academy o f Sciences and the Ministry o f Human Capacities, Hungary through the grant ÚNKP-19-4 New National Excellence Program.
References
[1] D. Bonn, J. Eggers, J
[2] H.Y. Erbil, Adv. Colloid Interface Sci. 170(1-
[3] G. Schuszter, E.S. Bogya, D. Horváth, Á. Tóth, H. Haspel, Á. Kukovecz, Mic. Mes. Mat.
209 (2015) 105 112.
[4] E.S. Bo 35.
[5] Á. Kukovecz, Egydimenziós nanoszerkezetek és hálózataik létrehozása, módosítása és néhány felhasználási lehetősége, M TA értekezés, Szeged, 2018
[6] I.Y. Tóth, L. Janovák, E.S. Bogya, Á. Deák, I. Dékány, A. Rawal, Á. Kukovecz, J. Mól.
Liquids 305 (2020) 112826