Kiss Gábor Ferenc – Stukovszky Tamás 1
EXPERIENCES OF THE HUNGARIAN EU FUNDING IN THE 2014-2020 BUDGETARY PERIOD
The aim of the paper is to analyse the implementation of Hungarian EU funding in the most recent budgetary period which ended in 2020. The research examines the intervention fields aimed by the operational programmes and the statistics of grant applications as well. In addition, the study gives a detailed analysis about the economic development programme compared to the one in the previous financial cycle. Overall, the aim is to seek the funding practice in Hungary regarding to the sectoral priorities and the characteristic of regional allocation.
1. RESEARCH DESIGN
Following its accession to the European Union in 2004, Hungary had completed its second full budgetary period by the end of 2020. Although the fund usage can be justified to the European Commission in line with the special "n+3"
rule until 2023, the Hungarian budget had been almost fully allocated by the first half of 2021. Therefore, a review of the practical experiences related to EU funding seems to be relevant at this stage.
The aim of the present study is to explore the financing practices of Hungary in the period 2014-2020. The research questions are focused on whether the evidence-based fund allocation corresponds well to the budget plans or what kind of differences are appreciable by comparing the EU funds usage in the last two financial periods.
The paper aims to examine the phenomenon of Hungarian fund allocation trends by the intervention fields and regionality issues. The analysis includes a comparison with the results of the previous cycle as well as a detailed analysis of the resources used under the Economic Development and Innovation Operational Programme (GINOP). The research is based on the publicly available programming documents and datasets of the Hungarian government and the European Commission. The applied methodology is descriptive statistical analysis.
1 DOI: 10.14267/RETP2021.04.09
134 KÖZ-GAZDASÁG 2021/4 2. INTRODUCTION
As one of the main beneficiaries of the European Union's cohesion policy, Hungary had significant subsidies at its disposal in the 2014-2020 budgetary period. According to the European Commission’s dataset2 [EC, 2021], Hungary, with its budget of 29,76 billion euros, has been ranked ninth among all the Member States. However, based on the amount of EU funding per capita, Hungary is at the direct forefront of the Member States together with the Baltic States and Slovakia.
The financial sources of the cohesion policy come from the European Structural and Investment Funds (ESI Funds), which include the following instruments during the period under review.
the European Regional Development Fund (ERDF), which supports the balanced development of the various regions in the EU;
the European Social Fund (ESF), which supports investment in human resources;
the Cohesion Fund (CA), which finances large-scale transport and environmental development;
the European Agricultural Fund for Rural Development (EAFRD), which contributes to tackling the challenges of rural areas;
and the European Maritime and Fisheries Fund (EMFF), which supports the fisheries sector.
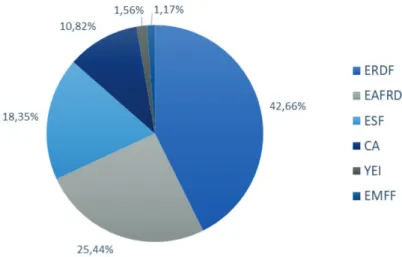
In addition to the existing sources, the European Commission has set up a special funding instrument, aimed primarily at addressing the challenges of the economic crisis that broke out in 2009 and led to significant youth unemployment in many Member States. Therefore, the Youth Employment Initiative (YEI) aims to support young people and in particular facilitates improving their position in the labour market. The distribution of resources between the ESIF and YEI is described in Figure 1. The source map does not contain the financial allocation of the pre accession financial instrument (Instruments for Pre-Accession Assistance, IPA) which is only available for candidate countries like Serbia or Bosnia- Herzegovina, but of course has had significant importance for them in preparing for future accessions between 2014 and 2020 as well. [Endrődi-Kovács, 2012]
2 cohesiondata.ec.europa.eu DOI: 10.14267/RETP2021.04.09
TANULMÁNYOK 135
Source: own editing based on cohesiondata.ec.europa.eu
1. Figure - Distribution of cohesion policy resources during the budgetary period In line with the funding through these sources, Member States shall apply the provisions of Regulation (EU) No 1303/2013 of the European Parliament and of the Council (General Regulation). The General Regulation contains all the common rules related the funding, e.g. the principles of grants, the rules, provisions and the strategic approach of programming or the methods of implementation. The specific rules of each fund are set out in the fund-specific regulations. In order to contribute to the provisions of EU Treaties and the Europe 2020 Strategy, the European Commission defined eleven thematic objectives which could be supported by the ESI Funds during the 2014-2020 budgetary period.
(1) strengthening research, technological development and innovation;
(2) enhancing access to, and use and quality of ICT;
(3) enhancing the competitiveness of SMEs, the agricultural sector and of the fishery and aquaculture sector;
(4) supporting the shift towards a low-carbon economy in all sectors;
(5) promoting climate change adaptation, risk prevention and management;
(6) preserving and protecting the environment and promoting resource efficiency;
(7) promoting sustainable transport and removing bottlenecks in key network infrastructures;
(8) promoting sustainable and quality employment and supporting labour mobility;
(9) promoting social inclusion, combating poverty and any discrimination;
136 KÖZ-GAZDASÁG 2021/4
(10) investing in education, training and vocational training for skills and lifelong learning;
(11) enhancing institutional capacity of public authorities and stakeholders and efficient public administration.3 [EU, 2013]
In order for a Member State to be able to manage its financial budget allocated by the Commission ("Member State envelope"), a bilateral partnership agreement should be put in place based on the partnership and programming principles. The purpose of this strategic planning document is to demonstrate the coherence of the Member State's development plan with the EU's strategic objectives by identifying development needs and growth potential, summarising key achievements, allocating resources indicatively and applying horizontal and policy objectives. In addition, the document needs to delineate the measures applied to ensure the effective implementation of funding. The partnership agreement also sets out the sectoral (economic development, transport, administration, etc.) and regional operational programmes with their indicative financial plans.
The Hungarian Partnership Agreement, also known as the Széchenyi 2020 Programme, has defined the following operational programmes in the examined budgetary cycle.
the Human Resources Development Operational Programme (EFOP), which aims to strengthen the social cooperation and increase knowledge capital;
the Economic Development and Innovation Operational Programme (GINOP), which aims to promote the development of small and medium- sized enterprises (SMEs), research and development, innovation,
information and communication developments and labour market interventions;
the Integrated Transport Operational Programme (IKOP), which aims to develop the Hungarian sections of the Trans-European Transport Network (TEN-T);
the Environmental and Energy Efficiency Operational Programme (KEHOP), which supports the adaptation to climate change, water, waste and energy management and nature protection;
the Operational Programme for the Support of the Most Deprived Persons (RSZTOP);
the Territorial and Settlement Development Operational Programme (TOP), which supports local-scale (county, district, city) development investments;
3 REGULATION (EU) No 1303/2013, Title II., Chapter I., Article 9.
TANULMÁNYOK 137
the Competitive Central-Hungary Operational Programme (VEKOP), which finances investments in the capital region;
the Rural Development Program (VP), which supports agricultural and rural investments;
the Public Administration and Civil Service Development Operational Programme (KÖFOP), which aims to increase the efficiency of public administration and optimise local public services;
and the Hungarian Fisheries Management Operational Programme (MAHOP), which aims at the development of the Hungarian fisheries sector and freshwater resources.
Regarding the indicative resource allocation plans within the OPs (Figure 2.), most of the resources have been intended to finance GINOP (29.53%), TOP (13.29%) and VP (13.11%) investments, meanwhile other programmes have received significantly smaller funding (e.g. KÖFOP or VEKOP) or have received only a minimum proportion from the total budget (e.g. MAHOP or RSZTOP).
Source: own editing based on palyazat.gov.hu
2. Figure - Distribution of indicative financial resources of Széchenyi 2020 operational programmes
In the Partnership Agreement [ME, 2014], the Hungarian Government has also stated that it intends to devote about 60% of the ESI Funds resources to direct economic development. It means that between 2014 and 2020, a significant part of the Hungarian cohesion budget was intended to be used to finance direct economic development projects implemented by economic actors.
Whereas there is a widespread literature about the possible barriers of efficient funding for the SME sector, for example the lack of awareness, when the smallest
138 KÖZ-GAZDASÁG 2021/4
SMEs do not have the desirable knowledge about the support measures. [Nagy, 2013] Meanwhile the Commission has continuously urged to maintain a broad base of small and medium-sized enterprises (SMEs) with sufficient and aligned EU and national funding thus their importance in economic development, wealth and sustainability. [EC, 2016; 2020]
In addition, the Partnership Agreement has set out the following five main national development priorities in relation to the overall national development goal of promoting the economic growth based on sustainable, high value-added production and employment growth.
1. Improving the competitiveness of economic actors and increasing their international role;
2. Increasing employment (through the economic development,
employment, education and social inclusion policies in light of territorial differences);
3. Increasing energy and resource efficiency;
4. Addressing the challenges of social inclusion and population;
5. Implementing local and regional developments that promote economic growth.
During the budgetary period under examination – following the closure of the National Development Agency – an integrated and centralised institutional system structure is responsible for the planning, implementation and monitoring of the partnership agreement and the operational programmes. The coordinating managing authority tasks were initially performed by the Prime Minister's Office, then in 2018 the responsibility was moved to the Ministry of Innovation and Technology, and finally in 2021, it returned under the competence of the Prime Minister's Office again. In addition, the competent ministries also act as the managing authorities and the intermediate bodies of each sectoral and territorial operational programme; however, the Hungarian State Treasury (TOP), the National Research, Development and Innovation Office (research and development interventions of GINOP) and the Hungarian Development Bank Zrt.
(repayable financing of GINOP) also has some competences. At the same time, the Hungarian State Treasury, as the certifying authority, also performs accounting tasks towards the European Commission.
In line with the presented priorities, the study aims to synthetise the data and characteristics related to the allocation of resources of each operational programme, covering the announced programmes, the main beneficiaries, as well as the volume and territorial characteristics of the budget allocations.
TANULMÁNYOK 139 3. FUND USAGE IN THE PERIOD 2014-2020
The datasets of EU funding are publicly available through the government's central information webpage4. [ME, 2021] Within the „Results" and „Current Statistics” sub-pages of the website, the data on the use of resources in the periods 2007-2013 and 2014-2020 are also available, either by sectoral (operational programme) or by regional (regions) breakdowns. These facilitate a comparative analysis of the allocation practices of each cycle. Based on this information, we have arrived at the following results in our research.
3.1. The basic characteristics of grant applications
Since 2014, in order to comply with the e-cohesion directive, which is intended to reduce the administrative burden, it has been possible to submit grant applications almost entirely through an electronic, online form. Paper-based administration – with the exception of forced postal submissions due to possible technical errors e.g. – may only be required to submit an applicant's declaration in order to authenticate the grant application, if the applicant does not have a qualified electronic signature.
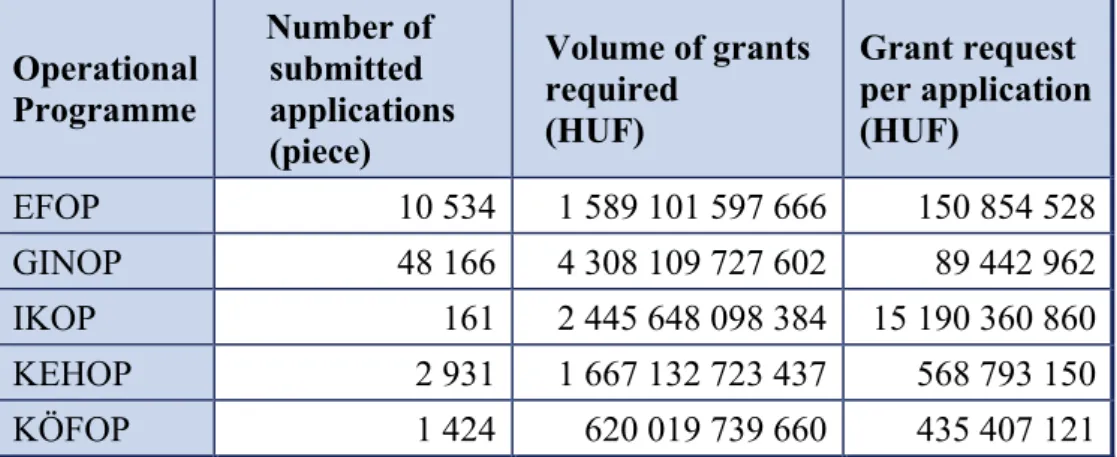
The applicants have the opportunity to submit grant applications through the Electronic Applicant Information and Communication System (EPTK). Based on the information in the public databases, the following applications had been received under each operational programme by 22 of July 2021.
1. Table – The number, the resource requirement and the average size of applications submitted within the framework of Széchenyi 2020 operational
programmes
Operational Programme
Number of submitted applications (piece)
Volume of grants required
(HUF)
Grant request per application (HUF)
EFOP 10 534 1 589 101 597 666 150 854 528 GINOP 48 166 4 308 109 727 602 89 442 962 IKOP 161 2 445 648 098 384 15 190 360 860 KEHOP 2 931 1 667 132 723 437 568 793 150
KÖFOP 1 424 620 019 739 660 435 407 121
4 www.palyazat.gov.hu
140 KÖZ-GAZDASÁG 2021/4
MAHOP 348 35 665 721 749 102 487 706
RSZTOP 10 41 115 145 668 4 111 514 567
TOP 14 248 2 290 322 794 627 160 746 968
VEKOP 4 706 391 121 070 031 83 111 150
VP 185 434 2 675 171 079 555 14 426 540
Total 267 962 16 063 407 698 379 59 946 588
Source: own calculation based on palyazat.gov.hu (22/07/2021)
While the largest number of applications (185.434 individual requests, which is 69,20% of the total number of submitted applications) were submitted by applicants under the Rural Development Programme (VP), the highest volume of the requested resources (4.308 billion HUF, which is 26,82% of the total requested grants) was in the economic development programme (GINOP). The former can be explained by the fact that some of the calls of the VP were available to all farmers, regardless of the form of operation, in addition within a simplified regime, i.e. with easier conditions of participation. On the other hand, the programme also allowed young farmers to submit small-scale (less than 40.000 EUR) flat-rate applications, which also resulted in a large number of requests. At the same time, the outstanding demand of the applications received for economic development investments was in line with the government's previously discussed intention to devote the vast majority of the cohesion resources to direct economic development.
In addition to the above-mentioned aspects, the transport development programmes for large-scale infrastructure investments and the national-scale projects of the RSZTOP implemented in flagship project regime to help those in need have relatively high resource estimates. In contrast, development needs with smaller average project size – for the reasons detailed above – emerged mainly in the framework of the rural development programme.
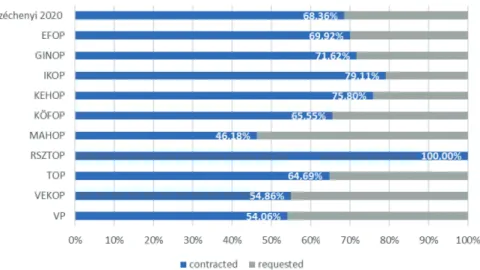
Compared to the submitted applications, the proportion of awarded grants differs from one operational programme to another. While in the case of RSZTOP, which generates a small number of projects due to the flagship project regime, all submitted applications received support to the extent of their total funding needs, in the case of some operational programmes (e.g. EFOP for human development, KEHOP for encouraging environmental and energy investment or GINOP for supporting SMEs) only every second grant requests was able to receive funding. In terms of the grants awarded ratio, the picture is somewhat more favourable in the case of economic development programme, as more than 70% of the funds were
TANULMÁNYOK 141 allocated compared to the requests made. In contrast, in the case of VEKOP, which supports the developments of Central Hungary, not only the number of supported projects, but also the proportion of awarded grants remained below 60%. This is due to the increased willingness to submit applications among the potential beneficiaries in the region, and, to a larger extent, also due to the lack of resources by the level of development of Central Hungary compared to the less developed regions.
2. Table – Subsidies granted under Széchenyi 2020 in proportion of the submitted applications
Operational programme Number of supported applications (piece) In proportion of submitted applications Amount of subsidies granted (HUF) In proportion of requested grants (%) Grants per supported project (HUF)
EFOP 5 584 53,01% 1 152 349 421 376 72,52% 206 366 300 GINOP 28 465 59,10% 3 151 991 453 498 73,16% 110 732 178 IKOP 127 78,88% 1 947 622 229 650 79,64% 15 335 608 107 KEHOP 1 573 53,67% 1 277 824 790 610 76,65% 812 348 882 KÖFOP 1 313 92,21% 434 090 017 233 70,01% 330 609 305 MAHOP 215 61,78% 17 276 569 570 48,44% 80 356 138 RSZTOP 10 100,00% 41 115 145 668 100,00% 4 111 514 567 TOP 10 061 70,61% 1 594 567 687 315 69,62% 158 489 980 VEKOP 2 845 60,45% 229 730 111 157 58,74% 80 748 721 VP 128 869 69,50% 1 563 583 780 074 58,45% 12 133 126 Total 179 062 66,82% 11 410 151 206 151 71,03% 63 721 790 Source: own calculation based on palyazat.gov.hu (22/07/2021)
142 KÖZ-GAZDASÁG 2021/4
Based on the aggregated data of Széchenyi 2020, it can be stated that 66,82% of the submitted applications received funding with an amount of 71,03% of the total funding requests. This shows a more favourable picture compared to the previous cycle between 2007 and 2013, when the ratio was below 60% both in terms of the number of supported applications and the volume of resources awarded. Although both the number of submitted applications and the amount of resource requirements were higher in the previous cycle – we do not take into account the data of VP in favour of comparability, as rural development investments were managed as part of a separate strategic programme (New Hungary Rural Development Programme) before 2014.
Source: own calculation based on palyazat.gov.hu (22/07/2021)
3. Figure – Contracted grants in proportion of the requested amount by operational programmes
In terms of financial progress three operational programmes (KÖFOP, RSZTOP, TOP) have resource allocation over the awarded grant amount, which can be done with an individual approval of the managing authority. The almost full payment of the available funding is also noticeable in the infrastructure development programme (IKOP), but this is mainly due to the opportunity for state actors to take advantage of a 100% advance payment. However, the average rate of payments in the OPs is around 85%, leaving only a significantly lower lever of payments in the fisheries and rural development programmes.
TANULMÁNYOK 143 3. Table - Payments and the financial progress of Széchenyi 2020 by operational
programmes Operational
programme Total payments (HUF)
In proportion of contracted amount (%)
Payment per project (HUF)
EFOP 939 163 436 785 84,52% 164 881 221
GINOP 2 527 791 619 176 81,92% 98 684 037
IKOP 1 898 828 808 536 98,14% 15 070 069 909
KEHOP 1 153 245 418 617 91,26% 743 070 502
KÖFOP 454 252 494 143 111,76% 349 424 995
MAHOP 10 110 506 693 61,38% 53 494 744
RSZTOP 48 824 660 396 118,75% 4 882 466 040
TOP 1 472 836 859 382 99,41% 158 967 821
VEKOP 182 795 872 959 85,19% 70 144 234
VP 651 531 262 003 45,05% 5 612 488
Total 9 339 380 938 690 84,89% 57 492 572
Source: own calculation based on palyazat.gov.hu (22/07/2021)
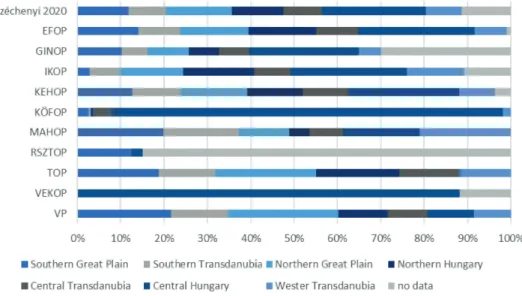
Regarding to the territorial distribution of the applications, based on the location of implementation the most applications (67.588 requests) were submitted from the Northern Great Plain region, however, the applicants have had the greatest resource demands (3.541,5 billion HUF) in Central Hungary. Both regions are also at the frontline in terms of the awarded grants, as the number of supported projects is the highest in the Northern Great Plain, while the amount of the awarded resources is the highest in Central Hungary.
Among the implemented projects, the developments within the dedicated programme of the central region (VEKOP) are in its entirety (100%) related to Central Hungary, as the territorial scope of the operational programme covered only this region. In addition, a decisive part (over 90%) of the funds spent to KÖFOP developments could be used in the central region as well, which is due to the fact that the beneficiaries of the state and administrative developments
144 KÖZ-GAZDASÁG 2021/4
typically operate in the Central Hungary region, even more in the capital. For a similar reason, RSZTOP funds were also received by beneficiaries based in the central region; however, as the implemented projects had a national scope, with one or two exceptions the exact location of implementation could not be defined.
In addition, it is worth mentioning that Central Hungary was able to receive the largest share of the funds within almost all operational programmes at nominal amount. The exceptions are the regional development programme (TOP), which has focused on the development of less developed regions, and the Rural Development Programme (VP), which aims to invest mainly in rural areas.
However, in the case of the latter, some settlements of Pest County were also able to receive funding, which has resulted in that Central Hungary received more funding in total from the VP, compared to less development regions such as Central or Western Transdanubia.
Source: own editing based on palyazat.gov.hu (22/07/2021)
4. Figure - Regional distribution of contracted grants by operational programmes
Examining the funding practices of the less developed regions in terms of the locations of implementation, it can be stated that the highest proportion of the funds in Southern Great Plain and Central Transdanubia has been used for funding GINOP economic developments, in Northern Hungary and Western Transdanubia for transport development IKOP investments, in Northern Great
TANULMÁNYOK 145 Plain for rural development VP projects and in Northern Great Plain for regional development TOP applications.
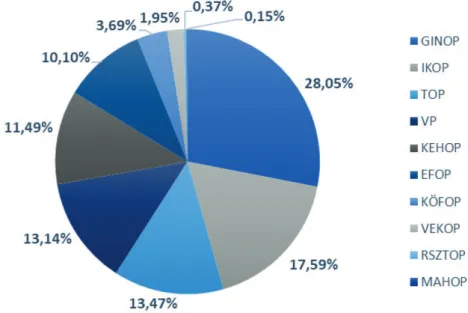
Overall, the following proportions (Figure 5.) can be observed between the operational programmes based on the funding volume of subsidy contracts in force. The operational programmes with the three largest contract portfolios are the GINOP, the IKOP and the TOP with an amount of almost 60% of the total contracted funding envelope altogether. In contrast, only one tenth of the total allocated resources has been used for human development (EFOP), the share of VEKOP supporting local-scale investments in Central Hungary though does not reach two percent of the total. This is in an interesting parallel to the previously presented tendency: according to the volume of grant allocation from all operational programmes to the projects of the central region amounts for nearly a quarter of the total resource allocation. As a result, the importance of the regional programme for the implemented developments in the central region seems to be only a fraction compared to the sectoral programmes.
Source: own editing based on palyazat.gov.hu (22/07/2021)
5. Figure - Distribution of the total value of contracts among the operational programmes
Although the share of the KÖFOP programme aimed to the development of public administration reach only 3.69% of the total allocation, it is worth examining the intervention field from the point of view of the funding in the
146 KÖZ-GAZDASÁG 2021/4
previous cycle. At that time, between 2007 and 2013, two (plus one) operational programmes were aimed to finance the state and administrative developments.
On the one hand, the e-government operational programme (EKOP) supported the renewal of the internal processes of public administration and public administration services, as well as the developments supporting access to such services. In addition, the aim of the State Reform Operational Program (ÁROP) was to upgrade the administrative processes and develop organisational and human resources. In addition, the previous partnership agreement also included the Implementation Operational Program (VOP) which aimed to finance the creation and the operation of the institutional system managing the European Union grants. Within the framework of these operational programmes, a total of 326,46 billion HUF was distributed, which resulted in a 3,35 percent share of the total volume of fund allocation. This means that between 2014 and 2020, the state and public administration developments financed from the Public Administration Development Operational Program both increased in absolute terms and in terms of share compared to the previous cycle.
An opposite trend can be observed in the case of the human development programmes (EFOP and RSZTOP). While in the budgetary cycle between 2014 and 2020 the share of these operational programmes is 10.47% within the total allocation, in the previous period the implementation of two relating operational programmes – the Social Renewal Operational Program supporting soft type interventions and the Social Infrastructure Operational Program supporting related infrastructure investments – had a proportion of 19.76% within the total allocation. Thus, in contrast to the administrative programmes, the use of resources in the field of human development has decreased by almost half compared to the previous period.
In summary, the following differences can be observed in the allocation of resources in the two examined periods. Compared to the previous cycle, the allocation of resources in the field of economic development increased significantly between 2014 and 2020, and growth can be also observed in the field of public administration development. There is no significant difference in the ratio of funding rural development and fisheries, although the allocation of resources in the period 2007-2013 is based only on estimates due to the lack of structured data. At the same time, between 2014 and 2020, compared to the previous cycle, the resources allocated under regional programmes decreased moderately, while a significant decrease can be observed in the field of environment, energy or human resource development and especially in the field of infrastructure investments.
TANULMÁNYOK 147 4. Table - Amount and distribution of subsidies granted by policy field in the
budgetary periods
Policy
2007-2013 2014-2020
Relevant OP Contracted grants (HUF) Proportion (%) Relevant OP Contracted grants (HUF) Proportion (%)
Economic
development GOP 1.046,71
bn 10,73
(9,3) GINOP 3.085,57 bn 28,05 Public
administration development
ÁROP, EKOP,
VOP 326,46 bn 3,35
(2,9) KÖFOP 406,45 bn 3,69 Human
resources development
TÁMOP,
TIOP 1.927,15 bn 19,76
(17,12) EFOP,
RSZTOP 1.152,29 bn 10,47 Transport
infrastructure KÖZOP 2.905,85
bn 29,79
(25,82) IKOP 1.934,77 bn 17,59 Environmental
protection,
energy KEOP 1.687,51 bn 17,30
(14,99) KEHOP 1.263,66 bn 11,49
Regional programmes
DAOP, DDOP, KDOP, NYDOP, ÉAOP, ÉMOP, KMOP
1.860,52
bn 19,07
(16,53) TOP,
VEKOP 1.696,10 bn 15,42
Rural
development,
fishery ÚMVP* 1.500 bn* (13,34)* VP,
MAHOP 1.462,57 bn 13,29 Source: own editing based on palyazat.gov.hu (22/07/2021)
*Amount of ÚMVP is an estimated data (the proportion of contracted grants by policy fields in the 2007-2013 cycle considering the ÚMVP estimation is indicated in brackets)
The presented aggregate data are only suitable for drawing general conclusions, as the operational programmes implemented within the framework of each sector may differ both in their target system and in their intervention logic. However, based on the priorities of the operational programmes and the specific statistics according to the territorial demography, the trends in the aggregate data can be further examined. Therefore, in the following chapter we are going to examine in detail the experiences related to the use of resources in the economic development programmes.
148 KÖZ-GAZDASÁG 2021/4
3.2. Economic development programmes within Széchenyi 2020
The main objective of the Economic Development and Innovation Operational Programme (GINOP) is to develop and promote the competitiveness of Hungarian small and medium-sized enterprises, and to raise employment levels by creating competitive jobs. In addition, as we have already mentioned, the government's intention was to devote 60% of the total cohesion budget to direct economic development. Although strategic and policy documents have not defined the scope of expenditures classified as direct economic development, some analysts [Vízi &
Weinhardt, 2016] have already listed the related investments in the following five areas: research and development and innovation; information and communication technologies; support for small and medium-sized enterprises;
energy, energy efficiency; employment and other economic development. In contrast, in one of our earlier studies [Kiss, 2021], we used a different approach by classifying the calls available for economic actors as direct economic development interventions.
According to some government background studies [e.g. KPMG & GKI, 2017], the impact of business development subsidies on GDP, production and consumption seems to be not adequately significant, while the impact on employment is particularly negative. The literature also discusses other unfavourable, distortive effects of competition – such as the „deadweight effect”
in the case of investments would be undertaken anyway without funding or the
„substitution effect” in the case of investments that do not increase overall economic performance – and highlights the problematics of economically and socially harmful rent-seeking behaviour [Heil & Nagy, 2013 and Nagy & Lóránd, 2013]. Taking into account all of these factors, we aim to examine the content of the GINOP priorities as well as the experiences related to their implementation.
The priority focus of the GINOP is divided along eight priority axes, further detailing the intervention logic within each priority according to specific objectives and investment priorities. The first axis aims to improve the competitiveness of small and medium-sized enterprises by disseminating competitive entrepreneurial knowledge, creating growth opportunities for SMEs and creating a marketable and cooperative SME sector. The second priority is focusing on R&D and innovation investments to increase direct EU tendering activity and RDI activity of knowledge and technology-intensive enterprises through capacity building, as well as to facilitate the creation of cross-sectoral R&D networks. The third objective area is to support information and communication developments by encouraging the deployment of next generation broadband networks, establishing high-bandwidth connections between state and municipal institutions, increasing the product development capacity of the
TANULMÁNYOK 149 information and communication sector and the level of ICT use by enterprises, and also improving citizens' access to information and communication solutions.
Priority four is focusing on the increased usage of energy efficiency solutions and renewable resources. The fifth axis, which integrates the field of employment and jobseekers into the labour market, increases the capacity of social enterprises, establishes labour market programmes organised by non-governmental organisations, raises labour market flexibility and awareness of legal employment and also supports young people not in education or training (NEETs) with an aim to increase their participation in the labour market. While the fifth priority is focusing on the exploitation of labour market reserves, the announced interventions under the sixth axis aim at the creation of a competitive workforce with the support of labour market competence improvement and competence- based training programmes. The seventh priority is in the field of tourism and it has set out the objective of preserving, protecting, promoting and developing the natural and cultural heritage. Finally, the eighth priority includes the repayable financial instruments, which have been announced in line with the above- mentioned policy objectives. In summary, the priority axes and their indicative financial allocations are the following.
5. Table – Priority axes and fund allocation of GINOP
Priority axis Fund allocation
(EUR) Proportion (%) 1. Improve the competitiveness of small
and medium-sized enterprises 1 670 518 675 18,92 2. Research & development, innovation 1 753 486 283 19,86 3. Information and communication
technologies 471 691 982 5,34
4. Energy 212 021 898 2,40
5. Employment 1 712 604 573 19,40
6. Competitive workforce 437 236 313 4,95
7. Tourism 360 532 093 4,08
8. Financial instruments 2 211 712 300 25,05
TOTAL 8 829 804 117 100,00
Source: GINOP
150 KÖZ-GAZDASÁG 2021/4
According to the financial allocation, at the beginning of the budgetary period a quarter of the funds were dedicated to be used as repayable instruments. Such programmes include equity- (e.g. venture capital or guarantee funds) and loan- type schemes (e.g. combined products or soft loans). In addition, in line with the priority and intervention logic, almost 60% of the resources were allocated to priority axes of SMEs development (1.), research & development (2.) and employment promotion (5.) to be used.
Obviously, most of the call for proposals announced within the framework of the GINOP have been available for enterprises. However, it is worth mentioning that many of the announced calls have been able to implement by state actors or non-state organisations too, oftentimes within flagship project regime with pre- nominated beneficiaries. Thus, based on the rules laid down in the calls and the available information through the government’s dataset, the resources allocated to non-economic actors under GINOP may exceed the 40% ratio. This includes, for example, within the framework of Priority Axis 1., flagship projects coordinated centrally by the government’s background institutions, and within the framework of Priority 2., inter-sectorial research and development projects with participation of higher education institutions or research organisations. Moreover, flagship projects under Axes 5. and 6. mainly have been implemented by ministries and state institutions with the aim of a centrally coordinated development of the labour market and employment situation.
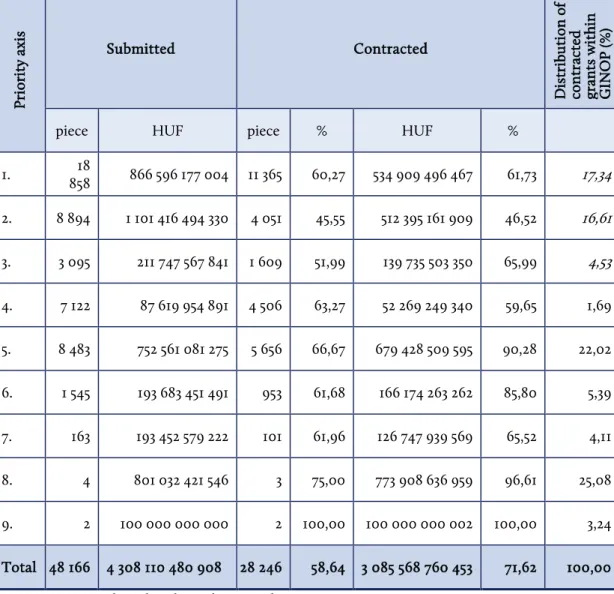
To summarise, based on the current data, the following table (Table 6.) shows the resource requirements have been received in the form of project proposals in response to the announced calls, together with the level of the related budgetary commitments. Based on the data presented in Table 6., there are some percentage point differences in the evidence-based funding data compared to the planned allocations of the priority axes. There is a negative discrepancy in the first three priority axes of the GINOP, where the vast majority of resources have been allocated to economic actors. It should be noted that the GINOP 9. technical priority axis created due to the COVID-19 pandemic also support SMEs through an interest-free quick loan programme.
Nevertheless, most of the resources within GINOP have been allocated under priority five in order to implement the following projects (non-exhaustive list).
The „GINOP-5.1.1-15 Road to the labour market” project of the Ministry of Finance with a grant of 229 billion HUF.
The „Youth Guarantee” project of the Ministry of Finance with a grant of 170,45 billion HUF.
The „Prevention and Management of Redundancies” project of the Ministry of Finance with a grant of 100 billion HUF.
The „Supporting young people in becoming entrepreneurs” project of the
TANULMÁNYOK 151 Hungarian State Treasury with a grant of 26,65 billion HUF.
The „Supporting Jobseekers in Becoming Entrepreneurs” project of the Hungarian State Treasury with a grant of 13,57 billion HUF.
6. Table – Submitted and contracted grants and the distribution of contracted grants within GINOP
Priority axis
Submitted Contracted
Distribution of contracted grants within GINOP (%)
piece HUF piece % HUF %
1. 18
858 866 596 177 004 11 365 60,27 534 909 496 467 61,73 17,34 2. 8 894 1 101 416 494 330 4 051 45,55 512 395 161 909 46,52 16,61 3. 3 095 211 747 567 841 1 609 51,99 139 735 503 350 65,99 4,53 4. 7 122 87 619 954 891 4 506 63,27 52 269 249 340 59,65 1,69 5. 8 483 752 561 081 275 5 656 66,67 679 428 509 595 90,28 22,02 6. 1 545 193 683 451 491 953 61,68 166 174 263 262 85,80 5,39 7. 163 193 452 579 222 101 61,96 126 747 939 569 65,52 4,11 8. 4 801 032 421 546 3 75,00 773 908 636 959 96,61 25,08 9. 2 100 000 000 000 2 100,00 100 000 000 002 100,00 3,24 Total 48 166 4 308 110 480 908 28 246 58,64 3 085 568 760 453 71,62 100,00
Source: own editing based on palyazat.gov.hu (22/07/2021)
152 KÖZ-GAZDASÁG 2021/4
On the whole, in the examined budget cycle, the economic actors should be able to access a significant proportion of the economic development resources only indirectly, or they shall indirectly benefit from the effects of the supported flagship projects. As a result, the above-mentioned programmes have provided assistance to economic actors in the fields of labour market and employment as well. However, these flagship projects will have to take into account the additional costs of management and operation, which can cover up to 2.5-10% of their project budget.
Now let’s see the economic development programme experiences from the budgetary period between 2007 and 2013 and a comparative analysis with the actual one. The Economic Development Operational Programme (GOP) was designed using a simpler but roughly similar priority logic compared to GINOP.
Apart from the priority five for technical assistance, it included the following priority axes.
1. Research & development and innovation for competitiveness 2. Complex development of enterprises (especially SMEs) 3. Strengthen modern business environment
4. Repayable instruments
It can be seen that the priority axes of the GOP can basically correspond to the intervention logic of GINOP, therefore a comparison about allocation experience in these two cycles can also be performed. Table 7. shows the statistics of the received applications within GOP and GINOP, as well as the amount of the contracted funding. It can be stated that the amount of fund allocation within GINOP primarily for small and medium-sized enterprises as economic actors has significantly increased compared to the GOP results in the previous period. The amount of funds spent on the development of small and medium-sized enterprises is about one third (+35.38%), the funds spent on research and development (+68.71%) is about two thirds higher, than the earlier experience and the funds spent on business and IT development programmes are also doubled (+121.08%).
Repayable financial instruments deserve special mention as the volume of these funding has tripled during the period between 2014 and 2020. However, the reason of this is mainly due to the changing regulatory environment as the Member States required to make greater use of financial instruments in this budget cycle.
TANULMÁNYOK 153 7. Table – Submitted and contracted grants within the economic development
programmes by intervention field
Source: own editing based on palyazat.gov.hu (22/07/2021)
154 KÖZ-GAZDASÁG 2021/4
Overall, although the desired proportion of funds intended to be spent on direct economic development could not be realised, a significantly increasing volume of support was outsourced under the economic development programme between 2014 and 2020 compared to the previous cycle. However, more than 40 percent (42.6%) of GINOP funds were granted for public institutions or other non- economic actors (lobbying organisations, the non-profit sector, research sites, etc.).
4. CONCLUSION
This study aims to review the experiences related to the use of EU funds in Hungary between 2014 and 2020, with a special focus on a comparative analysis against the results of the previous cycle and on the detailed examination of economic development programmes.
The budgetary period ending in 2020 included many innovations for both the institutional system of development policy and for applicants and beneficiaries.
The widespread use of electronic administration and the minimisation of paper- based processes simultaneously simplified procedures and management and raised technical and administrative challenges for both the authorities and applicants. Besides, the government and the development policy makers had to meet stricter requirements and apply thematic focusing in relation to designing the partnership agreement. On the one hand the national development plan needed to fit to the eleven thematic objectives, moreover it needed to meet the regional resource allocation rules and also handle the introduction of ex-ante and interim performance measures.
In line with these requirements, the Partnership Agreement combined the strategic expectations of the European Union and also the Hungarian national strategic objectives, as it aimed to promote economic growth based on sustainable, high value-added production and the expansion of employment. The primary goal declared in the strategy document was also to use 60% of development resources for direct economic development funding. It can be considered as a significant volume of resources as Hungary was able to plan to use an „envelope” of around 25 billion EUR, which made it one of the biggest net receivers and most resource- per-capita-intensive Member States.
In terms of the indicative financial programming and allocation practice of operational programmes between 2014 and 2020, there are some noticeable shifts in the emphasis between the sectoral programmes compared to the previous cycle.
The largest beneficiary of this change was the GINOP with a sectoral focus on economic development, and on a smaller scale KÖFOP, which supports administrative investments. At the same time, the operational programmes
TANULMÁNYOK 155 supporting human development and regional and infrastructure investments were able to manage significantly less resources within the Széchenyi 2020 Programme than before. Taking all this into account, the willingness of actors to prepare and submit applications remained high as the high proportion (23,98%) of funds allocated for investments in Central Hungary as a more developed region also deserves special mention. Overall, by July 2021 the amount of the allocated and contracted funds had reached 84,97% of the total budget of Széchenyi 2020.
However, the financial progress of the domestic implementation does not distinctly mean the smooth progress of settlements with the European institutional actors. According to the statistics of the European Commission5 [EC, 2021], so far, Hungary has been able to draw only 65% of the total „envelope” from the EU budget which gives it the ninth place among the Member States. It means that despite the rapid distribution of the funds within the borders, the pace of settlement with the European Union is not outstanding. Furthermore, the processes also have been burdened by the ongoing disputes between the institutions of Hungary and the European Union [Cantat, 2017], which may continue to affect the financial closure of the programming period in the coming years as well.
REFERENCES
Cantat, C. (2017): Cohesion Policy and Perceptions of the European Union in Hungary, A Cultural Political Economy Approach European Commission, Working Paper Series, Center for Policy Studies, CEU
https://cps.ceu.edu/sites/cps.ceu.edu/files/attachment/publication/2960/cps- working-paper-cohesify-cohesion-policy-eu-perceptions-hungary-2017.pdf Endrődi-Kovács, V. (2012): Szerbia integrációérettsége, Délkelet-Európa Vol. 3. No.
3.
https://www.southeast-europe.org/pdf/11/DKE_11_M_DK_Endrodi-K- Viktoria_Szerbia.pdf
European Commission (2016): Annual Report on European SMEs 2015 / 2016 https://ec.europa.eu/jrc/sites/default/files/annual_report_-_eu_smes_2015-
16.pdf
European Commission (2020): An SME Strategy for a sustainable and digital Europe
https://ec.europa.eu/info/sites/default/files/communication-sme-strategy- march-2020_en.pdf
5 cohesiondata.ec.europa.eu/overview#
156 KÖZ-GAZDASÁG 2021/4
European Commission (2021): Open Data Portal for the European Structural Investment Funds https://cohesiondata.ec.europa.eu/
Heil, P. & Nagy, S. Gy. (2013): A kohéziós politika elmélete és gyakorlata, Akadémiai Kiadó, Budapest
Kiss, G. F. (2021): Új EU pénzek Magyarországon: a jóból is megárt a sok!
https://www.portfolio.hu/unios-forrasok/20210105/uj-eu-penzek- magyarorszagon-a-jobol-is-megart-a-sok-463898
KPMG & GKI (2017): A magyarországi európai uniós források felhasználásának és hatásainak elemzése
https://www.palyazat.gov.hu/magyarorszagi_europai_unios_forrasok_elemze Miniszterelnökség (2014): The Partnership Agreement of Hungary se
https://www.palyazat.gov.hu/download.php?objectId=67029
Miniszterelnökség (2021): Széchenyi 2020 information website https://www.palyazat.gov.hu/
Nagy, S. Gy. (2013): The internalization of the Spanish SME sector, Society and Economy, Vol. 35., Issue 1., pp. 71-86.
Nagy, S. Gy. & Lóránd, B. (2013): Evaluation of EU fund dependency – Dead weight loss and substitution effect, In. Pálné Kovács Ilona, James Scott, Gál Zoltán (ed.): Territorial Cohesion in Europe, MTA KRTK, Pécs. pp. 109-122.
Publications Office of the European Union (2013): REGULATION (EU) No 1303/2013 OF THE EUROPEAN PARLIAMENT AND OF THE COUNCIL https://eur-lex.europa.eu/legal-
content/EN/TXT/HTML/?uri=CELEX:32013R1303&from=hu#d1e3144-320-1 Vízi, I. & Weinhardt, A. (2016): Elbukja a kormány az egyik legfontosabb vállalását https://www.portfolio.hu/unios-forrasok/20161121/elbukja-a-kormany-az-egyik-
legfontosabb-vallalasat-240267