Social Differentiation and Spatial Patterns in a
Multiethnic City in the Nineteenth Century: Potential Uses of GIS in the Study of Urban History
1Gábor Demeter and Róbert Bagdi
Research Centre for the Humanities, Hungarian Academy of Sciences demeter.gabor@btk.mta.hu
This study is a GIS-aided quantitative statistical analysis which aims to explain the spatial patterns of sociodemographic phenomena in an urban community in the era of transition from preindustrial to industrial society. It is also a methodological attempt to use a unique source type and compare different methods used for social classification.
Using the Hungarian census data from 1870, we tried to assess the wealth levels of different social groups indirectly and compare the internal inequalities within these groups with internal inequalities within social groups in other regions. The source also provided material on the basis of which we were able to reconstruct social networks, migration patterns, different strategies adopted by different religious communities, patterns involving occupation and age group, etc. We were able to compare the potential uses (and limits) of this source with the uses and limits of other sources. Our main goal was to put more emphasis on a spatial-regional approach, which is underrepresented in the Hungarian historiography, while geographers tend to refrain from putting their research into historical frames and contexts.
Keywords: HGIS (GIStory), urbanization, spatial patterns, social stratification, classification methods, quantitative analysis, wealth, 1870 census data
Aims
Although our study essentially aimed to (1) analyze and explain spatial patterns of sociodemographic phenomena in an urban community in the era of transition from preindustrial to industrial society by testing the potentials of a unique source (the census of 1870), other, primarily methodological aspects also arose which are worth further discussion and which put this article into a broader context. We have attempted (2) to outline three different methods which can help researchers identify different social layers in urban societies. We also
1 This study was realized with the support of the NKFIH FK 128 978 (Knowledge, Landscape, Nation and Empire: Practices of Knowing and Transforming Landscape in Hungary and the Balkans, 1850–1945) research project.
attempted (3) to give an indirect estimate of the wealth levels of different social groups in the late nineteenth century by using the census data and to compare local internal inequalities with inequalities measured in other urban settlements and regions. We also considered (4) the potential applications and limitations of the source in question in attempts to reconstruct social networks and migration patterns, and we compared the uses of this source to other source types.
The applications of HGIS2 might be familiar to geographers and historians in the West, but the use of this method in Hungarian historical research is underrepresented at the moment (the only existing concise database, compiled for the city of Debrecen on the basis of census data from 1870, remains unevaluated). 3 Geographers dealing with GIS-aided planning refrain from engaging in research focusing on the past, though the lack of knowledge of the histories of peripheral areas may lead to the adoption of mistargeted policies in development planning. Historians use a “vertical” (sociological) approach instead of spatial (regional) one, but recent studies have shown that the regional diversity in Hungary was not negligible. Thus, generalizations based on small datasets extrapolated to the whole country (and terms like “average”) can be misleading. Our fifth goal, therefore, was to test the applicability of GIS in the field of history. This study can be considered a draft project for the later, more broadly framed projects, such as GISta Hungarorum (2015–2017).4
Data
The source on which we based our inquiry was chosen because of its uniqueness.
which enabled us to investigate and map certain phenomena into which other sources yielded no insights. The census of 1870 was the first modern census
2 HGIS = Historical Geographical Information System (or GIStory, or GIS-aided historical research). For GIS-aided historical research the term HGIS is more common than GIStory. See Gregory, Ian N. A place in History: A short introduction to HGIS by the lead developers of GBHGIS.
http://hds.essex.ac.uk/g2gp/gis/index.asp; or https://www.gislounge.com/find-gis-data- historical-country-boundaries/ and http://www.hgis-germany.de/, http://www.hgis.org.uk/
resources.htm#top. GIStory is also accepted (see GIS and the City conference in Darmstadt, 2018: https://www.geschichte.tu-darmstadt.de/index.php?id=3633). Many thanks to János Mazsu for drawing our attention to the terminological problems.
3 Project OTKA 81 488. Principal investigator: János Mazsu. The reconstruction of social and spatial patterns of Debrecen, 1870–72 was considered the predecessor of this investigation. Recently, Réka Gyimesi initiated a similar project.
4 For the results see http://www.gistory.hu/g/hu/gistory/gismaps and http://www.gistory.
hu/g/en/gistory/otka.
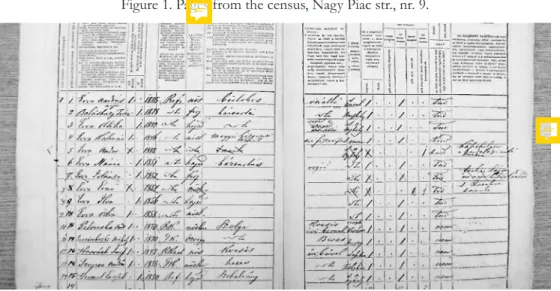
taken by Hungarian authorities, and (far more importantly) it was the only state inquiry that was based on household level (Figure 1) and not on individual data sheets (later censuses were based on individual data sheets). Furthermore, almost at the same time, a cadastral mapping was also done in 1865 indicating every house with its identification number, which was identical with that of the numbers used in the census sheets.5 This temporal proximity and the survival of the original unpublished sheets in some counties6 (data were published officially only at the district level in the census volumes) made it possible for us to illustrate sociodemographic phenomena on maps at the household level and even to assess wealth levels based on property at the beginning of the era of industrialization.
The original census sheets from 1870 contained the name, age, address, birthplace, occupation, and religion of the head of the family, and these data were repeated for the wife, children, coworkers/employees, servants, and housemaids living in the same “household.”7 The sheets also provided the number of rooms, kitchens, auxiliary buildings (storage areas, stables, cellars) for each household.
As the census did not contain income data, some of the abovementioned variables were utilized as proxies for wealth in order to divide the population into social (i.e. income-related) layers. Beyond wealth, general sociodemographic phenomena with or without spatial patterns (such as the average number of children of different occupational groups, the average number of children of groups belonging to different religions, migration patterns, interreligious marriages, territorial aspects of marriage patterns, territorial distribution of religious groups, etc.) were also traced using the aforementioned variables.8 The data also made it possible to create new indicators beyond those given in the census, such as population density (room/person) and ratio of earners per family. These derived data were also used as proxy variables to approximate wealth.
Our household-level database contained 2,150 entities (families, Wohnparthey), cca. 1,000 houses with approximately 10,000 persons and a dozen
5 Source: MNL-BAZML SFL XV. 83. box. 77–79. Now www.hungaricana.hu and www.mapire.
eu (containing settlement level cadastral maps) offer new instruments to find maps with good resolution and information on identification numbers.
6 The data sheets from Zemplén, Ung, and Sáros Counties also survived almost intact in the county archives.
7 The term household and family are not synonyms: a word describing the situation more properly is the German “Wohnparthei”. In the following, we use the three terms as synonyms despite the minor differences.
8 Demeter and Bagdi, A társadalom.
indicators. Phenomena with spatial pattern were analyzed using GIS (ArcGIS 10.1), while within-group and intergroup differences (like religious composition of occupation groups, differences in wealth levels of religious groups and occupations, ageing, migration, differences in fertility rate, etc.) were evaluated using SPSS.
Figure 1. Pages from the census, Nagy Piac str., nr. 9.
Source: MNL-BAZML SFL XV. 83. box 77–79.
The place
The selection of the town of Sátoraljaújhely (the county seat of Zemplén County) as a sample area was ideal from several perspectives. The original census sheets were available for 2,150 households, thus offering substantial material for quantitative statistical analysis, and even the timing of the census itself (1870) was fortunate from the perspective of our inquiry, which focuses on the identification of persisting and transforming urban structures. As a basic step towards industrialization, the railway was opened in 1870, while guilds were dissolved only in 1872, and this implied the parallel coexistence of both traditional and modern social patterns and social layers. In addition, the town had had an inherently positive geographical position for centuries, as it was located along the market line, where the goods produced in the plains and in the mountains were exchanged. The physical geographical conditions allowed a north-south pattern of migration from the peripheries of Zemplén County (the border of which was also a state border) to the county seat, while in the
southern part of the county an east-west migration route developed from the Great Plains towards the capital, Budapest. Although in 1775, the county seat was so peripheral that it was unable to extend its attraction zone very far even within its own administrative district, between 1810 and 1870, its population tripled, and this population growth was among the largest in comparison with the neighboring towns (Table 1). The nearby city of Eger, which was similar in size and had similar functions (it was also a county seat), showed only a 40 percent increase. By 1900, 50 percent of the inhabitants of Sátoraljaújhely were registered as not indigenous (i.e. born in a different locality),9 a figure which confirms the great role of horizontal mobility and migration. As the average number of children per household was only 1.8 in Sátoraljaújhely (1870), without migration, the population would not have increased at all.10 The acceleration of urbanization processes became more evident during industrialization (the population increase was only 50 percent between 1784–1825 and 1825–1870, but then it doubled in the next 40 years, exceeding the country average), making a melting pot of the town. This was reflected in its religious diversity. In 1870, 35 percent of the population was of Jewish origin, Roman Catholics constituted 30 percent, Calvinist protestants 12–14 percent, Greek Catholics approximately 18–20 percent, and there were some Lutheran inhabitants too. 11
9 This value is high compared to neighboring towns and towns with similar sizes and functions. In Mukačeve (Munkács) the same figure was only 45 percent. Dányi describes Sátoraljaújhely as a “para- center.” Dányi, “Regionális vándorlás,” 99–103. Despite its development, the town was still unable to attract its larger “Hinterland” in the nineteenth century (despite the high birth rate the population decreased in the northern part of Zemplén County and in the northern part of Sáros County by 20 percent between 1880 and 1910 due to massive emigration to America and not to local centers.
10 While Eger became peripheral as major railway routes bypassed it, Sátoraljaújhely became a traffic center, an intermediate station of population movements towards Budapest. The main source area was Upper Hungary: the proportion of migrants arriving to Sátoraljaújhely from this direction was higher than that of migrants arriving from Zakarpatiya and from the regions beyond the Tisza River. Demeter and Bagdi, “Sátoraljaújhely,” Table 3.
11 The country averages were as follows: Roman Catholic: 52 percent, Greek Catholic: 10 percent, Calvinist: 12,5 percent, Israelites: 4.5 percent, Lutheran: 6.5 percent. So Greek Catholics and Jews were overrepresented and Roman Catholics and Lutherans were underrepresented in the town compared to national average. Katus, A modern Magyarország, 483.
Table 1. Population increase referring to the rate of urbanization (1825–1900) in Sátoraljaújhely compared to the surrounding significant towns
Town Population increase
(1825–1900) Population in 1,000
(1825) Population in 1,000 (1900)
Eger +40% 17.5 24.5
Kassa (Košice) +180% 13 38
Miskolc +80% 22 40
Sátoraljaújhely +200% 4 (1784), 6.3 (1825) 10 (1870), 19.9 (1910) Source: Beluszky, Magyarország településföldrajza.
General features of the urban society
The evaluation of the urban society began by creating a correlation matrix containing the quantifiable variables of the database. The correlation between demographic indicators was weak in many cases (no connection was observable between number of children and family wealth or between the proportion of earners and wealth) (Table 2), thus many of the recorded indicators can be interpreted statistically as independent variables. However, some of the indicators still showed correlations with other variables. Therefore, in order to interpret these phenomena, diagrams illustrating the internal distributions were also created. Some of the variables were not quantifiable (like religion), thus correlations could not be calculated. The relationships between these variables and other indicators were also illustrated on diagrams. In order to illustrate the internal differentiation within the dataset, both mean and standard deviation values were calculated for the whole population and were used as reference points when comparing subsets (Tables 3 –11).
Table 2. Correlation between the quantifiable variables (for each family). Strong correlations are indicated by grey background
Indicator
Age Servants Coworkers
Total inhabitants Proportion of earners Number of rooms Proportion of children
Inhabitant per 1 r
oom Wealth 1 Wealth 2
Age 1.000 -0.011 -0.134** -0.047* -0.006 -0.141** -0.099** 0.099** -0.158** -0.171**
Servants -0.011 1.000 0.097** 0.427** -0.276** 0.513** -0.071** -0.122** 0.369** 0.537**
Coworkers -0.134** 0.097** 1.000 0.408** 0.240** 0.236** 0.074** 0.152** 0.113** 0.426**
Indicator
Age Servants Coworkers
Total inhabitants Proportion of earners Number of rooms Proportion of children
Inhabitant per 1 r
oom Wealth 1 Wealth 2
Total
inhabitants -0.047* 0.427** 0.408** 1.000 -0.560** 0.424** 0.610** 0.501** -0.197** 0.103**
Proportion
of earners -0.006 -0.276** 0.240** -0.560** 1.000 -0.194** -0.539** -0.330** 0.234** 0.183**
Number
of rooms -0.141** 0.513** 0.236** 0.424** -0.194** 1.000 0.063** -0.530** 0.613** 0.710**
Proportion
of children -0.099** -0.071** 0.074** 0.610** -0.539** 0.063** 1.000 0.523** -0.416** -0.304**
Inhabitant
per 1 room 0.099** -0.122** 0.152** 0.501** -0.330** -0.530** 0.523** 1.000 -0.796** -0.601**
Wealth 1 -0.158** 0.369** 0.113** -0.197** 0.234** 0.613** -0.416** -0.796** 1.000 0.911**
Wealth 2 -0.171** 0.537** 0.426** 0.103** 0.183** 0.710** -0.304** -0.601** 0.911** 1.000 Explanation:
Coworker: inhabitant living together with the family-head but having his or her own earnings but not his or her own home (servants are not included in this group, but craftsmen-students are); employees of the family head, or grown up relatives of the family head employed elsewhere.
Wealth 1: indicator for the economic potential of the “Wohnparthey” calculated based on an equation containing the number of household servants, coworkers, economic buildings, number of rooms, and family size.
Wealth 2: indicator for the economic potential of the “Wohnparthey” containing the number of household servants, coworkers, economic buildings, and number of rooms but not family size.
**significant, p=0.05. Calculated-derived indicators are indicated by italicized letters. Base data: MNL- BAZML SFL XV. Census data from 1870.
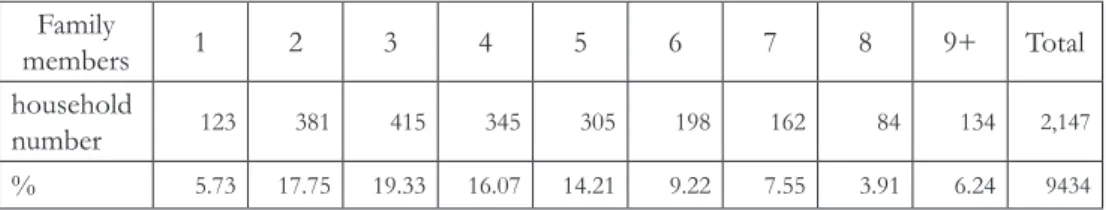
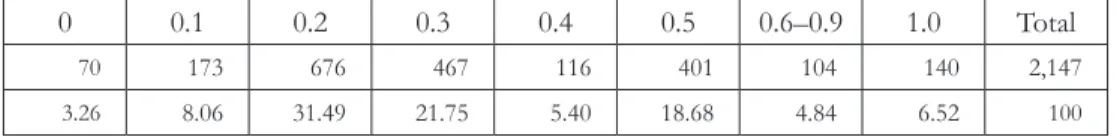
Table 3. The size of “Wohnparthey” in Sátoraljaújhely in 1870 (prs and %) Family
members 1 2 3 4 5 6 7 8 9+ Total
household
number 123 381 415 345 305 198 162 84 134 2,147
% 5.73 17.75 19.33 16.07 14.21 9.22 7.55 3.91 6.24 9434
Table 4. Inhabitant/room values for the “Wohnparthey” in Sátoraljaújhely (prs and %)
0–1 1.1–1.5 1.6–2 2.1–2.5 2.6–3 3.1–4 4+ Altogether
214 125 375 120 352 391 529 2,147
9.97 5.82 17.47 5.59 16.39 18.21 24.64 100
The general sociodemographic features of the town can be summarized as follows. The town had cca. 1,000 houses, but 2,150 registered “families,”
which means that on average one house was home to at least two Wohnpartheys.
(For example, one kitchen was often used jointly by two or three families). The average family size was 4.4 people for one Wohnparthey in 1870 in Sátoraljaújhely.
25 percent of the households had six or more and 23 percent had two or less members.12 The average population density was three people per room, but there was significant variety. 25 percent of the households were characterized by density above four people per room. In 10 percent of the families, at least every second family member was an earner, while in 8 percent of the families the earnings of one person were enough to maintain a family of ten. The average number of rooms per family was 1.5 in the town, but here too there were considerable discrepancies, and the average value was hardly greater than the value measured in villages.13 50 percent of families had only one room, and 8 percent had less than one, while only 10 percent had three or more rooms. 14 In Hungary, the average was 3.8 people per room in 1869 (and 3.5 in 1910). In Sátoraljaújhely, it was three people per room.15 Servants were abundant in only 25 percent of the households. They constituted 7.3 percent of the society. The average number of servants was 0.33 per family for the whole town. Earners without their own Wohnparthey constituted 10 percent of the population (978 persons), but only in 10 percent of the Wohnpartheys do we find more than one coworker, and 75 percent of the families had none. 28 percent of the “families”
had no children (the family head was too young or was older and the children had already left the family home). In Belgrade, this figure was only 17 percent in 1900.16 On the other hand, 30 percent of the Wohnpartheys had more than two children (in Belgrade this was 26 percent). The average number of children was 1.8 per family. Jewish families had 2.4 children of average, Greek Catholics had only 1.4, and Roman Catholics and Calvinists had 1.6. Only 11 percent of the
12 The average for Pest County in 1896 was 4.6. Őri, “Család és házasodás,” 75. For Istanbul, this figure was 4.1 people around 1900. In some of the immigrant-dominated quarters it fell below 3.8. Based on a sample of 2,500 people, the average Bulgarian and Muslim household size in towns in the 1860s was 4.4 and 4.7 people respectively, while in Muslim villages this reached 4.9. Todorova, “Situating the family,” 452.
13 In 1930, 70 percent of the houses in Slovenia had only one room. Malojčić, Selo i tuberkuloza.
14 Three rooms are considered as a minimum to consider a family “middle class” according to Gerő. Thus, in Sátoraljaújhely, approximately 13 percent of the households fit into this category. Gerő, Dualizmusok, 149.
15 Ibid., 148.
16 Malojčić, Selo i tuberkuloza.
family heads were younger than 30. 11 percent was older than 60 (the average was 39). Altogether, 39 percent of the total population was under 18 years of age (the figure was similar for the whole of Hungary).
Table 5. Proportion of earners in the “Wohnpartheys” of Sátoraljaújhely in 1870 (prs and %)
0 0.1 0.2 0.3 0.4 0.5 0.6–0.9 1.0 Total
70 173 676 467 116 401 104 140 2,147
3.26 8.06 31.49 21.75 5.40 18.68 4.84 6.52 100
Table 6. Average number of rooms / family (Wohnparthey) in 1870 in Sátoraljaújhely (number of rooms and %)
Number of rooms under 0.5 1 2 3 4 5+ Total
households 170 1,175 488 150 69 55 2,147
% 7.92 54.73 22.73 6.99 3.21 2.56 100
Table 7. The number of servants in family households in 1870 in Sátoraljaújhely (prs and %)
Servants (prs) 0 1 2 3 4+ Altogether
households 1,665 336 91 34 21 2,147
% 76% 15.65 4.24 1.58 0.98 730
Table 8. Number of coworkers and earners (not in family-head position) in Sátoraljaújhely in 1870 (prs and %)
Coworkers 0 1 2 3 4+ Altogether
households 1537 383 143 46 38 2,147
% 71.59 17.84 6.66 2.14 1.77 100
Table 9. Number of children in the Wohnpartheys/families in Sátoraljaújhely in 1870 (prs and
%)
Number of children 0 1 2 3 4 5+ Altogether
households 619 462 424 303 165 174 2,147
% 28.83 21.52 19.75 14.11 7.69 8.10 100
In Belgrade these figures were 17, 34, 24, 11, 7, and 7% respectively around 1900.
Table 10. The distribution of family heads in Sátoraljaújhely based on their date of birth (prs and %)
Year of birth - 1809 1810–
1819 1820–
1829 1830–
1839 1840–
1849 after
1850 Altogether
family heads 238 447 578 645 236 3 2,147
% 11.09 20.82 26.92 30.04 10.99 0.14 100
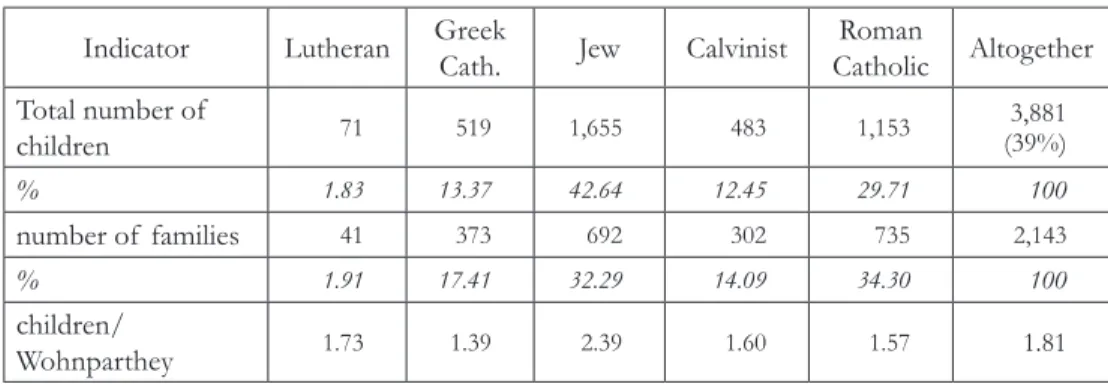
Table 11. Demographic indicators in Sátoraljaújhely in 1870 (prs and %) Indicator Lutheran Greek
Cath. Jew Calvinist Roman
Catholic Altogether Total number of
children 71 519 1,655 483 1,153 (39%)3,881
% 1.83 13.37 42.64 12.45 29.71 100
number of families 41 373 692 302 735 2,143
% 1.91 17.41 32.29 14.09 34.30 100
children/
Wohnparthey 1.73 1.39 2.39 1.60 1.57 1.81
Data from: MNL-BAZML SFL XV. Census of 1870.
Local mobility – local networks
As the registry of 1870 offers only a “snapshot” of the social situation, and as its structure differs from the later censuses, the usefulness of this material (unlike the usefulness of parish registers, for example) to identify social networks and relationships or to trace patterns of change of residence among members of the younger generation is rather limited. But in certain cases, the registry still offers significant data on the basis of which one can venture hypotheses concerning trends or patterns in household composition. The marriage of the Calvinist noble landowner family Evva, which played a crucial role in the life of the county and had five rooms and an additional two rooms rented to Jewish grain merchants, and the influential and rich Catholic Farkas family (a lawyer dynasty with eight servants and coworkers, owning six rooms and renting two rooms to merchants) offers an example of the unification of two elite families with different social roots and belonging to different denominations. (Inter- denominational marriages were relatively rare, coming to only 15 percent of all marriages). The old family head András Evva (1805–1888) had already been mentioned prior to 1848 as the leader of the reformist political opposition in
Zemplén.17 He managed to keep his position even after the repressions between 1849 and 1867, and he became the president of the county jurisdiction. His wife, Teréz Balásházy, also hailed from an old, local noble family, mentioned early in the eighteenth century as one of the “urban” noble families.
Another example of the decreasing role of religion within the noble elite is given by the Catholic Spek family. Irma (1847–), a relative of Antal Spek (1804–) who was a member of the local town council, married the Lutheran lawyer Ignác Boros and settled down in the main street of the town (Kazinczy Street) near the widow of Ferenc Spek (house nr. 651 and 655). Thus, they were able to look after each other. Furthermore, the elder daughter of the latter widow married a royal official, thus broadening the family network. We may point out that, while at this time the intermingling traditional landowner and administrative elite had already accepted the “honoratior” layer (highly educated non-nobles in important position) as equal partners, the traditional elite living in the town still refrained from entering into relationships with the new financial elite.
The tightness of the relations among relatives can often be measured through territorial concentration, as the above example showed. Social networks had spatial patterns too, but there were remarkable differences in the cases of different strata. For example, the innkeepers of the town also tended to enter into family relationships with one another, but they settled relatively distant from one another as their main aim was to distribute the market between the possible competitors in order to maximize income and minimize competition.
A comparison of other (earlier) registries with ours offers even greater potential as a method of identifying networks, social (vertical) mobility, migration processes (horizontal mobility), etc., but it also requires more work. The noble Kapy family, the richest at the end of the eighteenth century with 90 hectares of land, had almost disappeared by 1870. Apart from one young a child, only one person from this family was registered as an inhabitant in Sátoraljaújhely, the wife (1837–) of Calvinist county official József Bárczy.18 The Marchalko family was also a prominent noble family in the eighteenth century in the town, but by 1870 only one person, the Roman Catholic wife (1817–) of another Calvinist, István Somogyi, bore this name.19 This also indicates that the fusion of the elites of different origins and denominations was in an advanced phase by that
17 Veliky, A változások kora.
18 Of course, migration was not the only factor. A family name might go extinct if there were no sons, and this limits the relevance of our investigations.
19 Barta, Ha Zemplin vármegyét, 298. 312–13.
time. Protestants traditionally held leading positions in the urban and county administration in Zemplén (this is a specific feature of the county), and they were overrepresented compared to their proportion in the whole urban population.
Roman Catholics were mainly landlords, and their weight in the county council and the urban government was smaller in the first half of the nineteenth century.
Intermarriage and the general decline in the number of Protestants enhanced their position first on the urban council and then on the county council.
Family and kinship networks which existed at the time the registry was drawn up can also be traced, but only within limits.20 The maiden name of the wife of tailor János Keller, who lived at Papsor nr. 474, was Sztropkovics. Her mother also lived in the same household, while in the same house, but in another
’Wohnparthey’ a Sztropkovics boy established a family. In this case, the relatives remained relatively close to one another because of their limited financial means.
The house was divided between the two Sztropkovics descendants, and the husband moved into his mother-in-law’s house. Another example of relatives from different communities living relatively close to one another reveals family and business strategies. Eszter Hell, the widow of a Jewish textile merchant (haberdasher) named Svajger, and the textile merchant Salamon Hell (who was her close relative) also lived in neighboring households (nr. 475 and 477).
Another relative of her sons (the Svajger-children), Samuel Svajger also lived in the neighborhood (nr. 490, Széchenyi Square). Samuel Svajger was also a textile merchant (haberdasher). Adolf Hell, another haberdasher and relative, lived at nr. 498. Kinship and family ties also influenced business behavior. The marriage between the Svajger and the Hell merchant families promoted accumulation of capital, while it decreased competition. At the same time, the relative closeness made it easier for members of the families to provide care for widows, orphans etc.
Spatial patterns: religion, occupation, population density
Though the town was depicted as a melting pot, the Jewish community had not been granted full rights in all fields of life in the 1860s. This naturally raises a question. Was there was any segregation observable between religious communities despite the diversity? Based on the map illustrating the religious
20 The census does not mention family ties between the Wohnpartheys. This hinders reconstructions without the aid of parish registers. The same constraints are valid for the investigations of matrilocality or patrilocality.
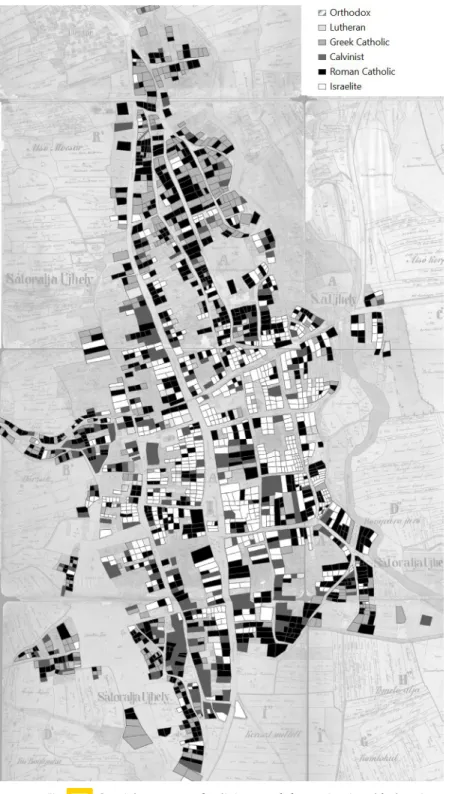
distribution of the population (Figure 2),21 Jewish households were concentrated in the center of the city (they did not own the houses, but rather rented them from the local protestant elite). These houses were predominantly located at some of the major crossroads (Óhíd Str., now Dózsa Str.; Újhíd Str., now Rákóczi Str.; and Malom Str., now Munkácsy Str.) which ran perpendicular to the main road, which led in a north-south direction. Despite the presence of some clusters of houses inhabited exclusively by Jews22 and the prohibition of interreligious marriages between Jews and Christians at the time, we cannot speak about the segregation of Jews for two main reasons. First, the area of the settlement in which Jews lived in high concentrations included the road where the local elite lived and the major scenes of urban life (community spaces, administrative buildings) took place. The presence of Jewish residents of the town was also traced in the secondary main road leading eastward through the Ronyva-bridge, which means that they were integral part of the town.The fact that Jews were able to pay the high prices for rental properties in the center of the town and that the families of the elite lived alongside Jewish families (see the example of the Evva family) means that (1) the Jewish society (or societies) was a differentiated one and (2) the elite tolerated their presence, because Jews served as significant source of income for the traditional local elite, which refrained from capital investment in industry. The second reason is that still there were intersections and blocks of a religiously mixed character. 23
Calvinists lived in houses along the main streets running north to south.
Some of these streets bear the names of traditional handicrafts (Gubás Str., now Esze Tamás Str.). Thus, protestants living in homes on these streets represented the imprints of the traditional socioeconomic structure (and this also reflects their once higher proportion and prestige within the population). Their spatial pattern originally showed a continuous line along the main road, but this was broken up by 1870, and the rich Calvinists (based on population/room, total number of rooms, etc.) in the city center became separated from the Calvinists craftsmen who belonged to the lower middle-class.
21 http://www.gistory.hu/g/hu/gistory/gismaps. See maps: chapter 8, urban society.
22 The blocks inhabited by Jews cannot be considered fully homogeneous because of the Christian servants and maids. The sources provide no information regarding the separation of Orthodox and Neologue Jews: in Sátoraljaújhely each group had a synagogue.
23 Most of the Jews in Debrecen also lived in the city center (along Hatvan Str. and Piac Str. near the Great Church of the Calvinists): 40 percent of the Jewish households dwelled in six streets. See Mazsu,
“Inside borders” and Mazsu, “Piac, kereskedelem, kapitalizálódás.” In Sátoraljaújhely the preference of north-south and east-west main roads was observable among Jews, and though the east-west axis was of secondary importance regarding migration routes, it was a non-negligible direction concerning the movements of goods (grain trade).
Greek Catholics lived in the northern and southernmost outskirts of the town, near the vineyards (which lay to the north and northwest) and the arable lands (which lay to the south). This clearly indicates their sectoral distribution and social position. Most of them were agrarian wage laborers or craftsmen of less prestigious occupations. Roman Catholics were abundant in the city center (mixed with Protestants) and on the fringes, which indicates advanced social differentiation among them. Jews also had a lower-class layer located on the outskirts, which was separated from the richer layers.
To summarize, though there were relatively homogeneous blocks or street sections (the Jewish blocks in the center, the streets in the north and the southeast—Kis Pazsic, Baracz—which were dominated by Greek and Roman Catholics, and the quarter inhabited by Protestant craftsmen in the south), segregation was not as characteristic of Sátoraljaújhely as it was of Bonyhád, for example.24 The spatial differentiation among people who belonged to different religions or denominations and people who pursued different occupations was advanced by 1870 and this differentiation was more based on social position than on the denominational differences.
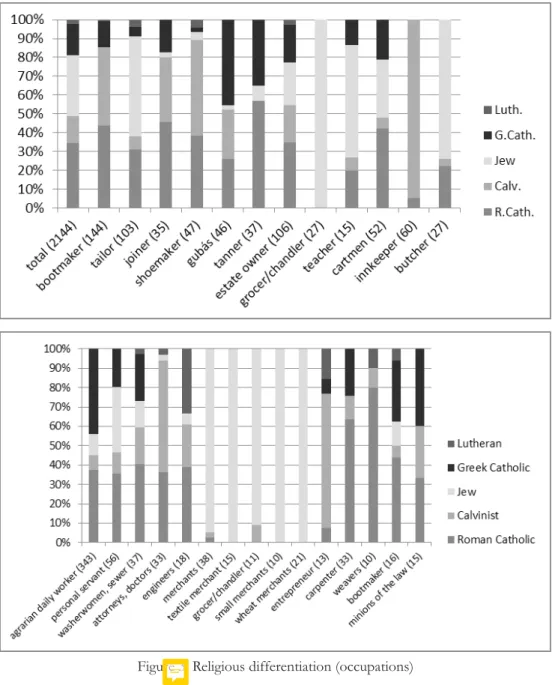
Interreligious marriages constituted 15 percent of the total, 25 though half of these took place between Greek and Roman Catholics and 23 percent between Roman Catholics and Calvinists. Houses were often inhabited by families belonging to different denominations, and sometimes even the distribution of markets was observable: the Jewish butcher shared a house with a Greek Catholic bacon-maker. This strange phenomenon drew our attention to another one: among butchers, Jews were overrepresented. They met the demands of their co-religionist population, but also those of other denominations. This indicates practical trust and reception of Jews in our interpretation, who were also overrepresented among merchants (Figure 3). Another (rather symbolic) sign of their emancipation was the fact that Jews and Greek Catholics (the latter constituted the poorer half of society) were also found among the urban and county officials, who were primarily Calvinists.
(represented by 1-1 scribe) (Figure 9).
As for the spatial pattern of occupations, our general observation is that industrialization was not yet advanced enough (two years before the abolishment of guilds) to ruin traditional old structures completely. Tanners still lived along the Ronyva River, as water was essential to their craft. Their downstream and
24 Gyimesi and Kehl, “Spatial analysis of the socioeconomic structure.”
25 Pozsgai registered 5–7.5 percent in the two districts and cca. 40 settlements in the rural Torna County in 1870. Compared to this, Sátoraljaújhely was really functioning as a melting pot. See Pozsgai, “Görög és római katolikus nemzetiségek.”
Figure 2. Spatial patterns of religious and denominational belonging (family heads) in Sátoraljaújhely in 1870
Source: MNL-BAZML SFL XV. 83. box. 77–79.
upstream concentration was also not surprising. Because of the stench (a by- product of their work), they were pushed out from the surroundings of the bridge across the Ronyva, which functioned as the main supply route leading to the town’s railway station. Tanners who were living downstream along the Ronyva did not affect the urban neighborhood negatively with their activity.
The craftsmen who made heavy mantles lived mainly in the street named after
Figure 3. Religious differentiation (occupations)
them in the south (“Gubás,” from “guba,” a term used to refer to a mantle made of wool or felt) and in the north (dominated by the poor), and they were mostly Greek Catholics (for their relative wealth, see Table 22). Bootmakers, who were primarily Calvinists, lived in the southern districts on a “hidden”
road parallel to the north-south main road, but many of them also lived on the western fringes called Zsólyomka, which was also among the poorer districts.
Joiners (middlemen, based on Table 22) lived scattered and evenly dispersed, while butchers were lived to the west of the main road (no butchers lived in the northern districts). Tailors lived around the town center (Figure 8).
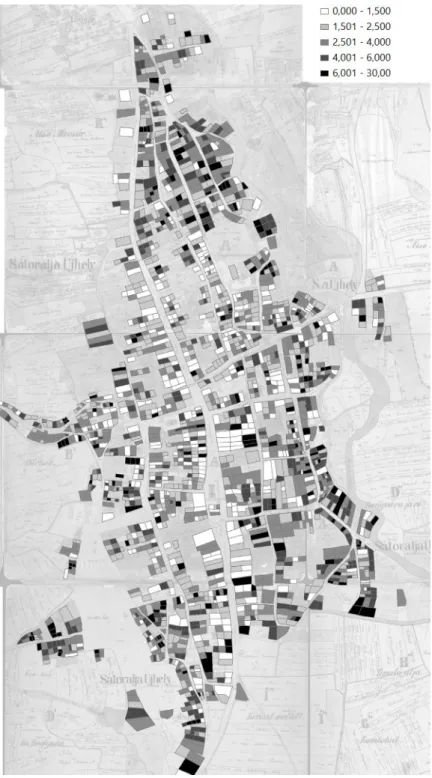
Investigations (discussed later in detail) proved that the location of the residences of people who pursued different occupations (i.e. the distance from the functional center of the town) correlates with the people’s wealth or social prestige. Urban and county officials lived along the north-south axis (teachers, school inspectors, state attorneys, judges, crown counsels, prosecutors), surrounded by representatives of freelance professions26 (pharmacists, architects, vets, doctors, goldsmiths, private lawyers, house owners). The outer circle of the town center was dominated by assistant officials, clerks (urban, financial, insurance, postmen, policemen) and by financial experts (banking). This was followed by the zone which was inhabited by craftsmen and the outermost circle, which was inhabited by agrarian workers (Figure 8). (Servants and agrarian daily wage-laborers dominated in the northern districts, the southeastern parts of the settlement, and the west, in Zsólyomka.)
Inns, mansions, and restaurants were concentrated in the center or around the bridge over the Ronyva and in the western parts of the town near the vineyards and arable lands, from where daily-wage laborers returned tired and thirsty day after day. The first houses along the streets leading to the town also functioned as inns or restaurants to offer shelter to those who arrived on foot or by cart from the surrounding regions. (The persistence of these suburban inns indicates that railway had not yet modified the traffic patterns; Figure 8). Merchants were concentrated in the town center and the west-east road leading to the Ronyva bridge, while shopkeepers (including chandlers and grocers) targeting different layers frequently lived in the eastern and western outskirts along the main roads leading to the arable lands.
26 Supplemented by craftsmen serving the high-elite with their specialized knowledge.
Figure 4. The spatial pattern of population density (person/room) in Sátoraljaújhely in 1870
The social and religious composition of migrants
In urban environments, the role of natural reproduction in population growth has usually been smaller than that of migration. Even in the introverted Eger, which had an increase in its population of only 40 percent between 1825 and 1900 (the population of Sátoraljaújhely tripled over the course of this period), more than 75 percent of the increase was the result of migration, as the net growth rate until 1873 was critically low (demographic pattern was characterized by high mortality beside the and a high birth rate).27 In Sátoraljaújhely, the main source of population growth was also migration, which played a key role in the transformation of the city’s character.
The transformation of traditional structures can also be examined by measuring the frequency of migrant intermarriages (and the spatial pattern of migrant intermarriages) alongside the frequency of religious intermarriages or the spatial pattern of occupations. (The latter two can also indicate theses transformations: a dispersed spatial pattern usually indicates the dissolution of original structures).
Altogether, 33 percent of family heads were indigenous to the settlement, while the proportion of local-born wives was somewhat higher, reaching 45 percent.
This means that the male population was more mobile and also that local-local marriages could not have been more than 30 percent in the town.28 In contrast, in the more traditional southern districts (note the abundance of guildsmen occupying certain jobs niches based on religious differences), which comprised 33 percent of the households, marriages between local born males and females reached 50 percent (178 cases). This indicates a higher degree of introversion in this district of the town. On the other hand, immigrant-immigrant marriages were overrepresented in the north. The latter indicates the belated integration of certain layers.
Immigrant-indigenous marriages had no spatial pattern.
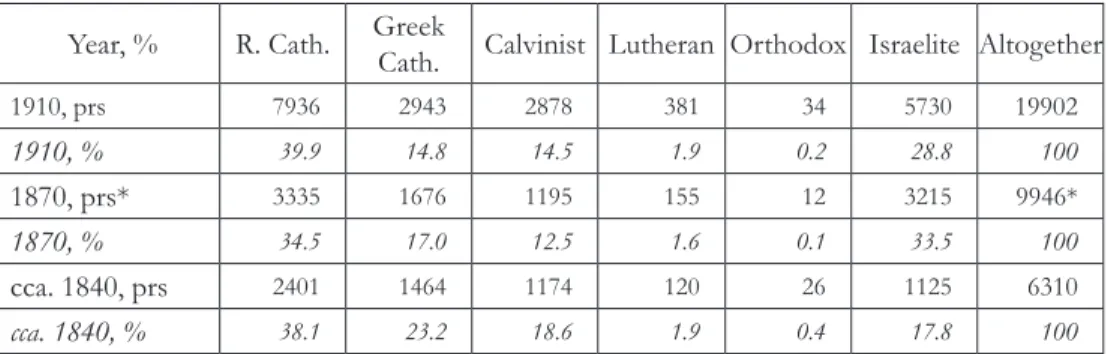
The changes in religious proportions also refer to transformations. The proportion of Calvinists decreased from 18 percent in the 1840s below the country average by 1870,29 while that of the Jews increased from 17 percent to 35 percent (their share among children was even higher, 42 percent in 1870). It fell back to 29 percent by 1910. (The increasing presence of Jews usually indicated industrialization and the emergence and spread of capitalism in Hungary). The proportion of Greek
27 The demographic transition in Hungary began only after the last great cholera epidemics (1873).
28 The proportion of the indigenous population reached 50 percent only together with the children, among whom immigrants were rare.
29 Their representation in the urban and county elite was traditionally higher.
Catholics gradually decreased from 23 percent to 15 percent, which, given their primary occupations (for the most part, they were agrarian wage laborers and low-prestige craftsmen and artisans), also indicates transformations in general (Table 12).
These changes were partly driven by the changes in migration patterns and social strategies and partly by the different birth rates of the different denominations. Our database offers possibilities to estimate the role both of migration and natural growth rate for religious communities, and to reconstruct the social strategies of classes and denominations.
Table 12. The change in proportion of religious denominations in Sátoraljaújhely between 1840 and 1910
Year, % R. Cath. Greek
Cath. Calvinist Lutheran Orthodox Israelite Altogether
1910, prs 7936 2943 2878 381 34 5730 19902
1910, % 39.9 14.8 14.5 1.9 0.2 28.8 100
1870, prs* 3335 1676 1195 155 12 3215 9946*
1870, % 34.5 17.0 12.5 1.6 0.1 33.5 100
cca. 1840, prs 2401 1464 1174 120 26 1125 6310
cca. 1840, % 38.1 23.2 18.6 1.9 0.4 17.8 100
* only 9587 known cases.
It is not surprising that the proportion of immigrants was higher among the cohort of 20-30 year old (over 65%), than among the inhabitants between 50 and 60 years (50%). More interesting conclusions can reached when investigating the subsets of the social classes, occupation groups, and denominations. The proportion of indigenous people exceeded the urban average only among the Jewish family heads (45 percent) and their wives, so the Jewish community must have been the most insular. This is surprising compared to old topoi and their behavior in other towns.30 The growth in numbers was the result of the high internal reproduction rate (an average of 2.4 children/Jewish Wohnparthey) and not of immigration (Table 11).
The decrease in the proportion of Jews in the town after1870 (Table 12) despite the high number of children may indicate that Jews reached the “saturation
30 In the larger city of Debrecen (which at the time only had 2,000 Jewish inhabitants), only 30 percent of the Jews were local-born. Another 20 percent was indigenous in the county, and another 30 percent arrived from the northeast. The average size of the 340 Jewish households indicates larger family sizes (5.5) than the town average, as was also true in Sátoraljaújhely (4.5). See Mazsu, “Inside borders.”
point”: the town as a market did not have a demand for the professions typically practiced by Jews at that stage and pace of development, and this made it less appealing for potential Jewish immigrants and increased competition for the niches among the different factions.31
In contrast, Lutheran family heads were dominantly immigrants. Many of them were foreigners with special skills and occupations who came as experts to meet the demand generated by industrialization, which Hungarian schools were not yet able to cope with. The number of Lutherans in the town tripled between 1840 and 1910, a pace of growth which equaled the average growth rate of the whole town.
The average number of children among them was only 1.8, which means that migration played a larger role than natural growth. (On the other hand, Lutheran family heads were somewhat younger than the average, as were Greek Catholic family heads, and this also explains the low birth rate within their households).
Among the Greek Catholic family heads, the proportion of newcomers was 75 percent, thus the gradual decrease in their share of the total population can be explained by their low birth rate (an average of 1.4/Wohnparthey in 1870) and by religious intermarriages. They were also relatively poorly off from the perspective of their social situation (the proportion of Wohnpartheys with only one room or less was the highest among them). The proportion of indigenous Roman Catholic family heads (compared to local Roman Catholic family heads) was also below the town average. The Calvinists tried to “balance” their bad demographic indicators (an ageing society with less than the average number of children) by relying on immigrants. Regarding the origins of wives and husbands, there was a great difference measured in the case of both Roman Catholics and Calvinists: mainly the men were newcomers, while most of the wives were local born inhabitants (Table 13).
Considering the group of coworkers and employees32 the share of Jews reaching 25 percent was well below their proportion measured among family heads and wives. This means, based on the general character of this social category comprising dominantly craftsmen,33 that among Jews, the significance of traditional guild-industry was of secondary importance. Though after 1848, Jews were allowed to work in guilds, they still tended to take other occupations. The proportion of Calvinists among employees (18 percent) was higher than their share of the total city population (12–13 percent), which implies a more traditional social structure and a strategy differing from that of the Jews. In the case of the Calvinists, employers
31 The Jews in Sátoraljaújhely were divided among traditionalist, modernist, and “status quo ante” factions.
32 Without own home/Wohnparthey, cca 1000 persons.
33 Pharmacists, assistant teachers, waiters, and merchant-assistants were also grouped here.
showed a preference in their selection of employees/coworkers for other Calvinists. This preferential cooperation meant that a Calvinist guildsman was more likely to choose a Calvinist apprentice. This does not imply exclusiveness, however. Calvinists also hired Roman Catholic apprentices. This also meant that the children of lower middle-class Calvinists were more likely to turn to handicrafts than to pursue other occupations, and they were more likely to pursue these crafts than the children of Jews and Lutherans. These differences in strategies based on religion/denomination indicate the persistence of old structures.
Among the social group of servants, the proportion of Greek and Roman Catholics (26 and 41 percent respectively) exceeded their share of the total population, while Calvinists (9 percent) and Jews (15 percent) were underrepresented. This also reflects the different strategies they adopted in the pursuit of a livelihood. Jews, for example, tended to employ non-Jewish immigrants as servants, much as Calvinists tended to employ non-Calvinists.
Among employees and coworkers (without their own Wohnparthey), the proportion of local-born (except for the Jews with their 51 percent) remained under the city average (40 percent) (Table 13). The high share of local-born Jews among employees also indicates an insular society and a strategy differing from that of the Christians. In contrast with Jews, Calvinists preferred immigrants as coworkers and employees. The proportion of Roman Catholics among immigrant employees reached 40 percent (overrepresented compared to the proportion of Roman Catholic family heads and their wives). The share of Calvinists reached 22 percent (also overrepresented, much as Greek Catholics were too, with their 22 percent), while the proportion of Jews in the town remained around 20 percent. In contrast, in the whole set of coworkers and employees (including indigenous and immigrant), Roman and Greek Catholics were underrepresented compared to their share of the total population (24 percent vs. 33 percent of family heads and 11 percent vs. 17 percent of family heads, respectively). This means that the proportion of indigenous Greek Catholic employees was small and also that their proportion was high among servants. In the case of these two denominations, low-prestige fieldwork dominated among immigrant employees (as their geographic location within the town confirmed earlier).
Among the local-born servants and housemaids, Roman Catholics were overrepresented (while among employees they were underrepresented). 85 percent of the servants and housemaids were immigrants, which indicates that the strategy of local- born, lower-class/declassed people aimed to avoid these lines of work by becoming apprentices or coworkers. Among newcomer servants, Greek Catholics comprised 26 percent (a
higher value than their share of the total urban population), while Jews reached only 15 percent (Table 14).
Table 13. The proportion of immigrants among occupational (family head-earners; employees- coworkers; servants and maids) and denominational groups
Family-
heads* Total
persons Local-born
(%) Local-born
(%) Wives Total
persons Local-born
(%) Local-born (%)
Lutheran 41 12.2 0.7 Lutheran 33 27.3 1.1
Gr. Cath. 373 24.4 12.5 Gr. Cath. 309 33.0 12.6
Jew 692 44.5 42.5 Jew 619 47.3 36.2
Orthodox 3 33.3 0.1 Orthodox 5 60.0 0.4
Calvinist 302 35.8 14.9 Calvinist 193 60.6 14.4
R. Cath. 735 28.8 29.2 R. Cath. 552 51.6 35.2
Altogether 2147 33.8 100 Altogether 2147** 37.7 100
Coworkers,
employees Total
persons Local-born
(%) Local-born
(%) Servants,
maids Total
persons Local-born
(%) Local-born (%)
Lutheran 10 20.0 0.8 Lutheran 8 0.0 0.00
Gr. Cath. 109 24.0 10.8 Gr. Cath. 135 9.6 21.6
Jew 146 51.4 31.4 Jew 80 12.5 16.6
Calvinist 110 25.5 11.7 Calvinist 50 10.0 8.3
R. Cath. 212 27.0 23.8 R. Cath. 216 14.4 51.6
Altogether 600 40.0 100 Altogether 520 11.5 100
* Including widows (women) registered as family-heads.
** The difference between the number of Wohnparthey and the partial sums is due to the cca. 200 widows and widowers (10%) divorced and yet not remarried.
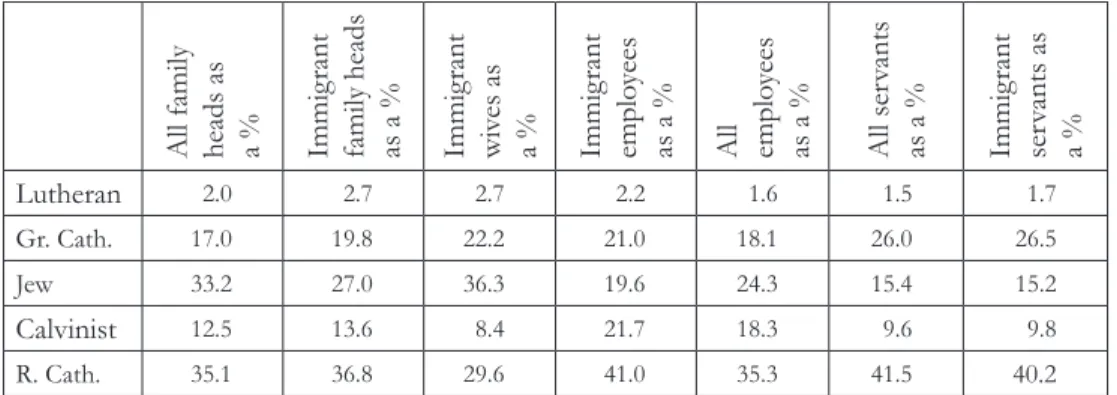
Table 14. The distribution of immigrants (%) based on religion and social groups
All family heads as a % Immigrant
family heads as a % Immigrant wives as a % Immigrant employees as a % All emplo
yees as a % All servants as a % Immigrant servants as a %
Lutheran 2.0 2.7 2.7 2.2 1.6 1.5 1.7
Gr. Cath. 17.0 19.8 22.2 21.0 18.1 26.0 26.5
Jew 33.2 27.0 36.3 19.6 24.3 15.4 15.2
Calvinist 12.5 13.6 8.4 21.7 18.3 9.6 9.8
R. Cath. 35.1 36.8 29.6 41.0 35.3 41.5 40.2
The theoretical aggregated value in columns is 100% - differences are due to lack of data and rounding errors.
Social stratification of immigrants
With regards to the social elite (the methods according to which we have defined this group and identified the people who belonged to it are discussed later), in the case of family heads, 25 percent were born in Sátoraljaújhely. In the case of wives, this figure was a bit higher, 33 percent. This indicates the generally smaller horizontal mobility of women at time. Compared to the figures in the city of Eger, this still indicates an open society.34 Among the lower-class and deprived (for instance agrarian wage laborers and washerwomen, sewers, bread-makers, etc.), the proportion of local-born people was also low, around 30 percent (in the case of their wives, it was 37 percent), while in the case of the middle class (for instance merchants, innkeepers, shopkeepers, and chandlers), the figures were 40 and 48 percent, respectively. In the case of landowners, the proportion of local-born urban dwellers was around 50 percent, and in the case of people earned their livelihoods doing handicrafts, it was similarly high (41–58 percent).
Thus, the latter two occupational groups can be considered the basis of the indigenous middle-class (Table 15).
Table 15. The proportion of local-born husbands and wives in 1870 in Sátoraljaújhely
Group Husband
(persons) Wife
(persons) Husband,
(local) % Wife (local), %
elite, official elite, freelance professions 59 81 25 33
merchants, chandlers 140 166 40 48
artisans, craftsmen 278 396 41 58
poor, lower-class (cartmen, footmen, sewers, rag-
pickers, washerwomen, itinerant merchants, etc.) 156 208 30 36
smallholders and large estate owners 54 57 46 49
The abovementioned “openness” of Sátoraljaújhely (which is a feature of towns which were becoming increasingly industrialized) is indicated by another fact: among the immigrant earners, the share of those who belonged to the elite was higher than among the local-born society (Table 16), in contrast with the situation in Eger.35 In Sátoraljaújhely local-born earners were overrepresented within the middle class, while lower layers were dominated by newcomers. However, the proportion of immigrants working
34 Demeter, “A dualizmus kori Eger.”
35 In Eger, the elite was underrepresented within the immigrant society. In the middle class, artisans were overrepresented, while lower “national” officials (porters, policemen, postmen) were recruited from local-born people.