Contribution of Different Molecules and Moieties to the Surface Tension in Aqueous Surfactant Solutions
György Hantal,
1Marcello Sega,
2George Horvai,
3and Pál Jedlovszky
4*1
Faculty of Physics, University of Vienna, Sensengasse 8/9, A-1090 Vienna, Austria
2
Helmholtz Institute Erlangen-Nürnberg for Renewable Energy (IEK-11) Forschungszentrum Jülich, Fürther Straße 248, D-90429 Nürnberg, Germany
3
Department of Inorganic and Analytical Chemistry, Budapest University of Technology and Economics, Szt. Gellért tér 4, H-1111 Budapest, Hungary
4
Department of Chemistry, Eszterházy Károly University, Leányka utca 6, H- 3300 Eger, Hungary
Running title: Surface Tension Distribution in Surfactant Solutions
*Electronic mail: jedlovszky.pal@uni-eszterhazy.hu
Abstract:
Amphiphilic surfactants are changing the surface tension of solutions by adsorbing at its surface. In general, however, little is known about the actual distribution of the surface tension across the interface, as well as about the extent of the contribution of different moieties to the surface tension. Here, we consider the liquid-vapor interface of the solutions of five different amphiphilic molecules, representative of anionic, cationic and non-ionic (alcoholic) surfactants. We investigate, by means of molecular dynamics simulation, the contribution of various chemical species and moieties to the surface tension distribution in these aqueous solutions at various surface coverages. We find that the headgroups of alcoholic surfactants give a negligible contribution to the surface tension. The opposite is true for ionic surfactants, whose effect depends on their ‘hardness’ within the Hofmeister series, even though there is a large compensation between ions and counterions. In addition, we find that water molecules contribute negatively to the surface tension when they are hydrating the ionic headgroups and counterions, instead of being exposed to the vapor phase.
1. Introduction
Surface tension is a key quantity both in pure interfacial science [!1] and in its industrial applications. From the thermodynamic point of view, surface tension is the surface excess grand potential, and originates from the fact that surface molecules experience an energetically less favorable local environment (due to the lack or loss of attractive interactions from the opposite phase) than the bulk phase ones. Therefore, staying at the surface has a certain energy cost for the molecules. As a consequence, an increase in the surface area requires work to be done on it, and therefore surface tension can simply be regarded as the intensive counterpart of the surface area. Because of the energy cost of the molecules staying at the surface, the system tries to minimize its surface area, and hence surface tension can also be defined through the shrinking force acting on the surface.
The fact that surface tension can be interpreted through molecular properties (i.e., their energy cost for being at the surface or the surface force acting on them) naturally leads to the recognition that the “surface” cannot be imagined as geometrical surface of zero thickness.
This recognition leads to the question how the different molecules staying at the vicinity of the surface contribute to the surface tension in the case of mixtures and solutions. A particularly interesting case in this respect is the liquid-vapor interface of aqueous surfactant solutions. Clearly, amphiphilic surfactants reduce the surface tension of water very efficiently by replacing the surface water molecules and exposing their own apolar groups to the vapor phase. However, the question where the majority of the residual surface tension comes from still remains open. Thus, whether the (low) surface tension of such solutions is dominated by the few water molecules still staying at the liquid surface, or by the surfactant molecules, and in the latter case how the polar and apolar groups contribute to the total surface tension of the system needs to be addressed.
These questions seem to be particularly interesting in the light of our recent results, namely (i) that in neat molecular liquids, the largest part (i.e., at least 80%) of the surface tension comes from the first molecular layer, while the rest comes from the second layer, [!2,3] and (ii) that the immersion depth of the surfactant molecules into the aqueous phase, in terms of molecular layers, depends sensitively on the type of the headgroup, and can be as large as 6-8 molecular layers, at least for ionic surfactants. [!4] In spite of the large number of both experimental [!5-26] and computer simulation studies [!4,27-54] targeting a number of properties of aqueous surfactant solutions, this problem has, to the best of our knowledge, not been addressed yet.
The experimental investigation of this problem is rather difficult, because it would require the selective measurement of the lateral force acting on the surface molecules and groups of different kinds. Computer simulation methods [!55] can provide an alternative way of tackling the problem, since in a computer simulation a suitably chosen model of the system to be studied, validated against real experimental data, is seen at atomistic resolution.
However, calculating the surface tension contributions of the different molecules in a simulation is not a straightforward task, either. Using the so-called mechanical route, the surface tension of a macroscopically planar surface can be defined through the imbalance between the lateral (pL) and normal (pN) components of the pressure tensor as [!1]
pN pL(X) dX
, (1)
where X is the position along the surface normal axis. (Note that if this equation is used in a computer simulation involving periodic boundary conditions, the expression at the right hand side needs to be divided by a factor of 2 in order to take into account both surfaces in the basic box.) It should further be noted that while pN has to be constant along this axis due to the requirement of the mechanical stability of the system, the lateral component of the pressure tensor is strongly position dependent. Therefore, determining how the different atoms contribute to the lateral pressure would readily answer our above questions.
Unfortunately, the pressure tensor components are inherently non-local quantities, and hence localizing their contributions at the atomic sites cannot be done unambiguously. This ambiguity occurs in the calculation of the contribution of an interacting pair of particles, which involves a contour integral along an open path connecting the two particles. [!56]
Fortunately, the result depends only very weakly on the particular choice of the integration contour. Thus, it was shown that the use of several specific integration contours, such as the Irwing-Kirkwood path, connecting the two interacting particles by a straight line, [!57] and the Harasima path, which goes along the two space-fixed in-plane axes [!58] provide comparable lateral pressure profiles with each other. [!59]
In this paper, we investigate how the surface tension is distributed between the water molecules, surfactant tails, surfactant headgroups, and, when present, counterions at the surface of aqueous surfactant solutions. For this purpose, we calculate the lateral pressure contribution of these molecules and groups in molecular dynamics simulations, using the method we proposed previously [!60] employing the Harasima path and particle mesh Ewald
(PME) correction. To investigate the dependence of the results on the length of the apolar tail and type of the headgroup of the surfactant molecules, here we consider five different surfactants. Thus, pentanol (PA), octanol (OA), and dodecanol (DA), all having an alcoholic OH group as the headgroup, differ from each other only in the length of the apolar tail.
Further, besides the non-ionic dodecanol, two ionic surfactants with a dodecyl tail, namely the anionic sodium dodecyl sulfate (SDS) and the cationic dodecyl trimethyl ammonium chloride (DTAC) are also considered. The schematic structure of these surfactants is illustrated in Figure 1. To address also the surface density dependence of the results, each system is investigated at the surfactant surface densities of 1 and 4 mol/m2 (corresponding to a highly unsaturated and to a more or less saturated surface monolayer, respectively). In our previous studies, we already investigated these systems in various other respects. Thus, their molecular level structure [!52] as well as the lateral dynamics [!46] and immersion depth of the surfactants [!4] were analyzed in detail.
The remainder of this paper is organized as follows. In sec. 2 details of the computations performed, including the molecular dynamics simulations and calculation of the lateral pressure profiles are given. The obtained results are discussed in detail in sec. 3.
Finally, in sec. 4, the main conclusions of this study are summarized.
2. Methods
2.1. Molecular Dynamics Simulations. Molecular dynamics simulations of the liquid-vapor interface of the aqueous solutions of five different surfactants, namely the alcoholic PA, OA, and DA, the anionic SDS, and the cationic DTAC have been performed in the canonical (N,V,T) ensemble at the temperature of 298 K. The X, Y, and Z edges of the rectangular basic simulation box have been 265 Å, 62.82 Å, and 62.82 Å, respectively, X being the surface normal axis. The basic box has contained 8000 water molecules in every case. Simulations with 48 and 192 surfactant molecules have been performed for all surfactants. Assuming that all surfactant molecules are indeed located at the liquid surface, these systems correspond to the surface densities of 1 mol/m2 and 4 mol/m2, representing an unsaturated and a more or less saturated monolayer, respectively.
The surfactant molecules and counterions have been described by the GROMOS96 force field, [!61,62] using the charge distribution proposed by Schweighofer and Benjamin for the headgroup of the dodecyl trimethyl ammonium (DTA) ion. [!31] According to this model, the CH2 and CH3 groups have been treated as united atoms. Water molecules have been
modeled by the rigid SPC potential. [!63] In order to check the model dependence of the results, the simulation of the 4 mol/m2 SDS system has been repeated using the KBFF force field [!64] for the Na+ counterions and the SPC/E potential model [!65] for water. According to these potential models, the intermolecular part of the potential energy has been calculated as the sum of the contributions of all molecule pairs, and the interaction energy of a molecule pair has been calculated as the sum of the Lennard-Jones and charge-charge Coulomb contributions of all pairs of their atoms. The interaction parameters of the potential models used are summarized in Table 1 of Ref. [!46]. All interactions have been truncated to zero beyond the group-based cut-off distance of 15.0 Å; the long-range part of the electrostatic interaction has been accounted for by means of the smooth particle mesh Ewald (sPME) method. [!66] Surfactant bond lengths and water molecules have been kept rigid in the simulations using the SHAKE algorithm. [!67] The intramolecular part of the potential energy has consisted of angle bending and torsional rotation terms of the surfactant molecules, the latter being described by the Ryckaert-Bellmans potential function. [!68]
The simulations have been performed using an in-house modified version of the GROMACS 5.1 program package [!69] that calculates also the pressure contribution of each particle. [!70] Equations of motion have been integrated in time steps of 2 fs. The temperature of the systems has been controlled using the Nosé-Hoover thermostat [!71,72] with a time constant of 1.0 ps. To set up the starting configuration of the simulations, we started from previously equilibrated configurations, [!46] which have been doubled in the two lateral directions, resulting in a surface area 4 times as large as in our previous studies, [!4,46,52]
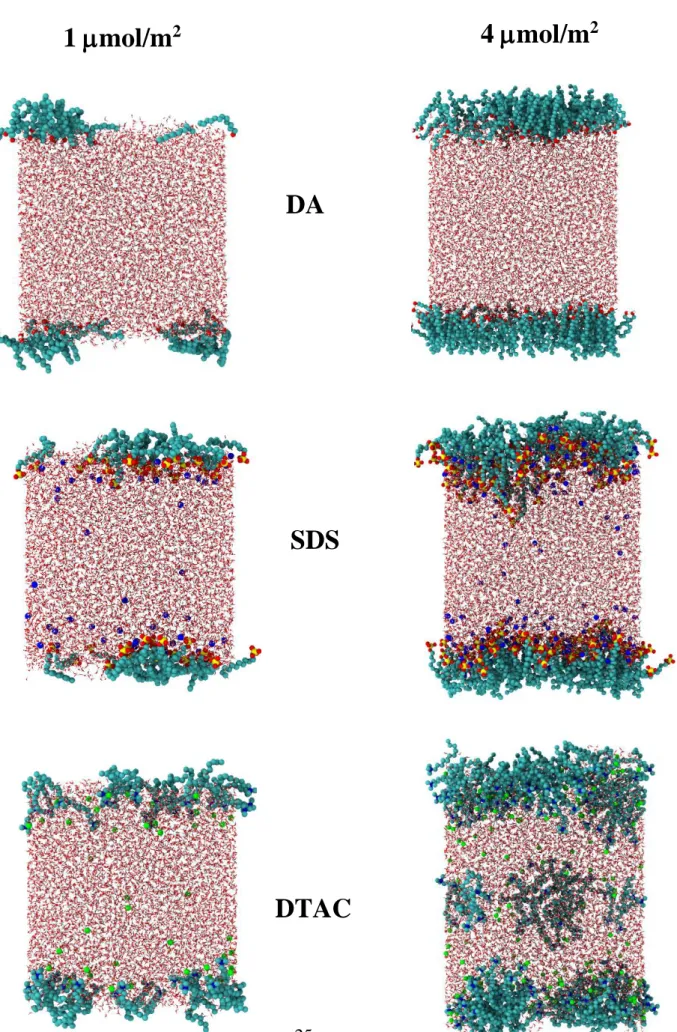
and inserted an additional, 10 Å wide water slab in the middle of the aqueous phase, in order to push the two surfaces farther from each other. The simulated slabs have also been made thicker, by inserting a 15 Å wide water slab in the middle of the liquid phase. After a 20 ns long equilibration period, a 20 ns long production run per system has been performed, during which equilibrium configurations have been saved after every 0.5 ps for the calculation of density and lateral pressure profiles in a post-processing step. All profiles calculated have been averaged not only over the saved configurations, but also over the two interfaces present in the basic box. Equilibrium snapshots of the systems containing DA, SDS, and DTAC are shown in Figure 2.
2.2. Calculation of the Lateral Pressure Profile. The th element of the pressure tensor can be calculated as
ij C
ij i
i i
iv v f s
V m p
ij
1 ( )d
s
r , (2)
where V is the total volume of the system, m and v stand for the mass and velocity of the particles, respectively, indices i and j run over the particles, while and over the two spatial directions parallel with the plane of the surface (as the normal component of the local virial tensor, and thus that of the pressure tensor is not accessible by using the Harasima path), is the Kronecker symbol, the integral is performed over the Cij open path connecting particles i and j, parametrized by the vector s, and the brackets <...> denote ensemble averaging. The first term of eq. 2 represents the kinetic (or ideal gas), while the second term the virial (or excess) contribution to the pressure.
Among the possible integration contours, Cij, the use of the Harasima path has several important advantages. First, in contrast with the Irving-Kirkwood path, it can be used even in such cases when the potential is not fully pairwise additive. [!59] The importance of this point becomes evident considering that the reciprocal space term of the long-range correction of the electrostatic interaction, used both in the full Ewald summation [!55,73,74] and its particle mesh variants [!64,75] introduces a non-pairwise additive term in the potential. It was recently demonstrated how this reciprocal space term can be taken into account in the calculation of the lateral pressure profile both in the case of the original Ewald summation [!59] and in that of PME. [!60] Thus, using the method recently proposed by us, [!60] the virial contribution coming from this correction is distributed between the mesh nodes as
( )
~ ( ) ( )
FFT )
~rec, ( 1 2
m m
m
r
i p B FFT f g
, (3)
where the function B(m) depends on the interpolation scheme employed by the given variant of the PME method, f(m2) and g(m) are suitably chosen functions of the mesh points, m, [!60] rp is the position of the pth mesh node FFT stands for fast Fourier transformation, [!76]
the charge distribution ~ is given as
i
i i p
p W q
h ( )
) 1
~(r r r
, (4)
qi is the charge of atom i, h is the mesh spacing, and W(rp- ri) is a suitably chosen charge assignment function. To obtain its contributions assigned to each of the atoms, this virial contribution has to be interpolated back as
rp
p i i p
i
i r W r r
V
q ~rec, ( ) ( )
rec,
. (5)
Finally, having the lateral pressure been distributed between the atomic sites, its profile can simply be calculated as
L( ) pL (X X Xcom) A
X V
p i
i
i
, (6)where A is the cross-section area of the system, Xi and Xcom stand for the position of the ith atom and that of the center of mass of the liquid slab along the surface normal axis, respectively, and the brackets <…> denote ensemble averaging.
The other advantage of using the Harasima path, namely that this way the lateral pressure contribution of an interacting atom pair is evenly distributed between the two atoms, [!2] is even more important for our purpose. Clearly, this treatment not only offers a computationally very efficient way of calculating the lateral pressure (as it can be treated as if it were an additive property of the atoms), [!2] but provides also a simple way of distributing the contributions of the individual atoms in the system to it, and, through eq. 1, also to the surface tension. The price one has to pay for these advantages when using the Harasima path is that the normal component of the pressure tensor is not available this way. [!56] However, since we are considering only macroscopically flat interfaces, this pressure component is constant along the surface normal axis, and its value is equal to the scalar pressure in the two bulk phases. Therefore, in our case, this theoretical limitation of using the Harasima path has no practical consequences.
3. Results and Discussion
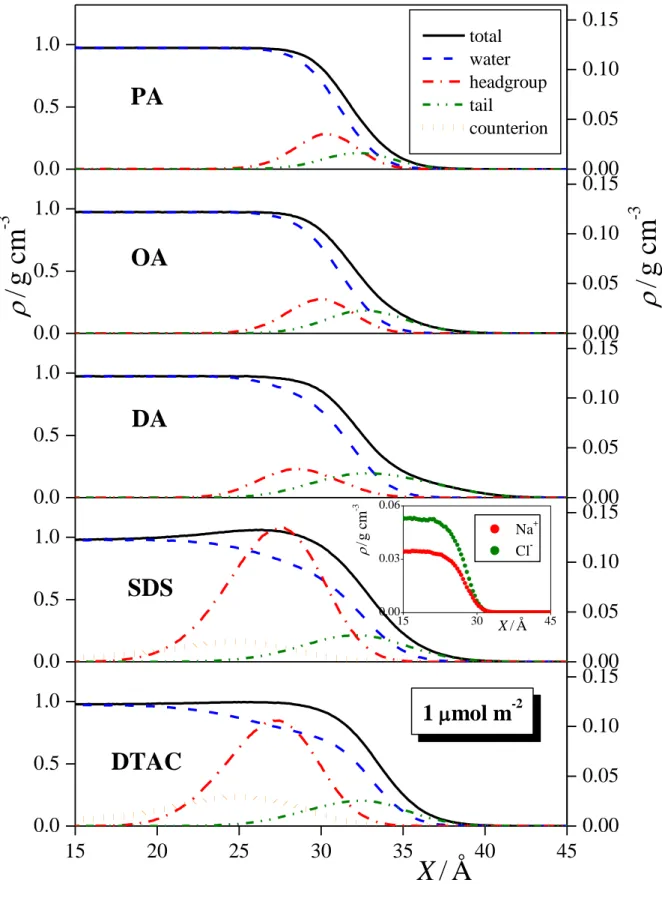
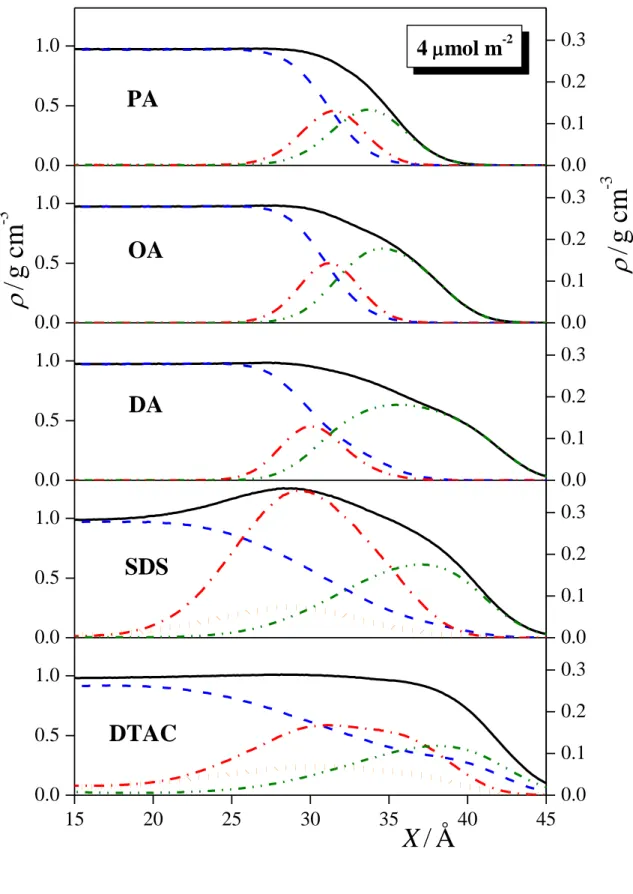
3.3. Density Profiles. The mass density profiles of the entire systems simulated as well as those of the water molecules, surfactant tails and headgroups, and, in the case of ionic surfactants, also those of the counterions along the surface normal axis, X, are shown in Figures 3a and 3b, as obtained in the systems of 1 mol/m2 and 4 mol/m2 surface densities, respectively. The profiles show that, as it is expected, the surfactant molecules indeed stay at the liquid surface, with their polar heads located at the surface portion of the aqueous phase, and their apolar tails pointing to the vapor phase. The only notable exception in this respect is
that, in the 4 mol/m2 DTAC system, the head and tail profiles do not drop to zero but show some residual density even in the bulk aqueous phase, evidencing that a few surfactant molecules have left the surface and dissolved in the bulk aqueous phase. It is also seen that the headgroup density of the ionic surfactants extend into the aqueous phase considerably more than that of the alcoholic surfactants. This is in accordance with our earlier result that ionic surfactants are immersed considerably deeper into the aqueous phase than alcoholic ones. [!4] The distribution of the counterions along the surface normal is much broader than that of the ionic headgroups, and its peak is located somewhat (i.e., about 2 Å) farther from the liquid surface. Further, it is interesting to see that the headgroup density profile of DTAC is located noticeably (about 4 Å) closer to the surface than that of SDS at high surface density.
Correspondingly, the peak of the Cl- counterion density is also found about 3 Å closer to the liquid surface than that of the Na+ counterions in the respective systems. This finding can be well explained by the different surface affinity of different ions. Thus, small ions of high charge density, often called “kosmotropes”, are effectively repelled from the water surface, while larger “chaotropic” ions, corresponding to smaller charge densities, are attached less strongly to their hydration shell, and show higher affinity to the surface, [!77-83] being, in some cases, even adsorbed there. [!77,78,80] In this respect, Na+ is a stronger kosmotrope than Cl-, and hence while Na+ is strongly repelled from the water surface, Cl- is only modestly repelled from there. [!77,78,80] To test the validity of this conclusion, we have also simulated the liquid-vapor interface of the aqueous NaCl solution in such a way that the same number of water molecules as well as Na+ and Cl- ions have been placed in the same basic box as in the 4 mol/m2 SDS and DTAC simulations, resulting in a NaCl solution of roughly 1.5 mol/dm3 concentration. The obtained density profiles (shown in the inset of Fig. 3.a) indeed confirm that Cl- ions indeed approach the liquid surface about 2-3 Å closer that Na+ ions, even in the absence of surfactant ions.
In addition to the somewhat different characters of the two counterions, there is a similar but more marked difference between the ionic headgroups of the corresponding surfactants in this respect. Thus, in accordance with the fact that SO42- is one of the strongest kosmotropic anions, the sulfate headgroup of SDS exposes three O atoms to the surrounding water, and hence its hydration involves the formation of several H-bonds. On the other hand, in the bulky trimethyl ammonium head of DTAC, the positive charge is located on the N atom, being surrounded by CH3 groups, which, besides screening the interaction of the charge with the water dipoles, also form a hydrophobic surface of the headgroups. The fact that the considerably less strongly hydrated DTAC heads are located closer to the water surface than
the very strongly hydrated sulfate heads of SDS is in clear accordance with the known correlation between the strength of the hydration, and surface affinity of simple ions. [!82,83]
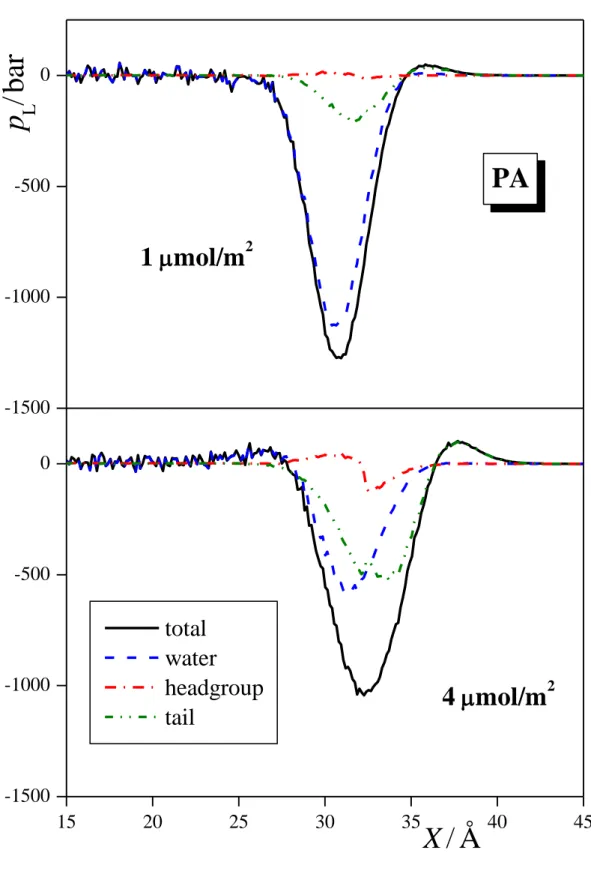
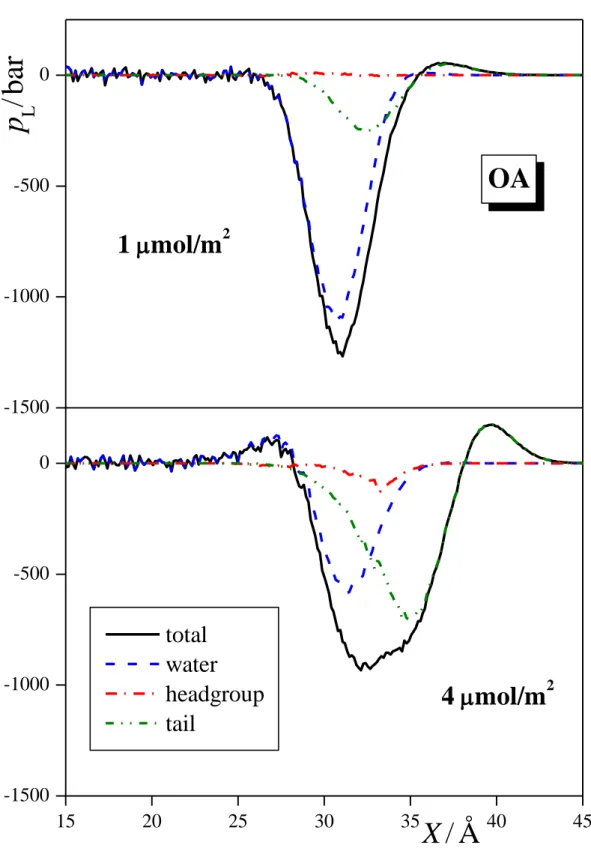
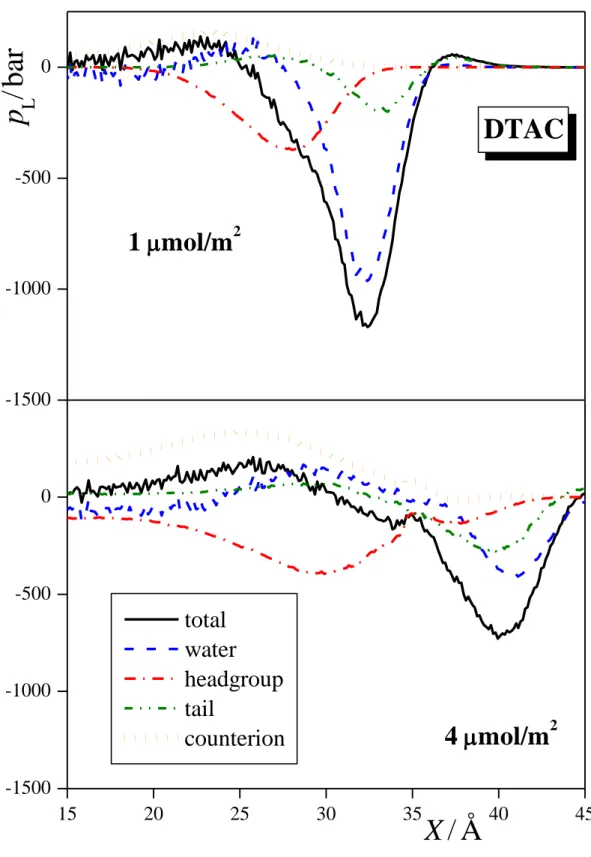
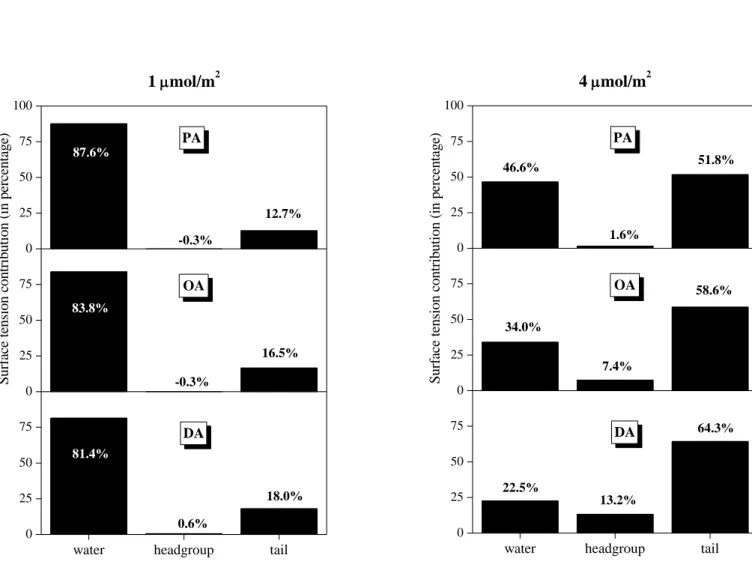
3.2. Lateral Pressure Profiles and Surface Tension Contribution. The lateral pressure profiles along the surface normal axis, X, in the systems simulated, along with their various contributions coming from the water molecules, surfactant headgroups and tails, and, in the case of ionic surfactants, also from the counterions are shown in Figures 4a, 4b, and 4c for the three alcoholic surfactants considered, i.e., PA, OA, and DA, respectively, in Figure 5 for SDS, and in Figure 6 for DTAC. Integration of these profiles according to eq. 1 provides an estimate of the contribution of the various molecules and groups to the total value of the surface tension. These estimated contributions are shown in Figures 7, 8, and 9 for the three alcoholic surfactants, SDS, and DTAC, respectively.
The general picture is rather similar in the case of the three alcoholic surfactants, indicating that the length of the apolar tail has only a minor influence on this behavior. Thus, at 1 mol/m2, the vast majority (i.e., 80-90%) of the surface tension comes from the water molecules, the remaining 10-20% from the apolar tails, while the polar OH groups contribute negligibly to the surface tension. The only noticeable effect of the tail length in this respect is that with increasing tail length the contribution of the tails to the surface tension increases slightly, while that of the water molecules decreases accordingly. Similar, but somewhat larger changes are observed with increasing surface density of the alcoholic surfactants. These changes reflect the fact that both the saturation of the surface and the presence of longer tail alcohols lead to an increasing fraction of the CH2 groups and a decreasing fraction of the water molecules at the liquid surface. It is also seen from Fig. 4 that, similarly to the pressure profile of the entire system, the contributions of both the water molecules and the hydrocarbon tails exhibit one single deep negative peak at the surface, without any marked positive peaks, indicating that staying at the liquid surface is not favorable for any of these components. This simple picture is consistent with our earlier finding that alcoholic surfactants indeed stay at the surface of the aqueous phase, the OH groups being in its first molecular layer, while the tails either lay on the top of it (in unsaturated adsorption layer) or stick out to the vapor phase (in saturated adsorption layer). [!4] The fact that the polar OH groups contribute only negligibly to the surface tension can be well explained by the fact that they can effectively replace water molecules in the lateral hydrogen bonding network in the surface molecular layer of the liquid phase, but, unlike the water molecules, without losing any potential H-bonding partner due to the vicinity of the apolar phase. [!84]
The picture becomes considerably more complicated when the systems containing ionic surfactants are considered. The most striking finding in these systems is certainly the huge contribution of the counterions to the surface tension, reflected in a broad peak in the lateral pressure profile. Further, the sign of this contribution for SDS is the opposite of that for DTAC, stressing the importance of the chemical character in this respect. It is also seen that the sign of the contribution of the ionic headgroups and counterions is the opposite of each other, indicating the strong compensation of the surface tension contribution of the charged species.
In the case of SDS, the counterion contribution is almost as large as the surface tension value itself at 1 mol/m2, and it is almost an order of magnitude larger at 4 mol/m2. Correspondingly, the lateral pressure profile of the sulfate headgroups exhibits a positive peak, representing a negative contribution to the surface tension. The huge surface tension contribution of the Na+ ions is again in accordance with their strong kosmotropic character.
The present results indicate that their location at an average distance of 8-10 Å from the liquid surface still has a noticeable energy cost. The strong enhancement of this effect with increasing surface density is probably related to the increasing competition for the hydrating water molecules with each other as well as with the sulfate headgroups in this region. The fact that the proximity of the sulfate headgroups to the liquid surface corresponds, on the other hand, to a free energy gain (i.e. a negative contribution to the surface tension) is probably related to the enrichment of the counterions in this region.
The lateral pressure profile of the water molecules at 1 mol/m2 exhibits a positive peak in the ion-rich layer, reflecting the strong ion-water interactions occurring here, and a negative peak at the surface region due to the water molecules that are still exposed to the vapor phase. The partial cancellation of these two effects results in a small, roughly 20%
contribution of the water molecules to the surface tension. Upon saturation of the surface, the fraction of the water molecules that are in contact with the vapor phase practically vanishes.
As a consequence, the negative peak of the water lateral pressure profile disappears at 4 mol/m2.
Finally, the lateral pressure profile of the hydrophobic tails, being exposed to the vapor phase, exhibits a small negative peak at the liquid surface, which becomes larger with increasing surface density due to the increasing amount of such tail groups. Interestingly, at 4 mol/m2, this profile also exhibits a small positive peak at the surface region of the aqueous phase, indicating that the immersion of the first 3-4 CH2 groups of these tails to the aqueous
phase, [!4] driven by the fact that sulfate heads are effectively repelled from the surface, represents a slight free energy gain even for the immersed portions of the tail groups. The relatively small amplitude of the peaks of the tail profiles, and the corresponding small contribution of the tails to the surface tension reflects the fact that these apolar groups can participate in much weaker interactions – and hence the lack of these interactions corresponds to only a rather small energy loss – than what occur in the ion rich region beneath the liquid surface between the ionic headgroups, counterions, and water molecules.
Interestingly, a somewhat different overall picture is seen in the case of DTAC. Thus, while the lateral pressure profiles of water and the apolar tails show essentially the same features as in the case of SDS, the behavior of the head and counterion profiles is the opposite of that. Concerning the water profiles, the only notable difference from the case of SDS is that at 4 mol/m2 its positive peak is considerably smaller, and hence the total surface tension contribution of water is positive here. The reason for this is clearly the weaker interaction acting between the water molecules and trimethyl ammonium heads, covered by hydrophobic CH3 groups, than that between the water molecules and oxygen covered sulfate heads. More importantly, contrary to the case of SDS, here the counterion profiles exhibit a broad positive peak. Although the amplitude of this peak is not very large, integration of this profile, due to the broadness of the peak, results in a substantial negative contribution to the surface tension.
The reason for this is probably that Cl- ions are less strongly repelled from the surface than Na+ ions, and the corresponding energy loss is overcompensated by the energy gain coming from the vicinity of the positively charged headgroups. To confirm this conclusion, we have also calculated the lateral pressure profiles of the Na+ and Cl- ions in their 1.5 M (surfactant- free) aqueous solution, and found that Na+ ions exhibit a marked negative, while Cl- ions a positive lateral pressure peak, indicated that Na+ ions contribute positively, while Cl- ions negatively to the total surface tension of their aqueous solution even in the lack of surfactant ions. Finally, the fact that the trimethyl ammonium headgroups have a weaker affinity to water, and hence they are in an energetically not as much favored environment than the oxygen-covered sulfate heads, is reflected in a negative lateral pressure peak, and thus in a positive surface tension contribution.
4. Summary and Conclusions
In this paper, we have analyzed the contribution of the different atoms and groups to the surface tension in various surfactant solutions, corresponding both to unsaturated and
saturated surface coverages, through the calculation of the contribution of these species to the lateral pressure profile of the system. The type of the headgroup plays a much more important role in this respect than the length of the apolar tail. Evidently, as either the length of the apolar tail or the surface coverage increases, more CH2 groups and less water molecules are exposed to the vapor phase, and hence the surface tension contribution of the tails increases, while that of water decreases. In the case of alcoholic surfactants, where the OH headgroup stays in the first molecular layer of the aqueous phase, [!4] replacing surface waters in the lateral hydrogen bonding network without exposing any possible H-bonding direction (i.e., a lone pair or an O-H bond) to the vapor phase, [!84] the surface tension contribution of the OH headgroups turns out to be negligible.
The most important finding of this study is the key role the counterions play in contributing to the surface tension in the case of the ionic surfactants. This role seems to be related to the “hardness” of these ions according to the Hofmeister series, and hence to their surface affinity. On the other hand, there is a strong compensation between the surface tension contribution of the counterions and ionic surfactant heads. In this compensation, the free energy gain of certain ions for being at the surface comes from the vicinity of the oppositely charged ions in the ion-rich layer beneath the liquid surface. Finally, water molecules contribute to the surface tension in these systems in two different ways. Thus, besides the trivial, positive contribution of the surface water molecules that are in contact with the vapor phase, the water molecules hydrating the ionic headgroups and counterions contribute negatively to the surface tension. The balance between these two contributions depends, besides the surface coverage, on the chemical nature of the headgroups and counterions.
It should finally be noted that the main finding of the paper, namely that the large surface contribution of the counterions and ionic heads are mainly governed by the “softness”
(in terms of the Hofmeister series) of the counterions, needs to be further investigated. Thus, besides possible experimental studies, a series of simulations in which the counterion is systematically varied along the alkaline (or halogenide) column of the periodic table would provide a stringent test of the present conclusions. Work in this direction is currently in progress.
Acknowledgements
This work has been supported by the Hungarian NKFIH Foundation under Project Nos. 119732 and 120075, and by the EFOP project “Complex Development of Research
Capacities and Services at the Eszterhazy Karoly University” under project No. EFOP-3.6.1- 16-2016-00001.
References
(1) Rowlinson, J. S.; Widom, B. Molecular Theory of Capillarity; Dover Publications:
Mineola, 2002.
(2) Sega, M.; Fábián, B.; Jedlovszky, P. Layer-by-Layer and Intrinsic Analysis of Molecular and Thermodynamic Properties across Soft Interfaces. J. Chem. Phys.
2015, 143, 114709-1-8.
(3) Sega, M.; Fábián, B.; Horvai, G.; Jedlovszky, P. How Is the Surface Tension of Various Liquids Distributed along the Interface Normal? J. Phys. Chem. C 2016, 120, 27468-27477.
(4) Abrankó-Rideg, N.; Darvas, M.; Horvai, G.; Jedlovszky, P. Immersion Depth of Surfactants at the Free Water Surface: A Computer Simulation and ITIM Analysis Study. J. Phys. Chem. B 2013, 117, 8733-8746.
(5) Lu, J. R.; Simister, E. A.; Lee, E. M.; Thomas; R. K.; Rennie, A. R.; Penfold, J. Direct Determination by Neutron Reflection of the Penetration of Water into Surfactant Layers at the Air/Water Interface. Langmuir 1992, 8, 1837-1844.
(6) Lu, J. R.; Simister, E. A.; Thomas; R. K.; Penfold, J. Structure of an Octadecyltrimethylammonium Bromide Layer at the Air/Water Interface Determined by Neutron Reflection: Systematic Errors in Reflectivity Measurements. J. Phys.
Chem. 1993, 97, 6024-602.
(7) Messmer, M. C.; Conboy, J. C.; Richmond, G. L. Observation of Molecular Ordering at the Liquid-Liquid Interface by Resonant Sum Frequency Generation. J. Am. Chem.
Soc. 1995, 117, 8039-8040.
(8) Conboy, J. C.; Messmer, M. C.; Richmond, G. L. Investigation of Surfactant Conformation and Order at the Liquid−Liquid Interface by Total Internal Reflection Sum-Frequency Vibrational Spectroscopy. J. Phys. Chem. 1996, 100, 7617-7622.
(9) Gragson, D. E.; McCarty, B. M.; Richmond, G. L. Surfactant/Water Interactions at the Air/Water Interface Probed by Vibrational Sum Frequency Generation. J. Phys. Chem.
1996, 100, 14272-14275.
(10) Bain, C. D. Studies of Adsorption at Interfaces by Optical Techniques: Ellipsometry, Second Harmonic Generation and Sum-Frequency Generation. Curr. Opin. Coll.
Interf. Sci. 1998, 3, 287-292.
(11) Li, Z. X.; Dong, C. C.; Thomas, R. K. Neutron Reflectivity Studies of the Surface Excess of Gemini Surfactants at the Air−Water Interface. Langmuir 1999, 15, 4392- 4396.
(12) Stubenrauch, C.; Albouy, P. A.; von Klitzing, R.; Langevin, D. Polymer/Surfactant Complexes at the Water/Air Interface: A Surface Tension and X-ray Reflectivity Study. Langmuir 2000, 16, 3206-3213.
(13) Lu, J. R.; Thomas, R. K.; Penfold, J. Surfactant Layers at the Air/Water Interface:
Structure and Composition. Adv. Coll. Interface Sci. 2000, 84, 143-304.
(14) Benderskii, A. V.; Eisenthal, K. B. Aqueous Solvation Dynamics at the Anionic Surfactant Air/Water Interface. J. Phys. Chem. B. 2001, 105, 6698-6703.
(15) Gilányi, T.; Varga, I.; Mészáros, R. Specific Counterion Effect on the Adsorption of Alkali Decyl Sulfate Surfactants at Air/Solution Interface. Phys. Chem. Chem. Phys.
2004, 6, 4348-4346.
(16) Ma, G.; Allen, H. C. Real-Time Investigation of Lung Surfactant Respreading with Surface Vibrational Spectroscopy. Langmuir 2006, 22, 11267-11274.
(17) Kirsch, M. J.; D’Auria, R.; Brown, M. A.; Tobias, D. J.; Hemminger, J. C.; Ammann, M.; Starr, D. E.; Bluhm, H. The Effect of an Organic Surfactant on the Liquid-Vapor Interface of an Electrolyte Solution. J. Phys. Chem. C. 2007, 111, 13497-13509.
(18) Sloutskin, E.; Sapir, Z.; Bain, C. D.; Lei, Q.; Wilkinson, K. M.; Tamam, L.; Deutsch, M.; Ocko, B. M. Wetting, Mixing, and Phase Transitions in Langmuir-Gibbs Films.
Phys Rev. Letters 2007, 99, 136102-1-4.
(19) Zhang, Z.; Zheng, D.; Guo, Y.; Wang, H. Water Penetration/Accommodation and Phase Behaviour of the Neutral Langmuir Monolayer at the Air/Water Interface Probed with Sum Frequency Generation Vibrational Spectroscopy (SFG-VS). Phys.
Chem. Chem. Phys. 2009, 11, 991-1002.
(20) de Aguiar, H. B.; Scheu, R.; Jena, K. C.; de Beer, A. G. F.; Roke, S. Comparison of Scattering and Reflection SFG: A Question of Phase-Matching. Phys. Chem. Chem.
Phys. 2012, 14, 6826-6832.
(21) Angus-Smyth, A.; Campbell, R. A.; Bain, C. D. Dynamic Adsorption of Weakly Interacting Polymer/Surfactant Mixtures at the Air/Water Interface. Langmuir 2012, 28, 12479-12492.
(22) Gong, H.; Xu, G.; Liu, T.; Xu, L.; Zhai, X.; Zhang, J.; Lv, X. Aggregation Behaviors of PEO-PPO-ph-PPO-PEO and PPO-PEO-ph-PEO-PPO at an Air/Water Interface:
Experimental Study and Molecular Dynamics Simulation. Langmuir 2012, 28, 13590- 13600.
(23) Scheu, R.; Chen, Y.; de Aguiar, H. B.; Rankin, B. M.; Ben-Amotz, D.; Roke, S.
Specific Ion Effects in Amphiphile Hydration and Interface Stabilization, J. Am.
Chem. Soc. 2014, 136, 2040–2047.
(24) Phan, C. M.; Nguyen, C. V.; Yusa, S.; Yamada, N. L. Synergistic Adsorption of MIBC/CTAB Mixture at the Air/Water Interface and Applicability of Gibbs Adsorption Equation. Langmuir 2014, 30, 5790–5796.
(25) Shahir, A. A.; Arabadzhieva, D.; Petkova, H.; Karakashev, S. I.; Nguyen, A. V.;
Mileva, E. Effect of Under-Monolayer Adsorption on Foamability, Rheological Characteristics, and Dynamic Behavior of Fluid Interfaces: Experimental Evidence for the Guggenheim Extended Interface Model. J. Phys. Chem. C. 2017, 121, 11472–
11487.
(26) Shahir, A. A.; Nguyen, K. T.; Nguyen, A. V. A Sum-Frequency Generation Spectroscopic Study of the Gibbs Analysis Paradox: Monolayer or Sub-Monolayer Adsorption? Phys. Chem. Chem. Phys. 2016, 18, 8794-8805.
(27) Böcker, J.; Schlenkirch, M.; Bopp, P.; Brickmann, J. Molecular Dynamics Simulation of a n-Hexadecyltrimethylammonium Chloride Monolayer. J. Phys. Chem. 1992, 96, 9915-9922.
(28) Tarek, M.; Tobias, D. J.; Klein, M. L. Molecular Dynamics Simulation of Tetradecyltrimethylammonium Bromide Monolayers at the Air/Water Interface. J.
Phys. Chem. 1995, 99, 1393-1402.
(29) Schweighofer, K.; Essman, U.; Berkowitz, M. Simulation of Sodium Dodecyl Sulfate at the Water-Vapor and Water-Carbon Tetrachloride Interfaces at Low Surface Coverage. J. Phys. Chem. B 1997, 101, 3793-3799.
(30) Schweighofer, K.; Essman, U.; Berkowitz, M. Structure and Dynamics of Water in the Presence of Charged Surfactant Monolayers at the Water-CCl4 Interface. A Molecular Dynamics Study. J. Phys. Chem. B 1997, 101, 10775-10780.
(31) Schweighofer, K.; Benjamin, I. Transfer of a Tetramethylammonium Ion across the Water−Nitrobenzene Interface: Potential of Mean Force and Nonequilibrium Dynamics. J. Phys. Chem. A 1999, 103, 10274-10279.
(32) Domínguez, H.; Berkowitz, M. Computer Simulations of Sodium Dodecyl Sulfate at Liquid/Liquid and Liquid/Vapor Interfaces. J. Phys. Chem. B 2000, 104, 5302-5308.
(33) Domínguez, H. Computer Simulations of Surfactant Mixtures at the Liquid/Liquid Interface. J. Phys. Chem. B 2002, 106, 5915-5924.
(34) Jedlovszky, P.; Varga, I.; Gilányi, T. Adsorption of 1-Octanol at the Free Water Surface as Studied By Monte Carlo Simulation. J. Chem. Phys. 2004, 120, 11839- 11851.
(35) Domínguez, H. Computer Simulation Studies of Surfactant Monolayer Mixtures at the Water/Oil Interface: Charge Distribution Effects. J. Coll. Interf. Sci. 2004, 274, 665- 672.
(36) Paszternák, A.; Kiss, É.; Jedlovszky, P. Structure of the nonionic Surfactant Triethoxy Monooctylether C8E3 Adsorbed at the Free Water Surface, As Seen from Surface Tension Measurements and Monte Carlo Simulations. J. Chem. Phys. 2005, 122, 124704.
(37) Domínguez, H.; Rivera, M. Mixtures of Sodium Dodecyl Sulfate/Dodecanol at the Air/Water Interface by Computer Simulations. Langmuir 2005, 21, 7257-7262.
(38) Rodriguez, J.; Clavero, E.; Laria, D. Computer Simulations of Catanionic Surfactants Adsorbed at Air/Water Interfaces. J. Phys. Chem. B. 2005, 109, 24427-24433.
(39) Chanda, J.; Bandyopadhyay, S. Molecular Dynamics Study of Surfactant Monolayers Adsorbed at the Oil/Water and Air/Water Interfaces. J. Phys. Chem. B. 2006, 110, 23482-23488.
(40) Hantal, Gy.; Pártay, L. B.; Varga, I.; Jedlovszky, P.; Gilányi, T. Counterion and Surface Density Dependence of the Adsorption Layer of Ionic Surfactants at the Vapor-Aqueous Solution Interface: A Computer Simulation Study. J. Phys. Chem. B.
2007, 111, 1769-1774.
(41) Darvas, M.; Gilányi, T.; Jedlovszky, P. Adsorption of Poly(ethylene oxide) at the Free Water Surface. A Computer Simulation Study. J. Phys. Chem. B. 2010, 114, 10995- 11001.
(42) Martínez, H.; Chacón, E.; Tarazona, P.; Bresme, F. The Intrinsic Interfacial Structure of Ionic Surfactant Monolayers at Water-Oil and Water-Vapour Interfaces. Proc. R.
Soc. A 2011, 467, 1939-1958.
(43) Bresme, F.; Chacón, E.; Martínez, H.; Tarazona, P. Adhesive Transitions in Newton Black Films: A Computer Simulation Study. J. Chem. Phys. 2011, 134, 214701-1-12.
(44) Darvas, M.; Gilányi, T.; Jedlovszky, P. Competitive Adsorption of Surfactants and Polymers at the Free Water Surface. A Computer Simulation Study of the Sodium Dodecyl Sulfate-Poly(ethylene oxide) System. J. Phys. Chem. B. 2011, 115, 933-944.
(45) Pang, J.; Wang, Y.; Xu, G.; Han, T. Molecular Dynamics Simulation of SDS, DTAB, and C12E8 Monolayers Adsorbed at the Air/Water Surface in the Presence of DSEP. J.
Phys. Chem. B. 2011, 115, 2518-2526.
(46) Rideg, N. A.; Darvas, M.; Varga, I.; Jedlovszky, P. Lateral Dynamics of Surfactants at the Free Water Surface. A Computer Simulation Study. Langmuir 2012, 28, 14944- 14953.
(47) Vacha, R.; Roke, S. Sodium Dodecyl Sulfate at Water–Hydrophobic Interfaces: A Simulation Study. J. Phys. Chem. B. 2012, 116, 11936-11942.
(48) Chen, M.; Lu, X.; Liu, X.; Hou, Q.; Zhu, Y.; Zhou, H. Specific Counterion Effects on the Atomistic Structure and Capillary-Waves Fluctuation of the Water/Vapor Interface Covered by Sodium Dodecyl Sulfate. J. Phys. Chem. C 2014, 118, 19205–19213.
(49) Chen, M.; Lu, X.; Liu, X.; Hou, Q.; Zhu, Y.; Zhou, H. Temperature-Dependent Phase Transition and Desorption Free Energy of Sodium Dodecyl Sulfate at the Water/Vapor Interface: Approaches from Molecular Dynamics Simulations. Langmuir, 2014, 30, 10600–10607.
(50) Tesei, G.; Paradossi, G.; Chiessi, E. Influence of Surface Concentration on Poly(vinyl alcohol) Behavior at the Water–Vacuum Interface: A Molecular Dynamics Simulation Study. J. Phys. Chem. B 2014, 118, 6946–6955.
(51) Bernardino, K.; de Moura, A. F. Surface Electrostatic Potential and Water Orientation in the presence of Sodium Octanoate Dilute Monolayers Studied by Means of Molecular Dynamics Simulations. Langmuir 2015, 31, 10995–11004.
(52) Abrankó-Rideg, N.; Horvai, G.; Jedlovszky, P. Structure of the Adsorption Layer of Various Ionic and Non-Ionic Surfactants at the Free Water Surface, As Seen from Computer Simulation and ITIM Analysis. J. Mol. Liquids 2015, 205, 9-15.
(53) Chong, L.; Lai, Y.; Gray, M.; Soong, Y.; Shi, F.; Duan, Y. Molecular Dynamics Study of the Bulk and Interface Properties of Frother and Oil with Saltwater and Air. J. Phys.
Chem. B 2017, 121, 2788–2796.
(54) Sresht, V.; Lewandowski, E. P.; Blankschtein, D.; Jusufi, A. Combined Molecular Dynamics Simulation–Molecular-Thermodynamic Theory Framework for Predicting Surface Tensions. Langmuir 2017, 33, 8319–8329.
(55) Allen, M. P.; Tildesley, D. J. Computer Simulation of Liquids; Clarendon Press:
Oxford, 1987.
(56) Schofield, P.; Henderson, J. R. Statistical Mechanics of Inhomogeneous Fluids. Proc.
R. Soc. Lond. A 1982, 379, 231-246.
(57) Irving, J. H.; Kirkwood, J. G. The Statistical Mechanical Theory of Transport Processes. IV. The Equations of Hydrodynamics. J. Chem. Phys. 1950, 18, 817-829.
(58) Harasima, A. Molecular Theory of Surface Tension. Adv. Chem. Phys. 1958, 1, 203- 237.
(59) Sonne, J.; Hansen, F. Y.; Peters, G. H. Methodological Problems in Pressure Profile Calculations for Lipid Bilayers. J. Chem. Phys. 2005, 122, 124903-1-9.
(60) Sega, M.; Fábián, B.; Jedlovszky, P. Pressure Profile Calculation with Particle Mesh Ewald Methods. J. Chem. Theory Comput. 2016, 12, 4509-4515.
(61) Schuler, L. D.; Daura, X.; van Gunsteren, W. F. An Improved GROMOS96 Force Field for Aliphatic Hydrocarbons in the Condensed Phase. J. Comp. Chem. 2001, 22, 1205-1218.
(62) van Gunsteren, W. F.; Billeter, S. R.; Eising, A. A.; Hünenberger, P. H.; Krüger, P.;
Mark, A. E.; Scott, W. R. P.; Tironi, I. G. Biomolecular Simulation: The GROMOS96 Manual and User Guide; vdf Hochschulverlag A.G. an der ETH Zürich and BIOMOS b.v.: Zürich, Groningen, 1996.
(63) Berendsen, H. J. C.; Postma, J. P. M.; van Gunsteren, W. F.; Hermans, J. Interaction Models for Water in Relation to Protein Hydration. In Intermolecular Forces;
Pullman, B., Ed.; Reidel: Dordrecht, 1981, p. 331-342.
(64) Weerasinghe, S.; Smith, P. E. A Kirkwood–Buff Derived Force Field for Sodium Chloride in Water, J. Chem. Phys. 2003, 119, 11342-11349.
(65) Berendsen, H. J. C.; Grigera, J. R.; Straatsma, T. The Missing Term in Effective pair Potentials. J. Phys. Chem. 1987, 91, 6269-6271.
(66) Essman, U.; Perera, L.; Berkowitz, M. L.; Darden, T.; Lee, H.; Pedersen, L. G. A Smooth Particle Mesh Ewald Method. J. Chem. Phys. 1995, 103, 8577-8594.
(67) Ryckaert, J. P.; Ciccotti, G.; Berendsen, H. J. C. Numerical Integration of the Cartesian Equations of Motion of a System With Constraints; Molecular Dynamics of n-Alkanes. J. Comp. Phys. 1977, 23, 327–341.
(68) Ryckaert, J. P.; Bellemans, A. Molecular Dynamics of Liquid Alkanes. Faraday Discuss. Chem. Soc. 1978, 66, 95-106.
(69) Pronk, S.; Páll, S.; Schulz, R.; Larsson, P.; Bjelkmar, P.; Apostolov, R.; Shirts, M. R.;
Smith, J. C.; Kasson, P. M.; van der Spoel; D., et al. GROMACS 4.5: A High- Throughput and Highly Parallel Open Source Molecular Simulation Toolkit.
Bioinformatics 2013, 29, 845–854.
(70) The code is freely available at https://github.com/Marcello-Sega/gromacs/tree/virial/.
(71) Nosé, S. A Molecular Dynamics Method for Simulations in the Canonical Ensemble.
Mol. Phys. 1984, 52, 255-268.
(72) Hoover, W. G. Canonical Dynamics: Equilibrium Phase-Space Distributions. Phys.
Rev. A 1985, 31, 1695-1697.
(73) Ewald, P. Die Berechnung Optischer und Elektrostatischer Gitterpotentiale. Ann.
Phys. 1921, 369, 253–287.
(74) de Leeuw, S. W.; Perram, J. W.; Smith, E. R. Simulation of Electrostatic Systems in Periodic Boundary Conditions. I. Lattice Sums and Dielectric Constants. Proc. R. Soc.
Lond. A 1980, 373, 27-56.
(75) Darden, T.; York, D.; Pedersen, L. Particle Mesh Ewald: An N·log(N) Method for Ewald Sums in Large Systems. J. Chem. Phys. 1993, 98, 10089-10092.
(76) Cooley, J. W.; Tukey, J. W. An Algorithm for the Machine Calculation of Complex Fourier Series. Math. Comput. 1965, 19, 297-301.
(77) Jungwirth, P.; Tobias, D. J. Molecular Structure of Salt Solutions: A New View of the Interface with Implications for Heterogeneous Atmospheric Chemistry. J. Phys.
Chem. B. 2001, 105, 10468-10472
(78) Vrbka, L.; Mucha, M.; Minofar, B.; Jungwirth, P.; Brown, E. C.; Tobias, D. J.
Propensity of Soft Ions for the Air/Water Interface. Curr. Opin. Coll. Interface Sci.
2004, 9, 67-73.
(79) Boström, M.; Kunz, W.; Ninham, B. W. Hofmeister Effects in Surface Tension of Aqueous Electrolyte Solution. Langmuir 2005, 21, 2619-2623.
(80) Jungwirth, P.; Tobias, D. J. Specific Ion Effects at the Air/Water Interface. Chem. Rev.
2006, 106, 1259-1281.
(81) Pegram, L. M.; Record, M. T. Jr. Hofmeister Salt Effects on Surface Tension Arise from Partitioning of Anions and Cations between Bulk Water and the Air-Water Interface. J. Phys. Chem. B. 2007, 111, 5411-5417.
(82) dos Santos, A. P.; Diehl, A.; Levin, Y. Surface Tensions, Surface Potentials, and the Hofmeister Series of Electrolyte Solutions Langmuir 2010, 26, 10778-10783.
(83) dos Santos, A. P.; Levin, Y. Surface and Interfacial Tensions of Hofmeister Electrolytes. Faraday Discuss. 2013, 160, 75-87.
(84) Pártay, L. B.; Jedlovszky, P.; Vincze, Á.; Horvai, G. Properties of Free Surface of Water-Methanol Mixtures. Analysis of the Truly Interfacial Molecular Layer in Computer Simulation. J. Phys. Chem. B. 2008, 112, 5428-5438.
Figure legends
Figure 1. Schematic structure of the five surfactants considered.
Figure 2. Equilibrium snapshot of the systems containing DA (top row), SDS (middle row), and DTAC (bottom row) at the surface densities of 1 mol/m2 (left column) and 4 mol/m2 (right column). CH3 groups, O, S, N, H atoms, Cl-, and Na+ ions are shown by turquoise, red, yellow, indigo, grey, green, and blue colors, respectively. For clarity, water molecules are represented only by sticks.
Figure 3. Mass density profiles across the systems simulated (black solid lines) as well as that of the water molecules (blue dashed lines), surfactant headgroups (red dash-dotted lines) and tails (green dash-dot-dotted lines), and counterions (orange dotted lines) in the systems containing PA (top panels), OA (second panels), DA (third panels), SDS (fourth panels), and DTAC (bottom panels) at the surface densities of (a) 1 mol/m2 and (b) 4 mol/m2. The inset shows the density profiles of the Na+ (red) and Cl- (green) ions at the surface of a 1.5 M NaCl solution (see the text). All profiles are averaged over the two liquid surfaces in the basic box. The scales at the right side refer to the densities of the headgroups and counterions.
Figure 4. Lateral pressure profile across the systems containing (a) PA, (b) OA, and (c) DA (black solid lines) at the surface densities of 1 mol/m2 (top panels) and 4 mol/m2 (bottom panels). The contributions given by the water molecules (blue dashed lines), surfactant headgroups (red dash- dotted lines) and tails (green dash-dot-dotted lines) to these profiles are also shown. All profiles are averaged over the two liquid surfaces in the basic box.
Figure 5. Lateral pressure profile across the systems containing SDS (black solid lines) at the surface densities of 1 mol/m2 (top panel) and 4 mol/m2 (bottom panel). The contributions given by the water molecules (blue dashed lines), surfactant headgroups (red dash-dotted lines) and tails (green dash-dot-dotted lines), and counterions (orange dotted lines) to these profiles are also shown.
Open circles, with the same color coding, correspond to the results obtained with the KBFF force field of the Na+ counterions [!64] and SPC/E model [!65] of water. All profiles are averaged over the two liquid surfaces in the basic box.
Figure 6. Lateral pressure profile across the systems containing DTAC (black solid lines) at the surface densities of 1 mol/m2 (top panel) and 4 mol/m2 (bottom panel). The contributions given by the water molecules (blue dashed lines), surfactant headgroups (red dash-dotted lines) and tails (green dash-dot-dotted lines), and counterions (orange dotted lines) to these profiles are also shown.
All profiles are averaged over the two liquid surfaces in the basic box.
Figure 7. Estimated contribution (in percentage) of the water molecules as well as the OH headgroups and alkyl tails of the alcoholic surfactants to the total surface tension in the systems containing PA (top panels), OA (middle panels), and DA (bottom panels) at the surface densities of 1 mol/m2 (left) and 4 mol/m2 (right).
Figure 8. Estimated contribution (in percentage) of the water molecules, surfactant headgroups and alkyl tails, and counterions to the total surface tension in the systems containing SDS at the surface densities of 1 mol/m2 (left) and 4 mol/m2 (right).
Figure 9. Estimated contribution (in percentage) of the water molecules, surfactant headgroups and alkyl tails, and counterions to the total surface tension in the systems containing DTAC at the surface densities of 1 mol/m2 (left) and 4 mol/m2 (right).
Figure 1 Hantal et al.
. PA
OA
DA
SDS
DTAC
Figure 2 Hantal et al.
DA
SDS
DTAC
1 mol/m
24 mol/m
2Figure 3a Hantal et al.
15 20 25 30 35 40 45
0.0 0.5 1.0 0.0 0.5 1.0 0.0 0.5 1.0 0.0 0.5 1.0 0.0 0.5 1.0
0.00 0.05 0.10 0.150.00 0.05 0.10 0.150.00 0.05 0.10 0.150.00 0.05 0.10 0.150.00 0.05 0.10 0.15
15 30 45
0.00 0.03 0.06
1
mol m
-2 / g c m
-3total water headgroup tail
counterion
DTAC
/ g c m
-3X / Å
SDS DA OA PA
Na+ Cl-
/g cm-3
X/Å
Figure 3b Hantal et al.
15 20 25 30 35 40 45
0.0 0.5 1.0 0.0 0.5 1.0 0.0 0.5 1.0 0.0 0.5 1.0 0.0 0.5 1.0
0.0 0.1 0.2 0.3 0.0 0.1 0.2 0.3 0.0 0.1 0.2 0.3 0.0 0.1 0.2 0.3 0.0 0.1 0.2 0.3
/ g c m
-34
mol m
-2DTAC
/ g c m
-3X / Å
SDS
DA
OA
PA
Figure 4a Hantal et al.
15 20 25 30 35 40 45
-1500 -1000 -500 0 -1500 -1000 -500 0
p
L/ bar
4 mol/m
2PA
X / Å
total water headgroup tail
1 mol/m
2Figure 4b Hantal et al.
15 20 25 30 35 40 45
-1500 -1000 -500 0 -1500 -1000 -500 0
p
L/ bar
4 mol/m
2OA
X / Å
total water headgroup tail
1 mol/m
2Figure 4c Hantal et al.
15 20 25 30 35 40 45
-1500 -1000 -500 0 -1500 -1000 -500 0
4 mol/m
2DA
X / Å
total water headgroup tail
p
L/ bar
1 mol/m
2Figure 5 Hantal et al.
15 20 25 30 35 40 45
-1500 -1000 -500 0 500 -1500 -1000 -500 0
p
L/ b ar
4 mol/m
2SDS
X / Å
total water headgroup tail
counterion
1 mol/m
2Figure 6 Hantal et al.
15 20 25 30 35 40 45
-1500 -1000 -500 0 -1500 -1000 -500 0
p
L/ b ar
4 mol/m
2DTAC
X / Å
total water headgroup tail
counterion
1 mol/m
2Figure 7 Hantal et al.
0 25 50 75 0 25 50 75 100
water headgroup tail
0 25 50 75
81.4%
0.6%
18.0%
DA 1 mol/m2
Surface tension contribution (in percentage)
83.8%
-0.3%
OA 87.6%
16.5%
12.7%
-0.3%
PA
0 25 50 75 0 25 50 75 100
water headgroup tail
0 25 50 75
22.5%
13.2%
64.3%
DA 4 mol/m2
Surface tension contribution (in percentage)
34.0%
7.4%
OA 46.6%
58.6%
51.8%
1.6%
PA
Figure 8 Hantal et al.
-50 -25 0 25 50 75 100
water headgroup tail counterion -500
-250 0 250 500 750
-438% -262%
40%
760%
4 mol/m2
SDS
S u rf ac e t en si o n c o n tr ib u ti o n ( in p er ce n ta g e)
95.0%
10.7%
21.4%
-27.1%
1 mol/m2
Figure 9 Hantal et al.
-50 -25 0 25 50 75 100
water headgroup tail counterion -250
-125 0 125 250
68%
5%
267%
-240%
4 mol/m2
DTAC
S u rf ac e t en si o n c o n tr ib u ti o n ( in p er ce n ta g e)
-40.2%
6.7%
82.3% 51.2%
1 mol/m2
TOC Graphic:
H2O head tail counterion -500
0 500
Contribution to (%)