Contribution of Different Molecules and Moieties to the Surface Tension in Aqueous Surfactant Solutions. 2. Role
of the Size and Charge Sign of the Counterions
György Hantal,
1,2Marcello Sega,
3George Horvai,
4and Pál Jedlovszky
2*1
Institute of Physics and Materials Science, University of Natural Resources and Life Sciences, Peter Jordan Straße 82, A-1190 Vienna, Austria
2
Department of Chemistry, Eszterházy Károly University, Leányka utca 6, H- 3300 Eger, Hungary
3
Forschungszentrum Jülich GmbH, Helmholtz Institute Erlangen-Nürnberg for Renewable Energy (IEK-11), Fürther Straße 248, D-90429 Nürnberg, Germany
4
Department of Inorganic and Analytical Chemistry, Budapest University of Technology and Economics, Szt. Gellért tér 4, H-1111 Budapest, Hungary
Running title: Surface Tension Contribution in Surfactant Solutions
*Electronic mail: jedlovszky.pal@uni-eszterhazy.hu
Abstract:
Understanding the role of the counterion species in surfactant solutions is a complicated task, made harder by the fact that, experimentally, it is not possible to vary independently bulk and surface quantities. Here, we perform molecular dynamics simulations at constant surface coverage of the liquid/vapor interface of lithium, sodium, potassium, rubidium, and cesium dodecyl sulfate aqueous solutions. We investigate the effect of the counterion type and charge sign on the surface tension of the solution, analyzing the contribution of different species and moieties to the lateral pressure profile. The observed trends are qualitatively compatible with the Hofmeister series, with the notable exception of sodium. We point out a possible shortcoming of what is at the moment, in our experience, the most realistic non-polarizable force field (CHARMM36) that includes the parametrization for the whole series of alkali counterions. In the artificial system where the counterion and surfactant charges are inverted in sign, the counterions become considerably harder. This charge inversion changes considerably the surface tension contributions of the counterions, surfactant headgroups and water molecules, stressing the key role of the hardness of the counterions in this respect. However, the hydration free energy gain of the counterions, occurring upon charge inversion, is compensated by the concomitant free energy loss of the headgroups and water molecules, leading to negligible change in the surface tension of the entire system.
1. Introduction
Surface tension, the intensive counterpart of the surface area, is a key quantity both in fundamental interfacial science and in its numerous applications. From a molecular perspective, the origin of the surface tension is the free energy loss that particles experience at the vicinity of the surface (due to the lack or loss of attractive interaction from the opposite phase) with respect to the bulk phase. Because of this free energy loss, a net force pointing towards the bulk phase is acting on the surface particles, leading to the minimization of the surface area of the system in equilibrium. As a consequence of this shrinking force, the lateral pressure at the vicinity of the surface is lower than the bulk phase pressure. Hence, the difference of the lateral (pL) and normal (pN) pressure components (the latter being constant along the surface normal due to the requirement of mechanical stability) is related to the surface tension as [!1]
pN pL(X) dX
, (1)
where X stands for the position along the surface normal axis. It should be emphasized that in the two bulk phases pN = pL, thus, the above integrand is different from zero only in the interfacial region.
The notion that the surface tension originates from the free energy loss of the individual molecules at the vicinity of the surface naturally gives rise to the question how the different molecules contribute to the surface tension. According to eq. 1, this question could be addressed by determining the contribution of the molecules to the lateral pressure.
Experimental investigation of the problem seems to be rather difficult, as it would require measurement of the lateral pressure with angstrom resolution at the vicinity of the surface. In this respect, computer simulation methods [!2] offer a viable alternative, as in a computer simulation a suitably chosen model of the system to be investigated is seen at atomistic detail.
On the other hand, the validity of the model employed needs to be tested against experimental data.
The calculation of the lateral pressure profile in a computer simulation is, however, also hindered by several difficulties. These difficulties are related to the requirement of localizing the pressure, which is an inherently non-local quantity. Mathematically, this problem occurs as the contribution of an interacting pair of particles to the lateral pressure involves a contour integral along an open path connecting these particles, [!3] the value of
which evidently depends on the particular choice of the path. Fortunately, as it has been shown several times, this dependence is rather weak, and simple integration contours (such as the Irving-Kirkwood path, which connects the particles by a straight line, [!4] and the Harasima path, which involves two perpendicular space-fixed in-plane axes [!5]) result in comparable lateral pressure profiles. [!6,7] Recently, we proposed a computationally very efficient way of calculating the lateral pressure profile, which employs the Harasima path, takes also into account the contribution of the long range part of the electrostatic interaction as determined by the smooth particle mesh Ewald (sPME) method, [!8] and assigns the lateral pressure contributions to the individual particles. [!7] This method opened the possibility of meaningfully addressing the question how various molecules contribute to the surface tension.
The method has been applied, among others, to the liquid-vapor interface of the Lennard- Jones fluid [!9] and various molecular liquids, [!10] revealing that in such systems at least 80% of the surface tension comes from the first molecular layer, [!9,10] and to various water- organic liquid-liquid interfaces, leading to the result that the organic phase might even give a negative contribution to the interfacial tension. [!11]
A particularly interesting system in this respect is the liquid-vapor interface of aqueous surfactant solutions. Although such systems have been intensively studied in the past decades by various experimental, [!12-33] computer simulation, [!33-54] and theoretical methods, [!55-66] the issue of the contribution of different molecules to the surface tension has not been addressed until recently. [!53,54] Clearly, in such systems, the presence of the surfactant triggers a marked decrease of the surface tension. By analyzing the contribution of the different molecules and moieties to this residual surface tension, we obtained the rather surprising result that, in the case of ionic surfactants, the counterions play an unexpectedly important. [!53] In particular, in the presence of sodium dodecyl sulfate (SDS) at 4 mol/m2 surface concentration, the Na+ ions contributed 760% to the surface tension of the system.
This contribution is partly compensated by the water molecules and the sulfate headgroups of the surfactant. More surprisingly, in the case of the cationic surfactant dodecyl trimethyl ammonium chloride (DTAC), present in the same surface concentration, the surface tension of the Cl- counterions was found to be -240%, indicating that Cl- ions experience a far more favorable environment at the vicinity of the surface than in the bulk phase. [!53] It should be emphasized that the opposite contribution of the counterions and surfactant headgroups to the surface tension was recently confirmed experimentally by Phan and Haseeb. [!32]
To rationalize these findings, several hypotheses have been made. Thus, the surface tension contribution of the counterions might well be related to their “soft/hard” character
according to the Hofmeister series. [!67,68] Clearly, small ions with low polarizabilities, considered as “hard” ions or “structure makers” are more strongly repelled from the water surface than large ions of high polarizabilities (i.e., “soft” ions or “structure breakers”), [!69-75] and hence hard ions, forced to stay close to the liquid surface by the charged surfactant headgroups, might well pay a larger free energy penalty for staying close to the surface than softer, larger counterions do. This hypothesis explains the observed strong counterion dependence of the surface tension contribution by the fact that Cl- (as halide ions, in general) is clearly a softer ion than Na+. [!69,70,72] An alternative explanation, however, suggests that the surface tension contribution of the counterions is largely determined by the sign of their charge: negatively charged counterions give a much smaller, eventually negative, contribution to the surface tension than cationic counterions. This view is rationalized by the recent finding that, due to the charge asymmetry of the water molecule, two, otherwise equivalent, oppositely charged ions exhibit different surface affinities. [!76,77] This difference stems from the fact that a positively charged water H atom can approach the anion considerably closer than the large, negatively charge O atom can the corresponding cation, and hence an anion is more strongly hydrated than an otherwise equivalent cation. [!77] Thus, it should be emphasized that although this effect is discussed separately from that of the cation type, it is also related to the soft/hard character of the counterions, more precisely, to the fact that anions are, in general, harder than cations. In a previous paper, we aimed at testing the first of these hypotheses by simulating the liquid surface of aqueous alkali dodecyl sulfate solutions considering different alkali counterions. However, although the results were compatible with this hypothesis, they could only be regarded as indicative due to the severe failure of the model combination used. [!54]
In this paper, we present a detailed investigation of the validity of both hypotheses. To address the first hypothesis, we present computer simulations of the liquid-vapor interface of alkali dodecyl sulfate solutions, considering all alkali ions from Li+ to Cs+ as counterions. To magnify the effect to be studied, all systems correspond to the saturated surface concentration of 4 mol/m2. The employed model combination is validated by showing that the surfactant induced decrease of the surface tension follows the experimental trend. In each system, the relative surface tension contribution of the counterions, water molecules as well as surfactant heads and tails are calculated through their contributions to the lateral pressure profile, and the dependence of these contributions on the type of the counterion is investigated.
In order to test the second hypothesis, we present results of computer simulations of the fictitious, “charge inverted” SDS solution. In this system, the sign of the charge of the
counterions as well as that of the fractional charges of the surfactant ions are changed to their opposite, while the fractional charges of the water molecules are left unchanged. Thus, any difference between the real and charge inverted SDS solutions are caused by the sign of the charge of the ions. The possible relation between the charge sign and surface tension contribution of the counterions is addressed by comparing the lateral pressure profile and surface tension contributions of the different molecules and moieties in the real and charge inverted systems.
The paper is organized as follows. In sec. 2, details of the calculations performed, including the molecular dynamics simulations and lateral pressure profile calculation, are given. The obtained results are presented and discussed in detail in sec. 3. Finally, in sec. 4, the main conclusions of this study are summarized.
2. Methods
2.1. Selection of the Force Field to Be Used. In our previous paper, [!53] we simulated the aqueous surfactant solution of SDS at different surface concentrations using the GROMOS96 force field [!78,79] both for the dodecyl sulfate (DS-) surfactant ions and Na+ counterions, together with the SPC [!80] water model. To demonstrate that the results are not sensitive to the particular choice of the force field, we have repeated these calculations using the KBFF model [!81] of Na+ and SPC/E [!82] water. All simulations led to physically sensible results.
To extend this investigation to the full set of alkali counterions, a natural choice would be the use of either of these two force fields for all systems. However, to the best of our knowledge, among the five alkali cations the GROMOS96 force field only includes Na+ and K+. Therefore, we chose the second model combination, and repeated all simulations corresponding to the surface density of 4 mol/m2 with the KBFF model of the other alkali cations, i.e., Li+, K+, Rb+, and Cs+, in combination with SPC/E water. [!54] Unfortunately, it turned out that, unlike in the case of Na+, the simulations performed with the other cations resulted in higher rather than considerably lower surface tension values than that of neat SPC/E water. The reason for this unphysical behavior of the model was traced back to the far too strong contact pair formation between the surfactant headgroups and counterions, leading to the precipitation of the surfactant salt at the liquid surface. [!54]
Thus, to study the effect of the softness of the counterions on the relative contribution of the different particles and moieties to the surface tension, we had to find a cation force field
that is (i) complete, i.e., includes all alkali ions from Li+ to Cs+, and (ii) does not lead to unphysical result with any of the cations when simulating the liquid-vapor interface of the corresponding aqueous alkali DS- solution (i.e., leads to a decrease rather than an increase of the surface tension of neat water in every case). For this purpose, we have tried to use the GROMOS96 model of the DS- ions together with the alkali ion models proposed by Åqvist, [!83] Klasczyk and Knecht (KK), [!84] and Joung and Cheatham (JC), [!85] together with the SPC (in the first two cases) and SPC/E (in the last case) water models. Unfortunately, for all of these force fields, only the system containing Na+ counterions (and, in the case of, KK, also that with Li+) behave in a physically sensible way, while the use of any of the other counterions have led to the increase rather than decrease of the surface tension due to precipitation, as shown in Table 1.
The apparent failure of all these model combinations has made us to choose another force field also for the DS- ions, preferably such that also includes the full set of the alkali cations from Li+ to Cs+. For this purpose, we have chosen the all-atom CHARMM36 force field [!86] of the surfactant ions and counterions, to be used in combination with the CHARMM-compatible modified TIP3P (mTIP3P) model [!87] of water. This model combination indeed resulted in physically sensible results (i.e., markedly lower surface tension than that of neat water) for all cations, as seen from Table 1. Therefore, in the present study, we use this model combination in all simulations. Further, to confirm that the obtained results concerning the role of the sign of the ion charge are, at least qualitatively, independent from the force field used, we have repeated the corresponding simulations also with the GROMOS96 model of the ions and SPC water, as this model combination previously turned out to be able to qualitatively correctly describe the behavior of the system in the presence of Na+ counterions. [!53]
2.2. Molecular Dynamics Simulations. Molecular dynamics simulations of the liquid-vapor interface of aqueous alkali dodecyl sulfate solutions, corresponding to the (more or less saturated) surface concentration of 4 mol/m2, have been performed in the canonical (N,V,T) ensemble at 298 K. The alkali ions considered in the simulations include Li+, Na+, K+, Rb+, and Cs+. In the simulations of the charge inverted system, we have changed the sign of all fractional charges of the dodecyl sulfate ion as well as that of the sodium counterion to their opposite, while keeping their magnitude as well as the fractional charges of the water molecule unchanged. The charge inverted dodecyl sulfate and sodium ions are referred to in this paper as DS+ and Na-, respectively. In the case of the charge inverted systems, the surface
concentration of 4 mol/m2, used in the other simulations, has turned out to be clearly higher than that corresponding to surface saturation, as several charge inverted DS+ ions have entered to the bulk aqueous phase forming a micelle in the case of both potential models used.
For this reason, the charge inverted simulations have been performed with the surface concentration of 2 mol/m2, and the simulations of the corresponding real system have also been repeated at this surface concentration. The lengths of the X, Y, and Z edges of the rectangular basic box have been 265.0 Å, 62.82 Å, and 62.82 Å, respectively, in every case, axis X being perpendicular to the liquid surface. The basic box has consisted of 8000 water molecules. In the case of the 4 mol/m2 simulations 192, while in the case of the 2 mol/m2 simulations 96 DS- ions have been evenly distributed between the two liquid surfaces present in the basic box, and their charge has been neutralized by the same number of alkali counterions placed in the bulk liquid phase.
The simulations have been performed using an in-house modified, freely available version [!88] of the GROMACS 5.1 simulation package, [!89] which also computes the lateral pressure contribution of the individual atoms, allowing thus the calculation of their contribution to the surface tension. Equations of motion have been integrated in time steps of 2 fs. The temperature of the systems has been controlled by the Nosé-Hoover thermostat [!90,91] using the time constant of 5 ps. All interactions have been truncated to zero beyond the group-based cut-off distance of 15 Å. The long range part of the electrostatic interaction has been accounted for by means of the smooth particle mesh Ewald (sPME) method. [!8]
The starting configuration of the 4 mol/m2 simulations has been created from an equilibrium configuration of a previous run. [!53] In the case of the 2 mol/m2 simulations, the required number of surfactant ions have been randomly placed at both surfaces, while the counterions in the bulk liquid phase of a previously equilibrated water liquid-vapor interfacial system. After proper energy minimization, these systems have been pre-equilibrated in 20 ps long runs with the integration time step of 0.2 fs. All systems have been equilibrated for 20 ns with a time step of 2 fs. Then, in the subsequent, 20 ns long production run, 5 × 10⁴ equilibrium configurations per system, separated from each other by 0.4 ps long trajectories, have been dumped for the analyses. Finally, all density and lateral profiles calculated have been averaged also over the two liquid-vapor interfaces present in the basic box in such a way that zero value along the surface normal axis X corresponds to the middle of the liquid phase.
Equilibrium snapshots of the Na+DS- solutions of 2 and 4 mol/m2 surface concentrations as
well as that of the charge inverted Na-DS+ solution are shown in Figure 1, as obtained from simulations with the CHARMM36 force field.
2.3. Calculation of the Lateral Pressure Profile Contribution of the Particles. The elements of the pressure tensor can be decomposed to a kinetic and an excess (or virial) term, accounting for the motion and for the interaction of the particles, respectively. While the kinetic term of
i A iBi iv v m
V 1 can easily be distributed between the individual particles, the virial term of
ji i
B C
ijA
AB F s
V
, ij
d ) 1 (
s
r (2)
contains an integral over the open path Cij connecting the ith and jth particles, parametrized by the vector s. (In these equations, indices A and B stand for the corresponding spatial directions, while i and j over the particles, v and m stand for the velocity and mass, respectively, of the corresponding particles, Fij is the force acting between particles i and j, V is the volume of the system, and the brackets <...> denote ensemble averaging.
The choice of the Harasima path [!5] as the integration contour in eq. 2 has several important advantages. First, this way the lateral pressure contribution of a particle pair is evenly distributed between the two interacting particles. [!9] As a consequence, now the virial contribution to the lateral pressure, similarly to the kinetic term, can be unambiguously distributed between the individual atoms, and hence the lateral pressure can formally be treated as if it was an additive property of the particles. This fact not only makes the calculation of the lateral pressure profile computationally very efficient, but also enables us to assign lateral pressure (and, hence, surface tension) contributions to the individual particles.
[!9] Second, employing the Harasima path the lateral pressure profile can be calculated even if the potential is not fully pairwise additive. [!6] The importance of this point becomes apparent by considering that the reciprocal space term of the Ewald summation [!2,92,93] as well as of its particle mesh variants [!8,94] is not pairwise additive, either. It was recently shown how this term can be taken into account, and also distributed between the individual particles, both in the case of the original Ewald summation [!6] and of the sPME method, [!7]
used in the present study. It should finally be noted that the price one has to pay for the above advantages of using the Harasima path is that the normal component of the pressure is not
accessible this way. [!3] However, considering that in equilibrium the normal pressure has to be constant along the interface normal (due to the requirement of the mechanical stability of the system), and in the bulk phase it is equal to the scalar pressure of the system, this limitation has no consequence on the calculation of the surface tension contribution of the individual particles.
3. Results and Discussion
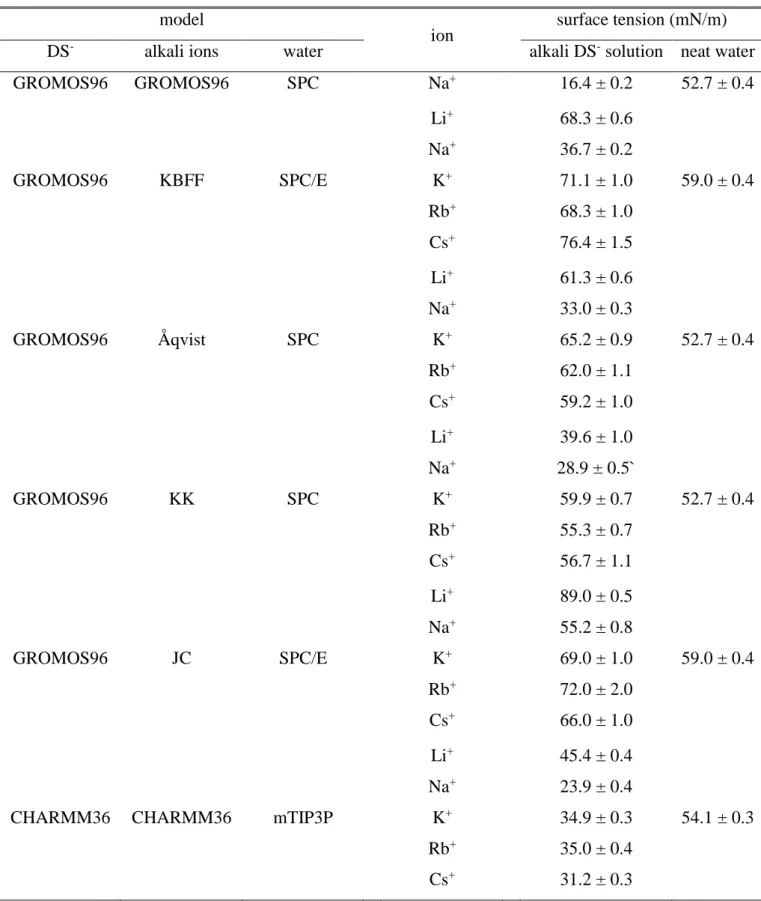
3.1. Surface Tension. In all simulations considered here, the surface tension of the system has always turned out to be considerably lower than that of neat water. Table 1 shows that alkali dodecyl sulfate at 4 mol/m2 surface concentration leads to a 10-30 /m surface tension decrease in every case when using the CHARMM36 force field. Further, the surface tension of the real and charge inverted 2 mol/m2 SDS solutions is 48.2 0.3 and 45.9 0.5 mN/m, respectively, for the CHARMM36/mTIP3P, and 48.6 0.4 and 47.5 0.6 mN/m, respectively, for the GROMOS96/SPC model combination. These values should be compared to the surface tension values of mTIP3P and SPC water of 54.1 0.3 and 52.7 0.4 mN/m, respectively. Thus, all simulations considered here have indeed led to physically meaningful results, as it is also confirmed by the radial distribution function (rdf) of the cation-Os pairs in the 4 mol/m2 systems (Os standing for the sulfate oxygen atoms). In Figure 2 it is seen that, with the exception of Li+, the height of the first peak of the rdfs, corresponding to contact pair formation, is comparable with that of the second peak, corresponding to solvent separated ion pairs. In the case of Li+DS-, there is a difference of about a factor of 4 between the heights of these peaks, in accordance with the higher surface tension of this system than those of the other ones. This is in a clear contrast with our earlier finding in the case of the KBFF model of counterions, resulting in an increase rather than decrease of the surface tension due to the onset of precipitation, clearly signaled by the presence of a first peak in the cation-Os rdf that is an order of magnitude larger than the second one. [!54] Further, in the present case, the coordination number corresponding to the second, solvent separated peak of the obtained rdfs is 5-9 times larger than that of the first peak for all counterions (for Li+ this ratio being 6.2). These findings confirm that, unlike in the case of other force fields considered, the ionic surfactant stays, as expected, in solution at the surface, instead of precipitating.
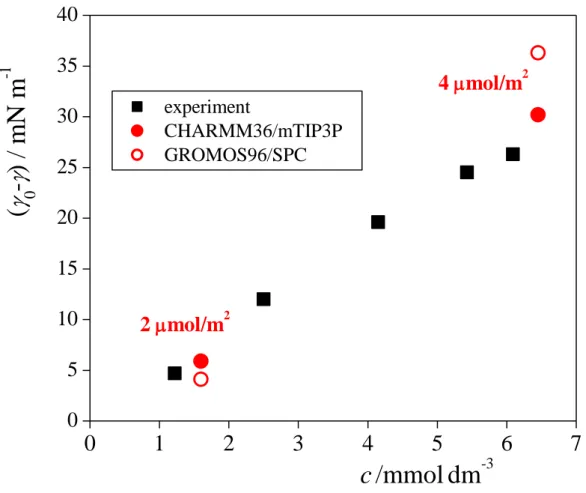
A direct comparison of the surface tension values obtained from our simulations with real experimental data is not without difficulties, because surface tension is conventionally measured as a function of the bulk liquid phase concentration, but in the simulations no DS- ion has entered into the bulk aqueous phase. Nevertheless, Mysels measured the dependence of the surface concentration of Na+DS- on its bulk concentration. [!95] According to his data, 2 and 4 mol/m2 surface concentrations correspond to the bulk phase concentration (c) values of 1.6 mmol/dm3 and 6.45 mmol/dm3, respectively (i.e., on average, 10-4 and 2.5×10⁻⁴ DS- ion, respectively, in the bulk liquid phase part of the basic simulation box). The surface tension decrease induced by Na+DS-, -0 (0 being the surface tension of neat water), is compared with the experimental data of Mysels [!95] in Figure 3. As is seen, the simulated values fit reasonably well in the experimental trend. It should also be noted that the surface density dependence of the surface tension is not supposed to be markedly different for different counterions, in accordance with the experimental data of Wang and Morgner, obtained for Na+ and Cs+. [!96] By contrast, the surface tension value obtained here in the presence of Li+ and Na+ counterions is noticeably higher and lower, respectively, than those obtained with the other three alkali counterions. This difference in the surface tension values of the systems containing Li+, Na+, and larger counterions indicates one limitation of the models used in the present investigation.
3.2. Role of the Soft/Hard Character of the Counterions. The mass density profiles of the 4 mol/m2 systems as well as the contributions of the water molecules, alkali counterions, surfactant headgroups and surfactant tails to these profiles are shown in Figure 4.
As is seen, the profiles obtained in the different systems are rather similar to each other. Thus, the water density drops very slowly, within about 20 Å from the bulk phase value to zero. The density profiles of both the charged surfactant headgroups and the counterions exhibit their peak in this X range of intermediate water densities, the latter peak being noticeably broader at its bulk liquid phase side, and located slightly, by about 1 Å farther from the surface than the former one. This finding simply reflects the fact that while the surfactant headgroups are tethered to the liquid surface, the counterions, being attracted by the oppositely charged layer of the headgroups, can more freely diffuse within the liquid phase. Consistently, the density peak of the surfactant tails, being very similar to each other in the different systems, is located in the vapor side of the interfacial region.
The only noticeable difference between the density profiles obtained in the different systems is that the entire interfacial region is somewhat more compact in the case of the Li+, and somewhat more diffuse in the case of the Na+ counterions, than in the other systems.
Thus, the X range of intermediate water densities as well as the density peaks of the counterions, headgroups and tails are narrower, and the overlap of the first two of these peaks is larger in the presence of Li+ than other counterions, while opposite differences are seen in the presence of Na+ ions. This finding is in accordance with the previous results that the contact pair peak of the counterion-Os rdf is higher for Li+ and somewhat lower for Na+ than for the other counterions and, consistently, the surface tension of the Li+DS- solution is higher while that of the Na+DS- solution is lower than that of the other systems.
The lateral pressure profile as well as its contributions given by the water molecules, counterions, as well as the surfactant headgroups and tails are compared in Figure 5 as obtained in the different systems simulated. All pressure profiles are rather similar to each other in every case, the only noticeable difference being that, in accordance with the density profiles, the lateral pressure peaks and minima are slightly sharper in the case of Li+, and broader in the case of Na+ than for other counterions. Thus, these lateral pressure profiles do not indicate any particular trend of the surface tension contributions as a function of the size and, hence, the soft/hard character of the counterion.
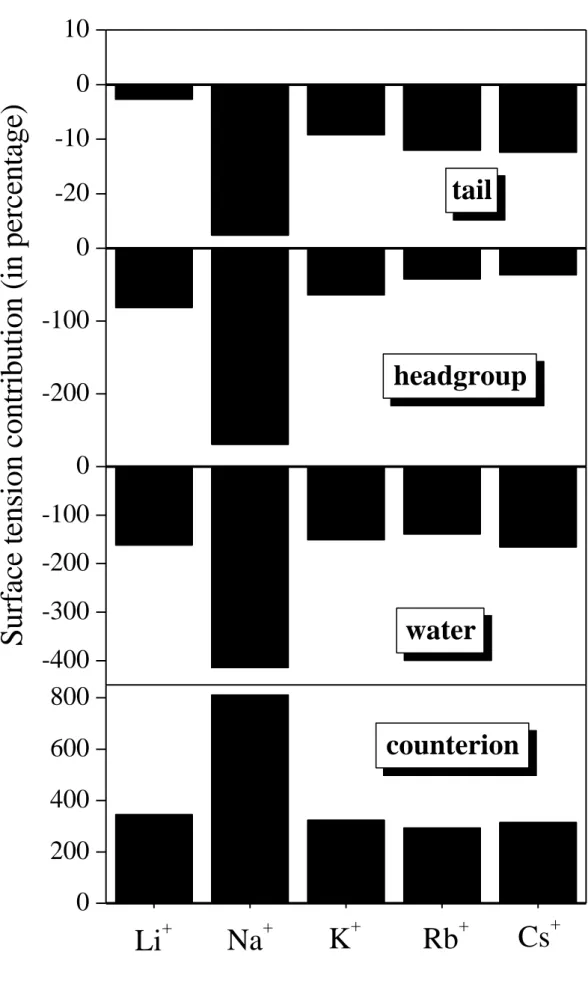
The absence of any clear trend is confirmed by the calculated percentage contributions of the different particles and moieties to the surface tension, as shown in Figure 6. Clearly, the case of Na+ stands out with much larger contributions, either positive or negative, than those of the other counterions. If one disregards the Na+ case, some minor trends could be observed:
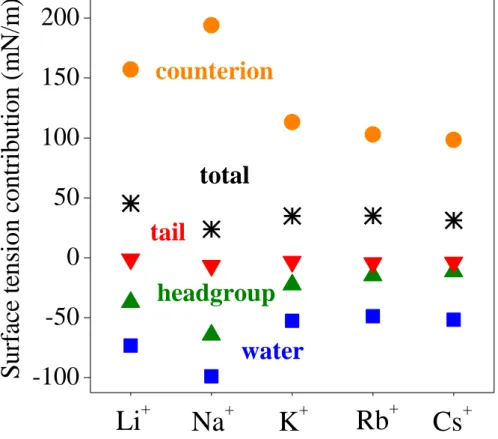
the tail contributions get larger, while those of the headgroups smaller in magnitude with increasing counterion size. However, no such trend is seen for water and, in particular, for the counterions. One may argue that in the case of Na+ the surface tension is smaller than in the other cases (see Table 1), and hence a larger percentage contribution to this smaller value is not necessarily larger in terms of the absolute value. To consider also this possibility, we plot the absolute surface tension contributions of the different particles and groups, obtained in the presence of different counterions, in Figure 7. Here, the contribution of the counterions exhibits a decreasing, while that of the oppositely charged headgroups an increasing trend with increasing counterion size, given that the results obtained either with Na+ or with Li+ counterions are excluded. However, these opposite trends cancel out, and the total surface tension does not show any particular dependence on the ion size.
In interpreting these results, it should be kept in mind that, among the five sets of potential models tested, CHARMM36 has turned out to be by far the best, being the only one that gives qualitatively meaningful results for all counterions. However, it is difficult to assess the quality of the force field at a quantitative level because experimental results indicate that, at least for Na+ and Cs+ counterions, alkali dodecyl sulfate solutions of the same surface density correspond to the same surface tension values, [!96] suggesting that the same might also be true for other alkali counterions, as well. By contrast, in our simulations, the surface tension of the Na+DS- solution has turned out to be about 25% lower than that of the Cs+DS- solutions of the same surface density, and the presence of Li+ and Na+ resulted in markedly higher and lower surface tension values, respectively, than that of other counterions. This means that even the best effective pairwise additive force field might be not accurate enough to allow us to test the correlation between the soft/hard character of the counterions and their contribution to the surface tension. Further, the question of how strongly the different counterions are bound to the oppositely charged headgroups, and hence how much the corresponding anionic surfactant decreases the surface tension of water seems to be at least as much important in this respect as the soft/hard character of the counterions.
3.3. Role of the Sign of the Ion Charge. The density profiles of the real and charge inverted NaDS solutions as well as the contributions of the water molecules, counterions, surfactant headgroups and surfactant tails to these profiles are compared to each other in Figure 8, as obtained both with the CHARMM36 and the GROMOS96 force field. As is seen, the profiles corresponding to the real and charge inverted systems are very similar in every case, confirming that the charge inversion did not lead to marked structural changes and, hence, any difference found in the surface tension contributions can solely be attributed to the sign of the ion charge. The only important difference between the two sets of profiles is that the density peaks of the charged groups occur somewhat farther from the surface in the charge inverted systems than in the corresponding real ones. This shift is considerably smaller for the surfactant headgroups, tethered to the liquid surface by the apolar tails, than for the freely diffusing counterions (these values being about 0.7 and 1.5 Å, respectively). A similar shift of the ions away from the liquid surface was previously observed in the aqueous solution of charge inverted NaI, and was explained by the different hydration of the cations and anions.
[!77] Namely, in hydrating cations, water molecules turn their O atom to the ion, while in the first hydration shell of an anion one of its O-H bonds points straight to it. However, due to their markedly different size, a water H atom can approach the anion much closer than the
water O atom can approach a cation of the same size. As a consequence, anions are more strongly hydrated, in other words, they would lose more energy upon approaching the liquid surface, and hence they are effectively repelled from the liquid surface more than cations of the same size. Further, this effect is stronger for smaller ions, because the hydrating water molecule can approach them closer than larger ions. [!77] In the present system, sodium is clearly smaller than the sulfate headgroup, and hence the charge inversion, by making the smaller of the two ions negative, leads to the observed inward shift of the corresponding density peaks.
The lateral pressure profiles obtained in these systems as well as their contributions coming from the different particles and groups are shown in Figure 9. As is seen, while the contributions of the apolar tails (which are weakly hydrated and bear small fractional charges) are very similar, the contributions of the other moieties are substantially different in the real and charge inverted systems. In particular, while the profile of the positively charged Na+ counterions exhibits a marked negative lateral pressure peak (corresponding to a large positive surface tension contribution, see eq. 1), its charge inverted counterpart behaves in the opposite way, i.e., it decreases rather than increases the surface tension. Further, in the real system, the contributions of both the water molecules and the surfactant headgroups are characterized by a double, positive-negative peak structure. Thus, water molecules and headgroups that are located in the range of high counterion density give rise to a positive lateral pressure peak (thereby decreasing the surface tension), while those located closer to the liquid surface and the region of the apolar tails, but farther from the counterions give rise to a negative lateral pressure peak, and hence they increase the surface tension. While this latter, negative peak remains largely unchanged in the charge inverted system, the first, positive peak changes sign, indicating that the corresponding particles are now increasing rather than decreasing the surface tension of the system. As a consequence of the opposite effect of the charge inversion on the counterions and on the headgroups and water molecules, the overall lateral pressure profile does not change considerably upon charge inversion, consistently with our earlier finding that these systems correspond to similar surface tension values.
The clear effect of the sign of the ion charge on the various surface tension contributions is emphasized in Figure 10, where these contributions are shown as percentage of the total surface tension. As is clear, apart from the tails, all groups give markedly different contributions to the surface tension in the real and in the charge inverted system, even the sign of these contributions being different. To demonstrate that this result is largely model- independent (as long as the potential model gives physically sensible results), we compare in
Figure 11 these percentage contributions in the 2 mol/m2 real and charge inverted as well as in the 4 mol/m2 real NaDS system, as obtained with the two force fields used. As is seen, the two force fields not only yield qualitatively similar results, but the values of the percentage contributions are also rather similar to each other in most of the cases.
The obtained results clearly reveal that the sign of the charge of the counterions (and therefore their hydration) indeed plays a critical role in determining the surface tension contributions of the different particles and moieties. To understand the underlying physical reasons, two important factors, namely (i) the above discussed differences in the hydration of the oppositely charged ions, and (ii) the fact that while counterions can move in the bulk liquid phase the oppositely charged surfactant headgroups are tethered to the liquid surface, need to be considered. Further, since differences are only seen in the subsurface region of high counterion density (see Fig. 9), our discussion can be limited to this region. Thus, in the real system, the free energy loss of the negatively charged headgroups and water molecules associated with the vicinity of the vapor phase is clearly overcompensated by the free energy gain due to the vicinity of the counterions. On the other hand, for the more freely diffusing counterions, the free energy loss caused by the entropy decrease due to their accumulation in a few angstroms wide subsurface layer is added to that due to the vicinity of the vapor phase, and this additional free energy loss can no longer be compensated by the energy gain due to the vicinity of the oppositely charged headgroups. In the case of the charge inverted system, on the other hand, the Na- ions are more strongly hydrated, while the positively charged headgroups are less strongly hydrated, than the corresponding ions in the real system. As a consequence, the free energy gain of the counterions now exceeds, while that of the headgroups does not exceed any more, their free energy loss, as evidenced by the sign of the corresponding lateral pressure profile peaks. Finally, the water molecules are hydrating both positive and negative ions in this region in both cases, thus, while charge inversion leads to a free energy gain through the stronger hydration of the Na- than Na+ counterions, it also induces a free energy loss due to the weaker hydration of the DS+ than DS- heads. However, the larger sulfate ion is surrounded by considerably more (i.e., on average, 15 instead of 6) first shell water neighbors than the smaller sodium counterion. Further, the negative charge of the sulfate group is carried mostly by its O atoms, which can be approached by a hydrating water molecule almost as closely as a sodium ion. As a consequence, the free energy loss associated with the weaker hydration of the DS+ than DS- heads outweighs the free energy gain due to the stronger hydration of the Na- than Na+ counterions. This leads to the sign inversion of the surface tension contribution of the water molecules in this region upon charge
inversion. It should finally be emphasized that while charge inversion results in a hydration free energy gain of the counterions, it also leads to a concomitant free energy loss of the surfactant headgroups, and also in a free energy loss of the water molecules hydrating these ions, as evidenced by the corresponding changes in the surface tension contributions.
However, these opposite changes largely cancel the effect of each other out, making the surface tension of the charge inverted system very similar to that of the real one.
4. Conclusions
We have used molecular dynamics computer simulations to investigate the effect of the counterion type on the surface tension of aqueous alkali dodecyl sulfate solutions. To isolate the effect of the counterion type, we have performed the simulations at the same surface coverage, being close to (but not above) the critical micellar concentration (cmc).
Although our original aim was to investigate whether the size and sign of the charge of the counterion does have an influence on the surface tension contribution of the different molecules and moieties, the present study turned out to be also a benchmark of different force fields related to the surface tension simulation. The importance of this benchmark character of the present study is stressed by the known fact that, in simulating mixtures of several components, the ability of the individual models of reproducing the experimental properties of the respective neat systems is a necessary but not sufficient condition of the appropriateness of their combination, [!97-100] and hence the performance of such model combinations also has to be assessed. Thus, it should again be emphasized that the observed failure in reproducing the qualitative effect of an ionic surfactant on the surface tension of its aqueous solution reflects the inadequacy of the combination of the water, surfactant, and counterion models used, and cannot be simply blamed on any of them alone. Thus, the combination of the SPC or SPC/E water model and the GROMOS96 force field of the surfactant resulted in a physically sensible result when used with the Na+ counterion in every case. Also, the combination of the SPC/E and JC models of water and alkali cations provided an excellent description of the surface of the solution when used in combination with the JC model of halide anions. [!77]
In the light of the results obtained in this respect, we have used the CHARMM36 force field in the simulations concerning the effect of the counterion size, as only this model turned out to yield non-precipitating solutions for the whole series of alkali counterions from lithium to cesium. Our analysis included the (local) contribution to the surface tension from different
species (water, counterions) and surfactant moieties (headgroup, tail). While we observed some trends compatible with the Hofmeister series in the various contributions to the surface tension, the total surface tension itself did not show any clear trend in this respect.
Interestingly, the computed surface tension values at constant 4 mol/m2 coverage (45.4 ± 0.4, 23.9 ± 0.4, 34.9 ± 0.3, 35.0 ± 0.4, and 31.2 ± 0.3 mN/m) for Li+, Na+, K+, Rb+, and Cs+ counterions, respectively, follow relatively well the experimental trend of the surface tension at the cmc, measured at the temperature of 306 K, of 43.0, 40.0, 35.8, 35.1, and 35.1 mN/m, [!12] with the usual exception of sodium. The present simulations are, by design, performed not at the critical micellar concentration but at constant surface coverage.
Therefore, any comparison between the computed and experimental surface tension values needs to be taken with a grain of salt (and gauged by the far too-low neat water surface tension of mTIP3P of 54.1 ± 0.3 mN/m). However, sodium is a clear outlier in the trend.
Therefore, one should consider the possibility of a problem in the force field parameterization, either for sodium or for the other counterions. Sodium is the most studied and tested counterion with practically all force fields, and it is reasonable to expect that its parametrization is more accurate than that of the other counterions.
This apparent inconsistency, occurring even in the best classical force field combination considered, leads naturally to the idea whether the problem should be investigated by ab initio molecular dynamics simulation. However, there are multiple reasons why such a simulation would not be particularly beneficial, at least at the moment. Thus, to obtain accurate enough results, a long enough simulation needs to be run. Also, to avoid finite size effects, the system size should also not be reduced. These factors would already make the study computationally unfeasible. Furthermore, the intrinsic many-body nature of ab-initio forces would make it highly non-trivial (if not impossible) to compute the pressure profile.
Finally, concerning the predictive quality of ab-initio simulations involving water, one must also consider that even the exchange-correlation functionals, considered to be the most accurate ones at the moment, produce a rather unsatisfactory phase diagram of water even in comparison with successful empirical force-fields. [!101]
In addition to the investigation of the effect of the counterion size, we have also computed the lateral pressure profiles for the charge-inverted sodium dodecyl sulfate solution both with the CHARMM36 and GROMOS96 force fields. Changing the sign of the ionic charges in the surfactant and its counterion is an artificial, albeit informative, way to investigate the influence of the counterion hydration strength thanks to its improved ability to coordinate water molecules. Indeed, we found that the charge-inverted counterions contribute
with an opposite sign to the surface tension, even if their contribution is considered together with that of the coordinated water molecules. However, it is the combined effect of anions, cations and hydrating water molecules that determines the total surface tension change. The decrease in the free energy of the counterions, observed upon charge inversion, corresponds to an increase in that of both the surfactant headgroups and water molecules hydrating these ions. The net result is that the total surface tension is not much sensitive to the charge- inversion.
In conclusion, the present results confirm, at least qualitatively, the influence of the hardness of the counterions, in a rough accordance with the Hofmeister series, on their contribution to the surface tension of ionic surfactant solutions. Further, they also underline the decisive role of the sign of the counterion charge (the size of the counterion being kept fixed) in determining it solvation properties and influence on the surface tension. The sodium counterion in the CHARMM36 force field represents a clear exception to the observed trend.
Nevertheless, it is clear from the present results that force fields with a better quantitative agreement with the experiments, possibly polarizable ones, are needed to improve our understanding of the microscopic properties of surfactant solutions.
Having shown that the surface tension contribution of ionic species is substantially influenced by the sign of their charge, a systematic investigation of the surface tension contribution of the charged moieties in adlayers consisting of a mixture of cationic and anionic (and, perhaps, also zwitterionic) surfactants would be a natural extension of this work.
Such an investigation would also be of great relevance in understanding the atmospheric fate of various aerosol particles, [!102] often consisting of such a mixture of surfactants as well as dissolved salts. [!103] Thus, according to the Köhler theory, [!104] the reduced surface tension leads to the increased activity of such aerosols as cloud condensation nuclei, altering the optical properties as well as the propensity of precipitation on regional to global scales.
Further, as it becomes increasingly clear from recent experimental studies, [!105] the surface tension of such aerosol droplets is considerably different from that of the corresponding macroscopic surface. Recent molecular dynamics simulations highlighted the relationship between synergistic interactions in mixed surfactant layers and observed surface tension reduction, [!106] and showed that the distribution of organics at the surface of atmospheric nanoparticles, depending on the nature of the organic compound, can be strongly inhomogeneous. [!107,108] Accessing the surface tension contributions of the various particles in moieties in such systems could provide a deeper understanding of the physical background of these complex processes. Work in this direction is currently in progress.
Acknowledgements
This work has been supported by the Hungarian NKFIH Foundation under Project Nos. 134596 and 120075. The authors are indebted to Dr Maria Lbadaoui-Darvas (EPFL, Lausanne) for useful discussions concerning the atmospheric implications of the results.
References
(1) Rowlinson, J. S.; Widom, B. Molecular Theory of Capillarity; Dover Publications:
Mineola, 2002.
(2) Allen, M. P.; Tildesley, D. J. Computer Simulation of Liquids; Clarendon Press:
Oxford, 1987.
(3) Schofield, P.; Henderson, J. R. Statistical Mechanics of Inhomogeneous Fluids. Proc.
R. Soc. Lond. A 1982, 379, 231-246.
(4) Irving, J. H.; Kirkwood, J. G. The Statistical Mechanical Theory of Transport Processes. IV. The Equations of Hydrodynamics. J. Chem. Phys. 1950, 18, 817-829.
(5) Harasima, A. Molecular Theory of Surface Tension. Adv. Chem. Phys. 1958, 1, 203- 237.
(6) Sonne, J.; Hansen, F. Y.; Peters, G. H. Methodological Problems in Pressure Profile Calculations for Lipid Bilayers. J. Chem. Phys. 2005, 122, 124903-1-9.
(7) Sega, M.; Fábián, B.; Jedlovszky, P. Pressure Profile Calculation with Particle Mesh Ewald Methods. J. Chem. Theory Comput. 2016, 12, 4509-4515.
(8) Essman, U.; Perera, L.; Berkowitz, M. L.; Darden, T.; Lee, H.; Pedersen, L. G. A Smooth Particle Mesh Ewald Method. J. Chem. Phys. 1995, 103, 8577-8594.
(9) Sega, M.; Fábián, B.; Jedlovszky, P. Layer-by-Layer and Intrinsic Analysis of Molecular and Thermodynamic Properties across Soft Interfaces. J. Chem. Phys.
2015, 143, 114709-1-8.
(10) Sega, M.; Fábián, B.; Horvai, G.; Jedlovszky, P. How Is the Surface Tension of Various Liquids Distributed along the Interface Normal? J. Phys. Chem. C 2016, 120, 27468-27477.
(11) Hantal, Gy.; Fábián, B.; Sega, M.; Jedlovszky, P. Contribution of the Two Liquid Phases to the Interfacial Tension at Various Water-Organic Liquid-Liquid Interfaces.
J. Mol. Liquids 2020, 306, 112872-1-10.
(12) Lu, J. R.; Marrocco, A.; Su, T. J.; Thomas; R. K.; Penfold, J. Adsorption of Dodecyl Sulfate Surfactants with Monovalent Metal Counterions at the Air/Water Interface Studied by Neutron Reflection and Surface Tension. J. Coll. Interface Sci. 1993, 158, 303-316.
(13) Gragson, D. E.; McCarty, B. M.; Richmond, G. L. Surfactant/Water Interactions at the Air/Water Interface Probed by Vibrational Sum Frequency Generation. J. Phys. Chem.
1996, 100, 14272-14275.
(14) Schulz, J. C.; Warr, G. G. Selective Adsorption of metal Cations onto AOT and Dodecyl Sulfate Films at the Air/Solution Interface. J. Chem. Soc. Faraday Trans.
1998, 94, 253-257.
(15) Ferrari, M.; Liggieri, L.; Ravera, F. Adsorption Properties of C10E8 at the Water- Hexane Interface. J. Phys. Chem. B. 1998, 102, 10521–10527.
(16) Medrzycka, K.; Zwierzykowski, W. Adsorption of Alkyltrimethylammonium Bromides at the Various Interfaces, J. Coll. Interface Sci. 2000, 230, 67-72.
(17) Lu, J. R.; Thomas, R. K.; Penfold, J. Surfactant Layers at the Air/Water Interface:
Structure and Composition. Adv. Coll. Interface Sci. 2000, 84, 143-304.
(18) Benderskii, A. V.; Eisenthal, K. B. Aqueous Solvation Dynamics at the Anionic Surfactant Air/Water Interface. J. Phys. Chem. B. 2001, 105, 6698-6703.
(19) Gilányi, T.; Varga, I.; Mészáros, R. Specific Counterion Effect on the Adsorption of Alkali Decyl Sulfate Surfactants at Air/Solution Interface. Phys. Chem. Chem. Phys.
2004, 6, 4348-4346.
(20) Ma, G.; Allen, H. C. Real-Time Investigation of Lung Surfactant Respreading with Surface Vibrational Spectroscopy. Langmuir 2006, 22, 11267-11274.
(21) Kirsch, M. J.; D’Auria, R.; Brown, M. A.; Tobias, D. J.; Hemminger, J. C.; Ammann, M.; Starr, D. E.; Bluhm, H. The Effect of an Organic Surfactant on the Liquid-Vapor Interface of an Electrolyte Solution. J. Phys. Chem. C. 2007, 111, 13497-13509.
(22) Zhang, Z.; Zheng, D.; Guo, Y.; Wang, H. Water Penetration/Accommodation and Phase Behaviour of the Neutral Langmuir Monolayer at the Air/Water Interface Probed with Sum Frequency Generation Vibrational Spectroscopy (SFG-VS). Phys.
Chem. Chem. Phys. 2009, 11, 991-1002.
(23) de Aquiar, H.; Strader, M. L.; de Beer, A. G. F.; Roke, S. Surface Structure of Sodium Dodecyl Sulfate Surfactant and Oil at the Oil-In-Water Droplet Liquid/Liquid Interface: A Manifestation of a Nonequilibrium Surface State, J. Phys. Chem. B 2011, 115, 2970–2978.
(24) Angus-Smyth, A.; Campbell, R. A.; Bain, C. D. Dynamic Adsorption of Weakly Interacting Polymer/Surfactant Mixtures at the Air/Water Interface. Langmuir 2012, 28, 12479-12492.
(25) Scheu, R.; Chen, Y.; de Aguiar, H. B.; Rankin, B. M.; Ben-Amotz, D.; Roke, S.
Specific Ion Effects in Amphiphile Hydration and Interface Stabilization, J. Am.
Chem. Soc. 2014, 136, 2040–2047.
(26) Phan, C. M.; Nguyen, C. V.; Yusa, S.; Yamada, N. L. Synergistic Adsorption of MIBC/CTAB Mixture at the Air/Water Interface and Applicability of Gibbs Adsorption Equation. Langmuir 2014, 30, 5790–5796.
(27) Shahir, A. A.; Nguyen, K. T.; Nguyen, A. V. A Sum-Frequency Generation Spectroscopic Study of the Gibbs Analysis Paradox: Monolayer or Sub-Monolayer Adsorption? Phys. Chem. Chem. Phys. 2016, 18, 8794-8805.
(28) W. Wu, H. Fang, F. Yang, S. Chen, X. Zhu, Q. Yuan, W. Gan, Understanding the Different Steps of Surfactant Adsorption at the Oil−Water Interface with Second Harmonic Generation, J. Phys. Chem. C 2016, 120, 6515–6523.
(29) Zhao, X.; Nathanson, G. M.; Adersson, G. G. Experimental Depth Profiles of Surfactants, Ions, and Solvent at the Angstrom Scale: Studies of Cationic and Anionic Surfactants and Their Salting Out. J. Phys. Chem. B. 2017, 124, 2218-2229.
(30) Shahir, A. A.; Arabadzhieva, D.; Petkova, H.; Karakashev, S. I.; Nguyen, A. V.;
Mileva, E. Effect of Under-Monolayer Adsorption on Foamability, Rheological Characteristics, and Dynamic Behavior of Fluid Interfaces: Experimental Evidence for the Guggenheim Extended Interface Model. J. Phys. Chem. C. 2017, 121, 11472–
11487.
(31) Weiẞenborn, E.; Braunschweig, B. Specific Ion Effects of Dodecyl Sulfate Surfactants with Alkali Ions at the Air-Water Interface. Molecules 2019, 24, 2911-1- 13.
(32) Phan, C. M.; Haseeb, M. Relative Contribution of Cationic Surfactant and Counter- Anion to a Liquid Film Tension. J. Mol. Liquids 2020, 306, 112802-1-7.
(33) Peng, M.; Duignan, T. T.; Nguyen, A. V. Quantifying the Counterion-Specific Effect on Surfactant Adsorption Using Modeling, Simulation, and Experiments. Langmuir 2020, 36, 13012-13022.
(34) Böcker, J.; Schlenkirch, M.; Bopp, P.; Brickmann, J. Molecular Dynamics Simulation of a n-Hexadecyltrimethylammonium Chloride Monolayer. J. Phys. Chem. 1992, 96, 9915-9922.
(35) Tarek, M.; Tobias, D. J.; Klein, M. L. Molecular Dynamics Simulation of Tetradecyltrimethylammonium Bromide Monolayers at the Air/Water Interface. J.
Phys. Chem. 1995, 99, 1393-1402.
(36) Schweighofer, K.; Essman, U.; Berkowitz, M. Simulation of Sodium Dodecyl Sulfate at the Water-Vapor and Water-Carbon Tetrachloride Interfaces at Low Surface Coverage. J. Phys. Chem. B 1997, 101, 3793-3799.
(37) Domínguez, H.; Berkowitz, M. Computer Simulations of Sodium Dodecyl Sulfate at Liquid/Liquid and Liquid/Vapor Interfaces. J. Phys. Chem. B 2000, 104, 5302-5308.
(38) Domínguez, H. Computer Simulations of Surfactant Mixtures at the Liquid/Liquid Interface. J. Phys. Chem. B 2002, 106, 5915-5924.
(39) Jedlovszky, P.; Varga, I.; Gilányi, T. Adsorption of 1-Octanol at the Free Water Surface as Studied By Monte Carlo Simulation. J. Chem. Phys. 2004, 120, 11839- 11851.
(40) Domínguez, H.; Rivera, M. Mixtures of Sodium Dodecyl Sulfate/Dodecanol at the Air/Water Interface by Computer Simulations. Langmuir 2005, 21, 7257-7262.
(41) Rodriguez, J.; Clavero, E.; Laria, D. Computer Simulations of Catanionic Surfactants Adsorbed at Air/Water Interfaces. J. Phys. Chem. B. 2005, 109, 24427-24433.
(42) Hantal, Gy.; Pártay, L. B.; Varga, I.; Jedlovszky, P.; Gilányi, T. Counterion and Surface Density Dependence of the Adsorption Layer of Ionic Surfactants at the Vapor-Aqueous Solution Interface: A Computer Simulation Study. J. Phys. Chem. B.
2007, 111, 1769-1774.
(43) Martínez, H.; Chacón, E.; Tarazona, P.; Bresme, F. The Intrinsic Interfacial Structure of Ionic Surfactant Monolayers at Water-Oil and Water-Vapour Interfaces. Proc. R.
Soc. A 2011, 467, 1939-1958.
(44) Bresme, F.; Chacón, E.; Martínez, H.; Tarazona, P. Adhesive Transitions in Newton Black Films: A Computer Simulation Study. J. Chem. Phys. 2011, 134, 214701-1-12.
(45) Pang, J.; Wang, Y.; Xu, G.; Han, T. Molecular Dynamics Simulation of SDS, DTAB, and C12E8 Monolayers Adsorbed at the Air/Water Surface in the Presence of DSEP. J.
Phys. Chem. B. 2011, 115, 2518-2526.
(46) Rideg, N. A.; Darvas, M.; Varga, I.; Jedlovszky, P. Lateral Dynamics of Surfactants at the Free Water Surface. A Computer Simulation Study. Langmuir 2012, 28, 14944- 14953.
(47) Vacha, R.; Roke, S. Sodium Dodecyl Sulfate at Water–Hydrophobic Interfaces: A Simulation Study. J. Phys. Chem. B. 2012, 116, 11936-11942.
(48) Abrankó-Rideg, N.; Darvas, M.; Horvai, G.; Jedlovszky, P. Immersion Depth of Surfactants at the Free Water Surface: A Computer Simulation and ITIM Analysis Study. J. Phys. Chem. B 2013, 117, 8733-8746.
(49) Chen, M.; Lu, X.; Liu, X.; Hou, Q.; Zhu, Y.; Zhou, H. Temperature-Dependent Phase Transition and Desorption Free Energy of Sodium Dodecyl Sulfate at the Water/Vapor
Interface: Approaches from Molecular Dynamics Simulations. Langmuir, 2014, 30, 10600–10607.
(50) Bernardino, K.; de Moura, A. F. Surface Electrostatic Potential and Water Orientation in the Presence of Sodium Octanoate Dilute Monolayers Studied by Means of Molecular Dynamics Simulations. Langmuir 2015, 31, 10995–11004.
(51) Abrankó-Rideg, N.; Horvai, G.; Jedlovszky, P. Structure of the Adsorption Layer of Various Ionic and Non-Ionic Surfactants at the Free Water Surface, As Seen from Computer Simulation and ITIM Analysis. J. Mol. Liquids 2015, 205, 9-15.
(52) Sresht, V.; Lewandowski, E. P.; Blankschtein, D.; Jusufi, A. Combined Molecular Dynamics Simulation–Molecular-Thermodynamic Theory Framework for Predicting Surface Tensions. Langmuir 2017, 33, 8319–8329.
(53) Hantal, Gy.; Sega, M.; Horvai, G.; Jedlovszky, P. Contribution of Different Molecules and Moieties to the Surface Tension in Aqueous Surfactant Solutions. J. Phys. Chem.
C 2019, 123, 16660-16670.
(54) Hantal, Gy.; Sega, M.; Horvai, G.; Jedlovszky, P. Role of the Counterions in the Surface Tension of Aqueous Surfactant Solutions. A Computer Simulation Study of Alkali Dodecyl Sulfate systems. Coll. Interfaces 2020, 4, 15-1-15.
(55) Vysotsky, Yu. B.; Bryantsev, V. S.; Fainermann, V. B.; Vollhardt, D. Quantum Chemical Analysis of the Thermodynamics of 2D Cluster Formation of Odd n- Alcohols at the Air/Water Interface. J. Phys. Chem. B 2002, 106, 11285-11294.
(56) Mulqueen, M.; Blankschtein, D. Theoretical and Experimental Investigation of the Equilibrium Oil-Water Interfacial Tensions of Solutions Containing Surfactant Mixtures. Langmuir 2002, 8, 365–376.
(57) Ginzburg, V. V.; Chang, K.; Jog, P. K.; Argenton, A. B.; Rakesh, L. Modeling the Interfacial Tension in Oil-Water-Nonionic Surfactant Mixtures Using Dissipative Particle Dynamics and Self-Consistent Field Theory. J. Phys. Chem. B 2011, 115, 4654–4661.
(58) Vysotsky, Yu. B.; Kartashynska, E. S., Belyaeva, E. A., Fainermann, V. B.; Vollhardt, D.; Miller, R. Quantum Chemical Analysis of Thermodynamics of 2D Cluster Formation of Alkanes at she Water/Vapor Interface in the Presence of Aliphatic Alcohols. Phys. Chem. Chem. Phys. 2015, 17, 28901–28920.
(59) Shahir, A. A.; Nguyen, A. V.; Karakashev, S. I. A Quantification of Immersion of the Adsorbed Ionic Surfactants at Liquid Vertical Bar Fluid Interfaces. Coll. Surf. A 2016, 509, 279-292.
(60) Tsoneva, Y.; Tadjer, A.; Mineva, T. NMR Characterization of Dilauroyl Phosphatidylcholine in Adsorbed Monolayers at Fluid Interfaces Studied by Multiscale Computations. Int. J. Quant. Chem. 2016, 116, 1419–1426.
(61) Sresht, V.; Lewandowski, E. P.; Blankschtein, D.; Jusufi, A. Combined Molecular Dynamics Simulation–Molecular-Thermodynamic Theory Framework for Predicting Surface Tensions. Langmuir 2017, 33, 8319–8329.
(62) Rehner, P.; Gross, J. Predictive Density Gradient Theory Based on Nonlocal Density Functional Theory. Phys. Rev. E 2018, 98, 063312-1-.
(63) Vu, T. V.; Papavassiliou, D. V. Oil-Water Interfaces with Surfactants: A Systematic Approach To Determine Coarse-Grained Model Parameters, J. Chem. Phys. 2018, 148, 204704-1-11.
(64) Peng, M.; Duignan, T. T.; Zhao, X. S.; Nguyen, A. V. Surface Potential Explained: A Surfactant Adsorption Model Incorporating Realistic Layer Thickness. J. Phys. Chem.
B 2020, 124, 3195-3205.
(65) Kartashynska, E. S.; Lylyk, S. V.; Aksenenko, E. V.; Makievski, A. V.; Vysotsky, Yu.
B.; Fainerman, V. B.; Miller, R. Surface Tension at the Interface between Aqueous Solution of Surfactant and Alkane. A Comprehensive Quantum Chemical and Thermodynamic Approach. Coll. Surf. A 2020, 591, 124557-1-8.
(66) Peng, M.; Duignan, T. T.; Nguyen, A. V. Significant Effect of Surfactant Adsorption Layer Thickness in Equilibrium Foam Films. J. Phys. Chem. B 2020, 124, 5301-5310.
(67) Hofmeister, F. Zur Lehre von der Wirkung der Salze. Archiv f. Experiment. Pathol. U.
Pharmakol. 1888, 24, 247-260 (in German).
(68) Jungwirth, P.; Cremer, P. S. Beyond Hofmeister, Nature Chem. 2014, 6, 261-263.
(69) Jungwirth, P.; Tobias, D. J. Molecular Structure of Salt Solutions: A New View of the Interface with Implications for Heterogeneous Atmospheric Chemistry. J. Phys.
Chem. B. 2001, 105, 10468-10472
(70) Vrbka, L.; Mucha, M.; Minofar, B.; Jungwirth, P.; Brown, E. C.; Tobias, D. J.
Propensity of Soft Ions for the Air/Water Interface. Curr. Opin. Coll. Interface Sci.
2004, 9, 67-73.
(71) Boström, M.; Kunz, W.; Ninham, B. W. Hofmeister Effects in Surface Tension of Aqueous Electrolyte Solution. Langmuir 2005, 21, 2619-2623.
(72) Jungwirth, P.; Tobias, D. J. Specific Ion Effects at the Air/Water Interface. Chem. Rev.
2006, 106, 1259-1281.
(73) Pegram, L. M.; Record, M. T. Jr. Hofmeister Salt Effects on Surface Tension Arise from Partitioning of Anions and Cations between Bulk Water and the Air-Water Interface. J. Phys. Chem. B. 2007, 111, 5411-5417.
(74) dos Santos, A. P.; Diehl, A.; Levin, Y. Surface Tensions, Surface Potentials, and the Hofmeister Series of Electrolyte Solutions Langmuir 2010, 26, 10778-10783.
(75) dos Santos, A. P.; Levin, Y. Surface and Interfacial Tensions of Hofmeister Electrolytes. Faraday Discuss. 2013, 160, 75-87.
(76) Caleman, C.; Hub, J. S.; van Maaren, P. J.; van der Spoel, D. Atomistic Simulation of Ion Solvation in Water Explains Surface Preference of Halides. Proc. Natl. Acad. Sci.
2011, 108, 6838-6842.
(77) Hantal, Gy.; Horváth, R. A.; Kolafa, J.; Sega, M.; Jedlovszky, P. Surface Affinity of Alkali and Halide Ions in Their Aqueous Solution: Insight from Intrinsic Density Analysis. J. Phys. Chem. B 2020, 124, 9884-9897.
(78) Schuler, L. D.; Daura, X.; van Gunsteren, W. F. An Improved GROMOS96 Force Field for Aliphatic Hydrocarbons in the Condensed Phase. J. Comp. Chem. 2001, 22, 1205-1218.
(79) van Gunsteren, W. F.; Billeter, S. R.; Eising, A. A.; Hünenberger, P. H.; Krüger, P.;
Mark, A. E.; Scott, W. R. P.; Tironi, I. G. Biomolecular Simulation: The GROMOS96 Manual and User Guide; vdf Hochschulverlag A.G. an der ETH Zürich and BIOMOS b.v.: Zürich, Groningen, 1996.
(80) Berendsen, H. J. C.; Postma, J. P. M.; van Gunsteren, W. F.; Hermans, J. Interaction Models for Water in Relation to Protein Hydration. In Intermolecular Forces;
Pullman, B., Ed.; Reidel: Dordrecht, 1981, p. 331-342.
(81) Gee, M. B.; Cox, N. R.; Jiao, Y.; Bentenitis, N.; Weerasinghe, S.; Smith, P. E. A Kirkwood-Buff Derived Force Field for Aqueous Alkali Halides. J. Chem. Theory Comput. 2011, 7, 1369-1380.
(82) Berendsen, H. J. C.; Grigera, J. R.; Straatsma, T. The Missing Term in Effective pair Potentials. J. Phys. Chem. 1987, 91, 6269-6271.
(83) Åqvist, J. Ion-Water Interaction Potentials Derived from Free Energy Perturbation Simulations. J. Phys. Chem. 1990, 94, 8021-8024.
(84) Klasczyk, B.; Knecht, V. Kirkwood-Buff Derived Force Field for Alkali Chlorides in Simple Point Charge Water. J. Chem. Phys. 2010, 132, 024109-1-12.