*For correspondence:
af589@cam.ac.uk (AF);
dmglover@caltech.edu (DMG)
†These authors contributed equally to this work
Present address:‡Astra Zeneca, Cambridge, United Kingdom Competing interests:The authors declare that no competing interests exist.
Funding:See page 21 Received:26 March 2020 Accepted:11 March 2021 Published:11 March 2021 Reviewing editor: Anna Akhmanova, Utrecht University, Netherlands
Copyright Fatalska et al. This article is distributed under the terms of theCreative Commons Attribution License,which permits unrestricted use and redistribution provided that the original author and source are credited.
The dimeric Golgi protein Gorab binds to Sas6 as a monomer to mediate centriole duplication
Agnieszka Fatalska1,2,3†*, Emma Stepinac4†, Magdalena Richter1†‡, Levente Kovacs1,2, Zbigniew Pietras3, Martin Puchinger5, Gang Dong4, Michal Dadlez3, David M Glover1,2*
1Department of Genetics, University of Cambridge, Cambridge, United Kingdom;
2Division of Biology and Biological Engineering, California Institute of Technology, Pasadena, United States;3Institute of Biochemistry and Biophysics, Polish Academy of Sciences, Warsaw, Poland;4Department of Medical Biochemistry, Max Perutz Labs, Medical University of Vienna, Vienna, Austria;5Department of Structural and Computational Biology, Max Perutz Labs, University of Vienna, Vienna, Austria
Abstract
The duplication and ninefold symmetry of theDrosophilacentriole requires that the cartwheel molecule, Sas6, physically associates with Gorab, a trans-Golgi component. How Gorab achieves these disparate associations is unclear. Here, we use hydrogen–deuterium exchange mass spectrometry to define Gorab’s interacting surfaces that mediate its subcellular localization. We identify a core stabilization sequence within Gorab’s C-terminal coiled-coil domain that enables homodimerization, binding to Rab6, and thereby trans-Golgi localization. By contrast, part of the Gorab monomer’s coiled-coil domain undergoes an antiparallel interaction with a segment of the parallel coiled-coil dimer of Sas6. This stable heterotrimeric complex can be visualized by electron microscopy. Mutation of a single leucine residue in Sas6’s Gorab-binding domain generates a Sas6 variant with a sixteenfold reduced binding affinity for Gorab that cannot support centrioleduplication. Thus, Gorab dimers at the Golgi exist in equilibrium with Sas6-associated monomers at the centriole to balance Gorab’s dual role.
Introduction
Centrioles are the ninefold symmetrical microtubule arrays found at the core of centrosomes, the bodies that organize cytoplasmic microtubules in interphase and mitosis. Centrioles also serve as the basal bodies of both non-motile and motile cilia, and flagellae. The core components of centrioles and the molecules that regulate their assembly are highly conserved (Brito et al., 2012). The initia- tion of centriole duplication first requires that the mother and daughter pair of centrioles at each spindle pole disengage at the end of mitosis. Plk4 then phosphorylates Ana2 (Drosophila)/STIL (human) at its N-terminal part, which promotes Ana2 recruitment to the site of procentriole forma- tion, and at its C-terminal part, which enables Ana2 to bind and thereby recruit Sas6 (Dzhindzhev et al., 2017;Dzhindzhev et al., 2014;McLamarrah et al., 2018;Ohta et al., 2014).
The ensuing assembly of a ninefold symmetrical arrangement of Sas6 dimers provides the structural basis for the ninefold symmetrical cartwheel structure at the procentriole’s core. Sas6 interacts with Cep135 and in turn with Sas4 (Drosophila)/CPAP (human), which provides the linkage to centriole microtubules (Hiraki et al., 2007;Jerka-Dziadosz et al., 2010;Kohlmaier et al., 2009;Lin et al., 2013;Roque et al., 2012;Schmidt et al., 2009;Tang et al., 2009).
We recently identified an unexpected requirement for the protein, Gorab, to establish the nine- fold symmetry of centrioles (Kovacs et al., 2018). Flies lacking Gorab are uncoordinated due to
basal body defects in sensory cilia, which lose their ninefold symmetry, and also exhibit maternal effect lethality due to failure of centriole duplication in the syncytial embryo. Gorab is a trans-Golgi- associated protein. Its human counterpart is mutated in the wrinkly skin disease, gerodermia osteodysplastica (Burman et al., 2010;Burman et al., 2008;Di et al., 2003;Hennies et al., 2008).
By copying a missense mutation in gerodermia patients that disrupts the association of Gorab with the Golgi, we were able to create mutantDrosophilaGorab also unable to localize to trans-Golgi.
However, this mutant form of Gorab was still able to rescue the centriole and cilia defects ofgorab null flies. We also found that expression of C-terminally tagged Gorab disrupts Golgi functions in cytokinesis of male meiosis, a dominant phenotype that can be overcome by a second mutation pre- venting Golgi targeting (Hiraki et al., 2007;Lin et al., 2013). Thus, centriole and Golgi functions of DrosophilaGorab are separable.
The Golgi apparatus both delivers and receives vesicles to and from multiple cellular destinations and is also responsible for modifying proteins and lipids. Gorab resembles a group of homodimeric rod-like proteins, the golgins, which function in vesicle tethering (Short et al., 2005). The golgins associate through their C-termini with different Golgi domains, and their N-termini both capture vesicles and provide specificity to their tethering (Gillingham and Munro, 2016). There is known redundancy of golgin function, reflected by the overlapping specificity of the types of vesicles they capture (Wong and Munro, 2014). Gorab is rapidly displaced from thetrans-side of the Golgi appa- ratus by Brefeldin A, suggesting that its peripheral membrane association requires ARF-GTPase activity (Egerer et al., 2015).
Previous studies of human Gorab indicated its ability to form a homodimer in complex with Rab6 and identified its putative coiled-coil region as a requirement to localize at the trans-Golgi (Egerer et al., 2015;Witkos et al., 2019). Our own studies on itsDrosophilacounterpart supported Gorab’s ability to interact with itself, potentially through the predicted coiled-coil motif. However, we also found this region to overlap with the region required for Gorab’s interaction with Sas6 (Kovacs et al., 2018). These findings raised the questions of how Gorab’s putative coiled-coil region could facilitate interactions with the Golgi, on the one hand, and its Sas6 partner, on the other. To address this, we have employed hydrogen–deuterium exchange (HDX) in conjunction with mass spectrometry (MS). HDX enables the identification of dynamic features of protein by monitor- ing the exchange of main chain amide protons to deuteria in solution. Here, we have used HDX-MS to monitor the retarded exchange of amide protons localized between interacting regions of Gorab and Sas6 to identify the interacting surfaces within the Gorab–Sas6 complex. Together with other biophysical characterizations, this has revealed that Gorab is able to form a homo-dimer through its coiled-coil region but that it interacts as a monomer with the C-terminal coiled-coil of Sas6. Mutation of a critical amino acid in Sas6’s Gorab-binding domain generates a variant of Sas6 with a sixteenfold reduced binding affinity for Gorab that is no longer able to support centriole duplication.
Results
Gorab dimerizes through its C-terminus to achieve Golgi localization
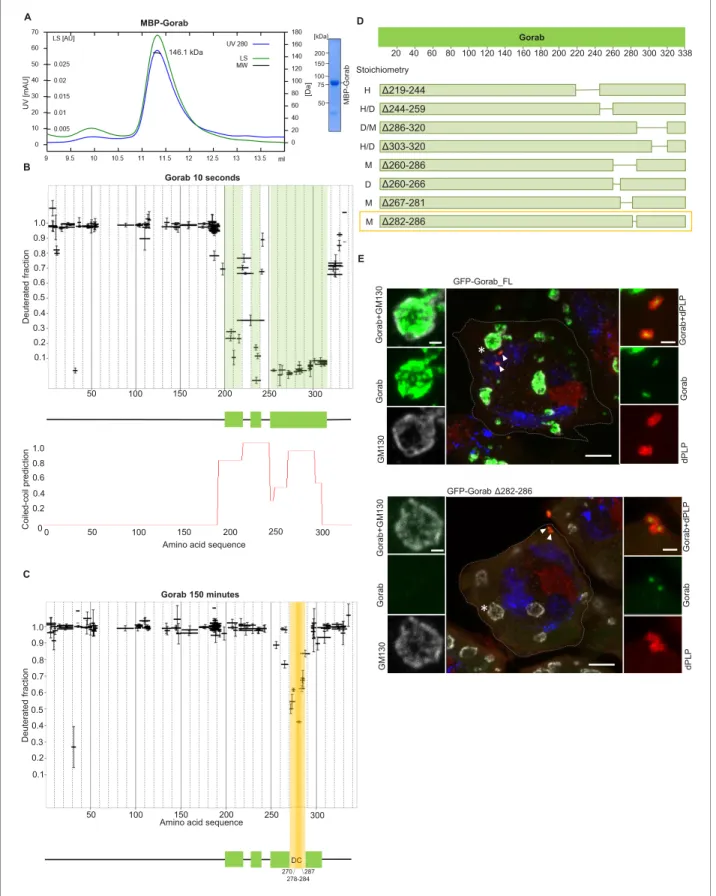
A previous study has identified a Golgi-targeting domain region of human Gorab from amino acids (aa) 200–277 (Egerer et al., 2015). This region, comprising predominantly a putative coiled-coil sequence, corresponds to aa 246–323 ofDrosophilaGorab. To determine whether this region con- ferred the ability to homodimerize a characteristic of the golgins, we first wished to determine the oligomeric state of Gorab in solution. To this end, we expressed N-terminally MBP-taggedDrosoph- ila melanogaster Gorab in Escherichia coli, affinity purified the recombinant protein on amylose resin, and carried out size exclusion chromatography coupled with multiangle light scattering (SEC- MALS) to determine its molecular mass (Mw) (Figure 1A). Whereas the theoretical mass of mono- meric MBP-Gorab is 79.4 kDa, SEC-MALS indicated the Mw of the protein eluting in the major peak as 146.1 kDa. Thus, similar to other golgins, MBP-Gorab behaves as a dimer in solution.
To determine regions within Gorab that might be structured to support its homodimerization, we then performed HDX-MS on Gorab by incubation in D2O buffer for varying periods of time. The HDX pattern of Gorab after 10 s incubation with D2O buffer indicated almost complete exchange of hydrogen with deuterium in the N-terminal (aa 1–200) and very C-terminal parts (aa 318–338) of the protein, indicating high flexibility (Figure 1B, Figure 1—figure supplement 1A). Restricted
Amino acid sequence
50 100 150 200 250 300
Gorab 150 minutes
0.1 0.2 0.3 0.4 0.5 0.6 0.7 0.8 0.9 1.0
DC
50 100 150 200 250 300
Gorab 10 seconds
0.1 0.2 0.3 0.4 0.5 0.6 0.7 0.8 0.9 1.0 A
B
D
E
50 75 100 150 200 [kDa]
MBP-Gorab
Amino acid sequence 0.2
0 0.4 0.6 0.8 1.0
0 50 100 150 200 250 300
GFP-Gorab Δ282-286
*
*
GFP-Gorab_FL
*
*
Δ219-244 Δ244-259 Δ286-320 Δ303-320 Δ260-286 Δ260-266 Δ267-281 Δ282-286 Stoichiometry
H H/D D/M H/D M D M M
20 40 60 80 100 120 140 160 180 200 220 240 260 280 300 320 338 Gorab
C
146.1 kDa
278-284 DC 270 287
Figure 1.Gorab dimerizes through its C-terminal part to achieve Golgi localization. (A) Size exclusion chromatography-multiple angle light scattering (SEC-MALS) of Gorab. Blue: absorbance at 280 nm; green: light scattering (LS); short black line: molecular mass (Mm) of MBP-Gorab. Mm of MBP- Gorab monomer, 79.4 kDa. SDS-PAGE showing full-length MBP-Gorab after SEC. (B) Pattern of hydrogen–deuterium exchange (HDX) in Gorab peptides following 10 s incubation with deuterium oxide (heavy water). Black bars on Woods plots represent proteolytic peptides identified by mass Figure 1 continued on next page
deuterium exchange in the C-terminal part suggested three distinct protected, structured regions (aa 200–220, 230–240, and 252–315) matching the coiled-coil predictions by the COILS program (Lupas et al., 1991). This suggests that the dimerization of Gorab might be driven by coiled-coil interactions on its C-terminus (Figure 1B). SEC-MALS of two Gorab C-terminal trunca- tions (aa 191–338 and 191–279) confirmed the importance of the aa 279–338 region in the dimer for- mation (Figure 1—figure supplement 1B). In the HDX experiment, longer periods of incubation identified regions permitting ‘breathing’ of this secondary structure (Figure 1C, Figure 1—figure supplement 1A), such that after 150 min only the region between aa 270–287, and especially aa 278–284, remained protected from the deuterium exchange. The high protection shown by this region is most likely to reflect regions of stability around the core of Gorab’s dimerization domain (Figure 1C).
It is also possible that the regions of stability detected in the above experiment may be caused by allosteric changes coming from interactions elsewhere. Therefore, to test the relevance of the aa 270–287 fragment for homodimerization, we designed a set of MBP-Gorab constructs harboring deletions within the C-terminal part and determined their molecular mass using SEC-MALS. This revealed that the aa 260–286 region is essential for dimer formation (Figure 1D, Figure 1—figure supplement 2) in accord with the findings of HDX-MS. Moreover, SEC-MALS data revealed that deletions within other parts of the C-terminal domain disrupt the dimeric structure of MBP-Gorab and result in the formation of higher-order structures, or mixtures of these with monomers (Figure 1D, Figure 1—figure supplement 2). This suggests that the entire C-terminal domain (aa 200–320) is organized in such a way to permit dimerization and that even minor changes within the sequence lead to structural instability.
To test the consequence of disrupting dimerization in vivo, we created a transgene encoding Gorab with a 282–286 aa deletion. We then generated transgenic flies with full-length (FL) Gorab or GorabD282–286 under the control of constitutive poly-ubiquitin promoter, allowing moderately ele- vated expression of the given transgene. We used a site-specific integrase system to integrate them into the same genomic location so that they would be expressed at a similar level. An eGFP tag on the N-terminus of the transgenic protein allowed us to determine its subcellular localization in pri- mary spermatocytes and larval imaginal discs. In agreement with our earlier findings (Kovacs et al., 2018), the vast majority of wild-type eGFP-Gorab localized in the position of the trans-Golgi, inside the Golgi cisternae and surrounded by the GM130 cis-Golgi marker, in large primary spermatocytes (Figure 1E). Accordingly, the majority of FL eGFP-Gorab colocalized with Golgin-245 trans-Golgi marker as we observed in primary spermatocytes and wing imaginal discs and, in accord with our Figure 1 continued
spectrometry (MS) and positioned in relation to the Gorab amino acid sequence. The Y-axis shows fraction of deuteration compared to maximum level of measured deuteration. Mean of three experiments is shown. Error bars represent standard deviations. The N-terminal part of Gorab is highly flexible, whereas its C-terminal part has three protected regions (green blocks) that align with coiled-coil regions predicted by COILS (Lupas et al., 1991) (C) HDX pattern after 150 min incubation with D2O. The region between aa 270–287 (highlighted in yellow) retains highly protected, and the region aa 278–
284 with the highest protection is termed the dimerization core (DC). (D) Schematic showing outcome of SEC-MALS with Gorab having indicated deletions. H: higher-order structure; D: dimer; and M: monomer. Red box surrounds Gorab variant with shortest deletion (D282–286) that disrupts dimer formation corresponding to most protected region identified by HDX-MS (yellow). SEC-MALS data for each construct is presented inFigure 1—figure supplement 2(E) Localization of full-length andD282–286 Gorab (green) in G2 phase primary spermatocytes of adult males. N-terminally GFP-tagged Gorab transgenes were inserted in the same genomic location to ensure comparable expression by a constitutive poly-ubiquitin promoter.
Immunostainings were performed with anti-GM130 (cis-Golgi marker, gray) and anti-dPLP (centrosome marker, red) antibodies. DAPI staining (blue) identifies the characteristic three-lobed nucleus of primary spermatocytes prior to meiosis. The dashed line outlines the border of a single
spermatocyte. Golgi, indicated by asterisks, and centrosomes, by arrowheads, are shown in insets. In total, 30 primary spermatocytes from four transgenic testes expressing full-length Gorab and 32 primary spermatocytes from four testes expressing GorabD282–286 were imaged. All showed the same Gorab distribution. Scale bar: 5mm; scale bar in insets: 1mm.
The online version of this article includes the following source data and figure supplement(s) for figure 1:
Figure supplement 1.Dimerization of Gorab through interactions between the coiled-coil domains in its C-terminal region.
Figure supplement 2.Requirements of regions of the Gorab coiled-coil region for dimerization as revealed by size exclusion chromatography (SEC) coupled with multiangle light scattering of Gorab deletions.
Figure supplement 3.GorabD282–286 localizes to centrioles but not to the Golgi in mitotic cells of imaginal discs.
Figure supplement 3—source data 1.Percentage of flies climbing 5 cm in 15 s in three independent biological replicates of the indicated genotypes.
previous findings, a small fraction of FL Gorab was recruited to centrosomes (Figure 1E, Figure 1—
figure supplement 3). By contrast, Gorab D282–286 did not localize to the Golgi but retained its centrosomal localization both in primary spermatocytes and in wing disc cells (Figure 1E, Figure 1—
figure supplement 3). In line with its centriolar localization, Ubq-GorabD282–286 was able to fully rescue the coordination, viability, and fertility defects ofgorabmutants (Kovacs et al., 2018). This indicates that dimerization of Gorab is required for its trans-Golgi localization but not for its centrio- lar localization and function.
Gorab interacts with Sas6 through its C-terminus and forms a heterotrimeric complex
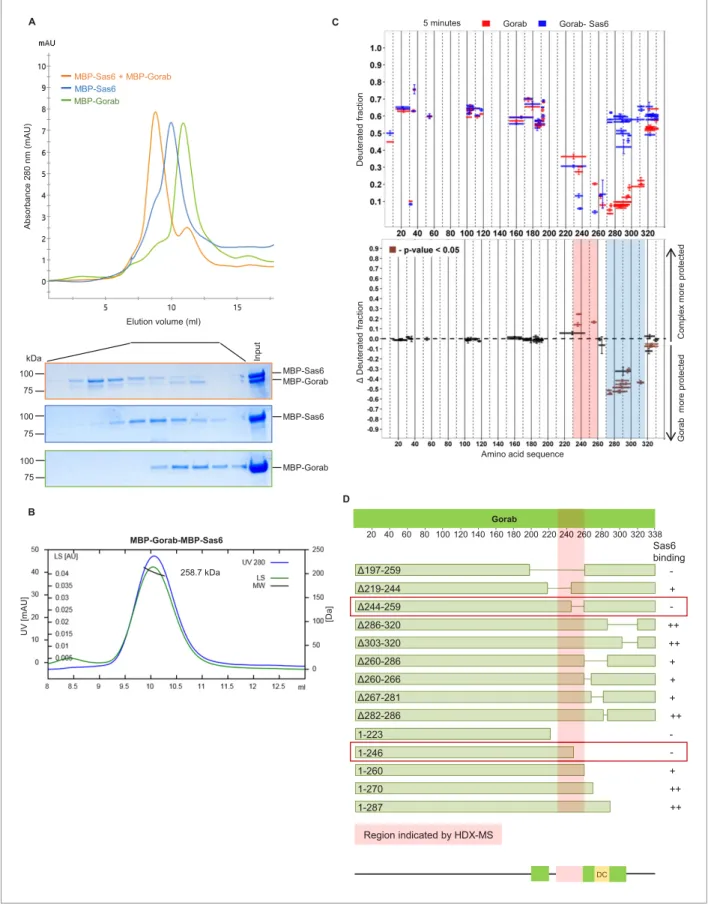
The above findings indicated that Gorab localizes to the centrosome as monomer, leading us to investigate Gorab’s oligomeric state in relation to its previously reported interaction with Sas6 (Kovacs et al., 2018). We therefore set out to reconstitute a complex between these two pro- teins in vitro that we could analyse using SEC and SEC-MALS (Figure 2A, B). SEC confirmed that when mixed in a molar ratio 1 part Gorab : 2 parts Sas6, a stable complex was formed (Figure 2A).
MALS measurements indicated the molecular mass of this complex eluting in the major peak to be 258.7 kDa (±0.061%), which would correspond to a heterotrimer of homodimeric MBP-Sas6 and monomeric MBP-Gorab, whose theoretical mass is 272.2 kDa (Figure 2B). We also confirmed heter- otrimeric complex formation with Sas6 and Gorab truncations (Sas6 CC [338–472 aa] + Gorab CC short [191–279 aa], and MBP-Sas6 CC short [404–463 aa] + MBP-Gorab CC short [191–279 aa]) using SEC-MALS (Figure 2—figure supplement 1A). This indicates that Gorab is a dimer in solution but binds Sas6 dimer as a monomer.
To determine the region of Gorab that interacts with Sas6, we performed two sets of HDX-MS measurements: Gorab alone and Gorab in complex with Sas6 (Figure 2C, Figure 2—figure supple- ment 1B). By analyzing the HDX patterns for Gorab, we could observe two distinct changes in deu- teration levels. The 230–260 aa segment became slightly more stable when Gorab was in complex with Sas6 than when on its own (Figure 2C, pink box,Figure 2—figure supplement 1B). In contrast, the 270–315 aa segment appeared to be destabilized (Figure 2c, blue box,Figure 2—figure sup- plement 1B). It is most likely that the 230–260 aa segment of Gorab, which is stabilized upon Sas6 binding, represents the interaction surface between the two proteins. As Gorab appears to dissoci- ate to a monomer during complex formation with Sas6, this suggests that the aa 270–315 segment at the dimerization core (Figure 1C, D) becomes destabilized. To test the importance of the region of Gorab indicated by HDX-MS to form an interaction surface with Sas6, we performed binding assays between Sas6 and a series of deletions and truncations of Gorab (Figure 2D). This revealed GorabD244–259 aa as the shortest deletion that gives the maximal observed decrease in Sas6 bind- ing. The flanking deletions, such asD219–244 aa andD260–286 aa, could still bind Sas6 but weakly.
C-terminal truncations showed a weak decrease in binding only when they removed sequence between 260 and 270 aa and a strong decrease in binding if they removed residues between 246 and 260 aa. These findings accord with the HDX data and strongly suggest that the 244–260 aa region of Gorab binds strongly to Sas6 and that weaker interacting surfaces extend between aa 219–244 and aa 260–270 (Figure 2D,Figure 2—figure supplement 2A, B).
Sas6 interacts with Gorab via its C-terminus
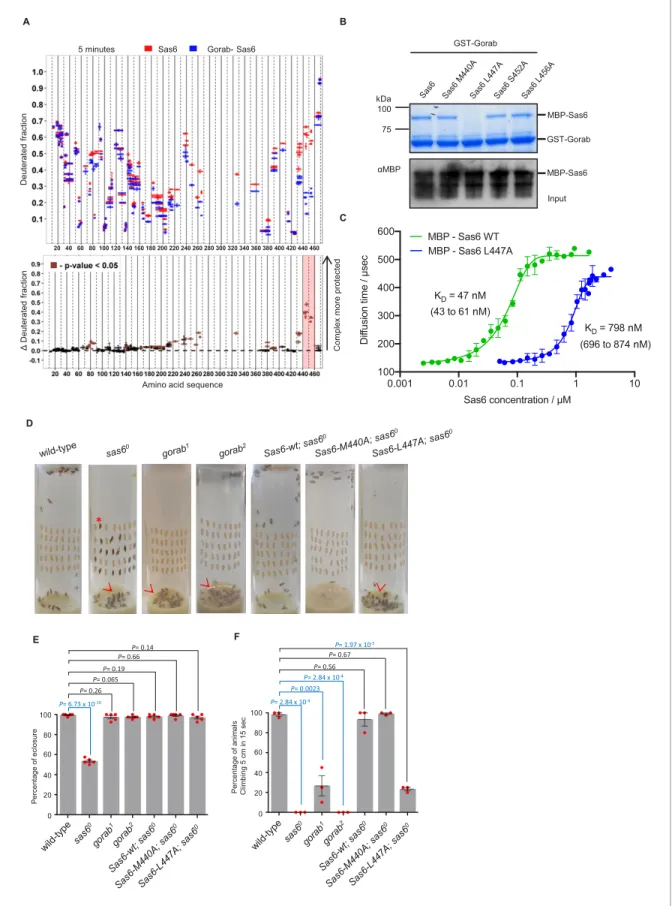
We then wished to determine the region within Sas6 that interacts with Gorab. To do so, we moni- tored HDX of Sas6 alone and when in complex with Gorab. We observed clear differences in deuter- ation level within 20 residues (aa 440–460) towards the C-terminus of Sas6 that showed increased stability when in complex with Gorab (Figure 3A, Figure 3—figure supplement 1A). We also observed less pronounced protection in peptides from other regions. However, our previous study showed that the Sas6 region aa 351–472 (Kovacs et al., 2018) is sufficient to bind Gorab. Moreover, we found that the Sas6 segment aa 404–463 forms a stable complex with the 191–279 aa segment of Gorab (Figure 2—figure supplement 1A). We therefore concluded that the Sas6 region aa 440–
460, showing the highest protection from HDX upon Gorab binding, lies on the interaction surface.
This led us to attempt to identify single residues within the aa 440–460 region that are essential for this interaction. A multiple sequence alignment of this region of Sas6 from various species (Fig- ure 3—figure supplement 1B) identified highly conserved aa that we mutated to alanine residues
a C
B
D MBP-Sas6 kDa
100 75
100 75
100 75
MBP-Gorab MBP-Gorab
MBP-Sas6 Elution volume (ml)
MBP-Gorab
MBP-Sas6 + MBP-Gorab MBP-Sas6
DC
20 40 60 80 100 120 140 160 180 200 220 240 260 280 300 320 338
Δ197-259 Δ219-244 Δ244-259 Δ286-320 Δ303-320 Δ260-286 Δ260-266 Δ267-281 Δ282-286
Gorab
1-223 1-246 1-260 1-270 1-287
Sas6 binding
Region indicated by HDX-MS
- + - ++
++
+ + + ++
- - + ++
++
DC 240 260 MBP-Gorab-MBP-Sas6
258.7 kDa
A 5 minutes Gorab Gorab- Sas6
Amino acid sequence
Figure 2.Gorab interacts with Sas6 through its C-terminal part and forms a heterotrimeric complex. (A) Size exclusion chromatography (SEC) of Gorab, Sas6, and Gorab–Sas6 complex. Green: absorbance 280 nm of MBP-Gorab; blue: absorbance 280 nm of MBP-Sas6; yellow: absorbance at 280 nm of MBP-Gorab-MBP-Sas6 complex. Lower panel: SDS-PAGE of SEC fractions. (B) Size exclusion chromatography coupled with multiangle light scattering of Gorab–Sas6 complex. Blue: absorbance at 280 nm; green: light scattering; black: molecular mass (Mm) of MBP-Gorab-MBP-Sas6 complex. Mm of Figure 2 continued on next page
(M440A, L447A, S452A, L456A). We then assessed the consequences for interaction with Gorab by in vitro binding assays (Figure 3B, Figure 3—figure supplement 2A) and SEC (Figure 3—figure supplement 2B). These experiments indicated that Sas6 L447A was not able to bind Gorab in vitro.
To further confirm this, we next performed fluorescence correlation spectroscopy (FCS), enabling us to measure the change of diffusion times and therefore diffusion coefficients of one fluorescently labeled molecule upon binding to its non-fluorescent binding partner. In this case, we mixed the fluorescently labeled MBP-Gorab coiled-coil fragment (aa 191–279) with non-fluorescent MBP- wild type Sas6 or the Sas6 L447A mutant, measured the change in the diffusion time with increasing Sas6 concentrations, and determined the dissociation constant (KD) of the Gorab–Sas6 binding (Figure 3C). To control for the ability of wild-type Sas6 dimers to oligomerize through their head-to- head interactions, we also tested Gorab binding to the Sas6-F143D mutant, which abolishes higher oligomerization and found no significant differences in the outcome (Figure 3—figure supplement 3A). Our measurements revealed that the KDof Gorab’s interaction with wild-type Sas6 was in the low nanomolar range of 47 nM, but that the binding strength to Sas6 L447A mutant was 16 times weaker (KD = 798 nM). We next investigated the impact of mutations in the aa 440–460 region of Sas6 on its ability to self-associate. We found that Sas6-wild type, Sas6-M440A, Sas6-L447A, Sas6- S452A, and Sas6-L456A all displayed the same elution profile in SEC (Figure 3—figure supplement 3B). This indicates that all of the Sas6 point mutants behave like Sas6-wild type in being able to form homodimers. Moreover, L447, which is located at the C-terminal region of the coiled coil of Sas6, is predicted to lie at position ‘a’ of the ‘a-g’ heptad repeats with M440 lying in a similar posi- tion (Figure 3—figure supplement 4A, B). Yet L447A prevents Gorab binding, whereas M440A does not. Our modeling analysis using CCBuilder 2.0 (Wood and Woolfson, 2018) predicts that mutants M440A and L447A have a BUDE energy of –717 and –714, respectively, which is very similar to that of Sas6-wild type ( 724) (Figure 3—figure supplement 4C). This is consistent with the con- firmed dimeric state of all the Sas6 constructs (Figure 3—figure supplement 3B). Notably, however, residue L447 is closer to the C-terminus of the predicted coiled-coil of Sas6 than M440, and the downstream two heptads following L447 may not hold the dimer tightly together as only one of the residues at positions ‘a’ and ‘d’ of these two heptads, that is, I457, is hydrophobic. We therefore conclude that the L447A does not prevent Sas6 from forming a homodimer but the local structure around L447 might be partially perturbed in the mutant L447A. Such subtle change in the local region seems to be sufficient to prevent the interaction of Sas6-L447A with Gorab.
To determine the consequences of the Sas6-L447A mutation for interactions with Gorab in vivo, we created transgenic flies expressing either wild-type Sas6 or the Sas6-L447A mutant under the control a GAL4-inducible UAS regulatory sequence. We also generated transgenes of Sas6-M440A as this mutation is predicted to lie adjacent to L447 in the Sas6 coiled coil but does not affect Gorab-binding ability. The transgenes were integrated into the same genomic location using a site- specific integrase system to ensure their expression at comparable levels. The expression of these transgenes was induced either by neuronal elav-GAL4 or by ubiquitous Act5C-GAL4 driver in asas6 null mutant background. We first assessed the ability of Sas6-L447A to rescue the coordination Figure 2 continued
MBP-Sas6 monomer is 96.4 kDa; Mm of MBP-Gorab monomer, 79.4 kDa. (C) Upper panel: hydrogen–deuterium exchange (HDX) pattern of Gorab in complex with Sas6 following 5 min incubation with D2O. Gorab peptides alone (red bars) and when in complex with Sas6 (blue bars). X-axis: position of peptides in amino acid sequence; Y-axis: fraction of deuteration compared to maximum level of calculated deuteration. Mean of two experiments is shown. Error bars show both values measured. Lower panel: differences between deuteration of Gorab peptides alone and in complex with Sas6, derived by subtraction of deuteration levels shown in the upper panel. Brown bars indicate peptides for which the differences measured in repeated experiments satisfied the Welsht-test with p<0.05. Blue region: peptides that are more protected from deuterium exchange when Gorab is not in the complex (aa 270–315); red region: peptides that are more protected when Gorab is in complex with Sas6 (aa 230–260). (D) Schematic of ability Gorab deletions/truncations to bind Sas6 in vitro; –: no binding; +: binding; ++: strong binding. Red highlighted box: region identified by HDX-MS (aa 230–
260). Red boxes: region of Gorab essential for Sas6 binding (aa 244–260). Individual results for each construct are presented inFigure 2—figure supplement 2A, B.
The online version of this article includes the following source data and figure supplement(s) for figure 2:
Source data 1.Uncropped SDS-PAGE corresponding toFigure 2A.
Figure supplement 1.Regions of Gorab required for Sas6 binding.
Figure supplement 2.Consequences of deletion or truncation of Gorab for Sas6 binding.
A B
5 minutes Sas6 Gorab- Sas6
Amino acid sequence
C
MBP-Sas6 GST-Gorab
MBP-Sas6 αMBP
Input kDa
100 75
GST-Gorab
D
*
E
P= 6.73 x 10⁻¹⁰ P= 0.26
P= 0.19
0 60
20 40 80 100
Percentage of eclosure
P= 0.14
P= 0.065 P= 0.66
F
P= 2.84 x 10⁻⁴ P= 0.0023
P= 0.56
0 60
20 40 80 100
Percentage of animals Climbing 5 cm in 15 sec
P= 1.97 x 10⁻⁵
P= 2.84 x 10⁻⁴ P= 0.67 20 40 60 80 100 120 140 160 180 200 220 240 260 280 300 320 340 360 380 400 420 440 460
Figure 3.Sas6 interacts with Gorab through its C-terminal region. (A) Upper panel: hydrogen–deuterium exchange pattern of Sas6 in complex with Gorab following 5 min incubation with D2O. Sas6 peptides alone (red bars) and when in complex with Gorab (blue bars). X-axis: position of peptides in amino acid sequence; Y-axis: fraction of deuteration compared to maximum level of calculated deuteration. Mean of two experiments is shown. Error bars show both values measured. Lower panel: differences between deuteration of Sas6 peptides alone and in complex with Gorab, derived by Figure 3 continued on next page
phenotypes of thesas6 nullmutant raised at 25˚C (Figure 3D–F). Pharatesas6 nulladults are unco- ordinated to the extent that only about 50% of pupae can eclose from the pupal case and the ones that do emerge are unable to complete our climbing test (to scale within 15 s). These mutant pheno- types were completely rescued by the elevated expression of wild-type or M440A Sas6 transgenes (Figure 3D–F). In contrast, Sas6 L447A was able to rescue the eclosion phenotype of thesas6 null and could only partially the coordination phenotype such that 30% of these flies were able to pass the climbing test (Figure 3D–F, Video 1). If this reflected failure of Sas6-L447A to bind Gorab, then the phenotype should be similar to that of gorab mutants. When gorab1 and gorab2 flies are raised at 29˚C, both mutant alleles display similarly severe uncoordination defects and the flies are completely unable to climb. At 25˚C, however, gorab2flies showed a similarly severe total loss of coordination, whereas gorab1 flies were moderately uncoordinated with around 25% being able to climb 5 cm in 15 s (Figure 3F). Flies with heteroallelic combinations ofgorab1andgorab2showed intermediate phe- notypes, more similar togorab2. Thus the extent of rescue of the coordination phenotype of the sas6 null by overexpression of Sas6 L447A was reminiscent of the gorab1 hypomorph (Figure 3F, Videos 1and2) and in accord with Figure 3 continued
subtraction of deuteration levels shown in the upper panel. Brown bars indicate peptides for which the differences measured in repeated experiments satisfied the Welsht-test with p<0.05. Red box: peptides protected most from exchange when Sas6 is in complex with Gorab (aa 440–460). (B) Pull- down assay for wild type (WT) and point mutants of Sas6 with Gorab. Upper panel: SDS-PAGE of the binding assay in which Gorab is the bait and WT and point mutants of Sas6 are the prey. Lower panel: western blot showing input of WT and point mutants of Sas6. Leucine 447 in Sas6 is essential for Gorab binding. (C) Fluorescence correlation spectroscopy measurements of fluorescently labeled MBP-Gorab (aa 191–279) binding non-labeled MBP- Sas6 WT (green) or MBP-Sas6 L447A mutant (blue). Mean values of the dissociation constants for Gorab–Sas6 WT and Gorab–Sas6 L447A are 47 and 798 nM, respectively, with 95% confidence intervals (brackets). Error bars show standard deviation of three independent measurements. (D) Eclosion phenotype of indicated mutants andsas6onull flies expressing the indicated transgenes. Pupae (40/vial) were aligned on the side of the vial and left to eclose. Asterisk exemplifies an individual that died at the pharate adult stage within the pupal case. Arrowheads point to eclosed but uncoordinated adults stuck in media. Expression ofSas6-wild-type, Sas6-M440A,andSas6-L447Aconstructs was induced in sas6oneurons by theelav-GAL4driver.
Flies were raised and the experiments were performed at 25˚C. Ubiquitous expression of the constructs driven byAct5C-GAL4gave similar eclosion rates (not shown) (E). Quantification of eclosion rate of flies. Datapoints represent percentage of eclosed adults from each replica. Means and standard errors are shown for N = 5 independent biological replicates per genotype; n = 40 flies investigated in each replica. p-Values of two-tailed, unpairedt- tests are shown. p-Value in blue indicates significant difference (95% confidence interval). (F) Climbing assays of indicated mutants andsasoflies expressing the indicated transgenes. The expression ofSas6-WT, Sas6-M440A,andL447Arescue constructs was induced in sas6onull neurons by the elav-GAL4driver. Ubiquitous expression from theAct5C-GAL4driver gave similar eclosion rates (not shown). Cohorts of 15 flies raised at 25˚C were scored for the number of individuals able to climb 5 cm in 15 s after being tapped down to bottom of vial. Means and standard errors are shown for N = 3 independent experiments per genotype; n = 15 flies investigated in each experiment. p-Values of two-tailed, unpaired t-tests are shown. p-Value in blue indicates significant difference (95% confidence interval).
The online version of this article includes the following source data and figure supplement(s) for figure 3:
Source data 1.Table representing three independent fluorescence correlation spectroscopy (FCS) measurements for each of the complex formations:
between Gorab and Sas6 wild type (WT); and Gorab and Sas6 L447A.
Source data 2.Percentage of flies eclosed in five independent biological replicates of the indicated genotypes.
Figure supplement 1.Regions of Sas6 interacting with Gorab.
Figure supplement 2.Consequences of point mutations in Sas6 for its interactions with Gorab.
Figure supplement 2—source data 1.Uncropped SDS-PAGE corresponding toFigure 3—figure supplement 2B.
Figure supplement 3.Sas6–Gorab interactions.
Figure supplement 3—source data 1.Table representing three independent fluorescence correlation spectroscopy (FCS) measurements of complex formation between Gorab and Sas6 F143D.
Figure supplement 4.Structural analyses of the coiled coil of Sas6.
Video 1.Climbing test ofsas6oflies with and without indicated Sas6 variant transgenes. Flies were transferred into assay vials without anesthesia and let them accommodate for 15 min, after which they were tapped down, and their climbing ability was assessed.
https://elifesciences.org/articles/57241#video1
the greatly reduced ability of Sas6-L447A to bind Gorab.
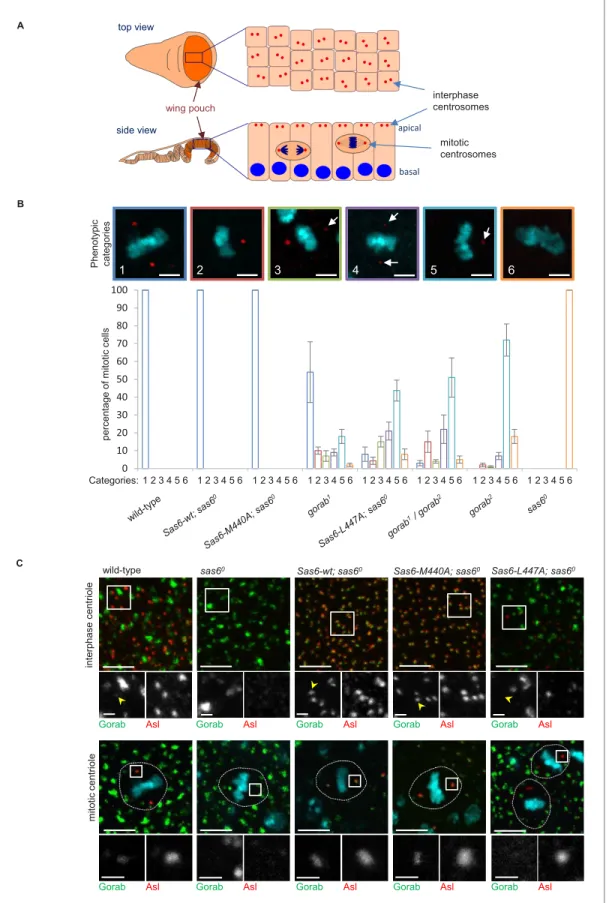
To analyze the relative consequences of the above mutations on centrosome number, we used late third larval instar wing discs as a model.
The wing pouch part of the disc (the region that will form the wing blades of adults) is formed by columnar epithelial cells, in which interphase cen- trioles are apically localized and can be imaged and quantified on a single plane (Figure 4A). As the cells of this layer enter mitosis, they round up and move deeper within the epithelium allowing mitotic centrioles to be imaged at the spindle poles on a different plane (Figure 4A). We found that the elevated expression of both wild-type Sas6 and the Sas6-M440A transgene from the Act5C-GAL4 driver fully rescued the centriole loss of sas6 null larvae in interphase cells (Fig- ure 4—figure supplement 1). By contrast, Sas6 L447A gave only partial rescue restoring only 8% of centriole numbers. This compares to thegorab2 null mutant in which centrosomes are absent and thegorab1hypomorph, in which centrosome num- bers are reduced to around 35% of wild type. Rescue of thesas6null by Sas6-L447A restored cen- trosome numbers to a similar level as in the heteroallelic gorab1/gorab2 combination, which is strongly hypomorphic (Figure 4—figure supplement 1). We found a similar distribution of centro- somes in the mitotic wing disc cells of the above flies (Figure 4B). Whereas expression of wild-type Sas6 or Sas6-M440A totally rescued the complete mitotic centrosome loss of thesas6null, expres- sion of Sas6-L477A resulted in partial rescue in which we observed several phenotypic categories (Figure 4B): (1) mitotic cells with two normal centrosomes, (2) cells with a single normal centriole, (3) cells with two centrioles with one showing reduced asterless (Asl) and absent Rcd4 staining (Fig- ure 4—figure supplement 1C), (4) cells with two centrioles with both showing such reduced stain- ing, (5) cells with only one centriole having reduced staining, and (6) cells with no centrioles. The distribution of cells exhibiting these phenotypes indicated that expression of Sas6 L447A in thesas6 null background resulted in a phenotype most similar to that of heteroallelicgorab1/gorab2flies or gorab2null flies. Thus, the consequences of Sas6-L447A upon centrosome number accord with the protein having reduced ability to bind Gorab.
If the above interpretation is correct, then Sas6-M440A should still able to recruit Gorab to the centrosome in vivo, whereas Sas6-L447A should not. This led us to determine how Sas6-L447A would affect Gorab localization in wing discs. To this end, we generated fly lines giving constitutive expression of GFP-tagged wild-type Gorab from the poly-ubiquitin promoter and wild-type Sas6, Sas6-M440A, or Sas6-L447A from the UAS promoter driven by Act5C-GAL4. We then stained wing discs to reveal the centriole protein Asl and monitored localization of GFP-Gorab in both interphase and mitotic centrosomes (Figure 4C). Asl staining revealed centrosomes to be absent insas6null discs and rescued by either wild-type Sas6 or Sas6-M440A in both interphase and mitotic cells (Figure 4C). In all cases, Gorab could be detected on these rescued centrosomes. We were, how- ever, unable to detect Gorab on the rare centrosomes present following expression of Sas6-L447A in thesas6 null background irrespective of the intensity of Asl or Rcd4 staining (Figure 4—figure supplement 1C, n = 243 centrioles counted in total). Thus, Sas6-L447A binds Gorab extremely poorly in vitro and is unable to recruit Gorab onto the centriole in vivo, a property that is associated with dramatically reduced centriole duplication even though Sas6 L447A is still able to localize to the centrioles (Figure 4—figure supplement 1D).
Together, these results show that the L447-dependent interaction of Sas6 with Gorab mediates Gorab’s association with the centrosome, and as a consequence, the phenotype of Sas6-L447A strongly resembles that of agorabstrong hypomorph.
Video 2.Climbing test ofgorabmutant flies. Flies were transferred into assay vials without anesthesia and let them accommodate for 15 min, after which they were tapped down, and their climbing ability was assessed.
https://elifesciences.org/articles/57241#video2
top view
side view
interphase centrosomes
mitotic centrosomes wing pouch
0 10 20 30 40 50 60 70 80 90 100
percentage of mitotic cells
1 2 3 4 5 6 1 2 3 4 5 6 1 2 3 4 5 6 1 2 3 4 5 6 1 2 3 4 5 6 1 2 3 4 5 6 1 2 3 4 5 6 1 2 3 4 5 6
1 2 3 4 5 6
A
B
Categories:
Phenotypic categories
apical
basal
wild-type
interphase centriolemitotic centriole
Gorab Asl Gorab Asl Gorab Asl Gorab Asl Gorab Asl
Gorab Asl Gorab Asl Gorab Asl Gorab Asl Gorab Asl
C
sas60 Sas6-wt; sas60 Sas6-M440A; sas60 Sas6-L447A; sas60
Figure 4.Consequences of Sas6 L447A upon Gorab recruitment. (A) Schematic showing the organization of centrosomes in columnar wing disc epithelia in wandering late third instar larvae. Centrosomes (red dots) localize to the apical surface of interphase cells, whereas nuclei (blue) have a basal localization. Mitotic cells round up and become localized between the apical and basal surfaces. Localization and quantification was performed on the middle part of the wing pouch (orange zone) of the disc. (B) Centriolar phenotype of the indicatedsas6andgorabmutants andsas6mutants Figure 4 continued on next page
Gorab undergoes an antiparallel interaction with Sas6
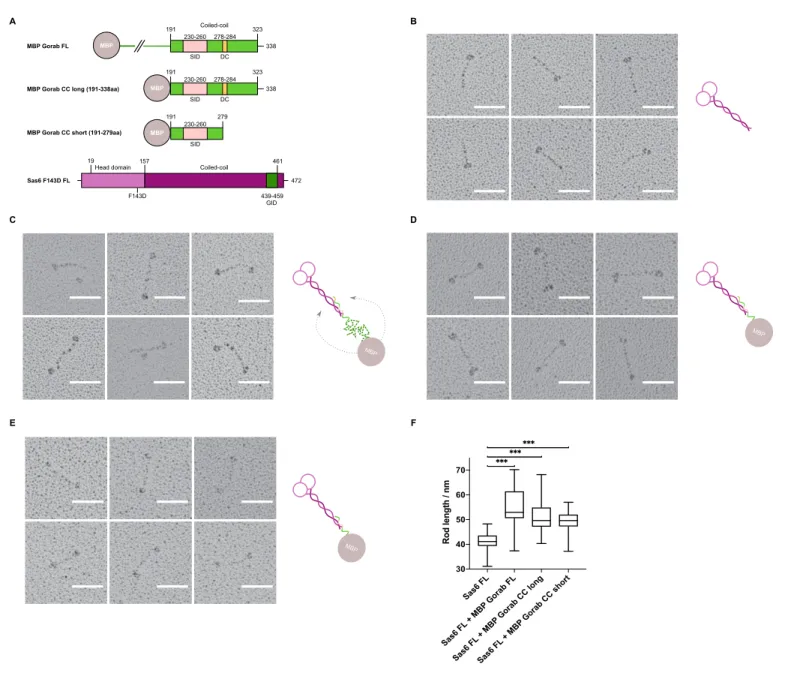
Having mapped the minimal regions essential for the interaction on both Gorab and Sas6, we wanted to determine the orientation of each of the protein molecules within the complex. To this end, we visualized the complex by rotary shadowing electron microscopy (EM), a method highly suited to reveal the elongated coiled coils present in Sas6. We generated three N-terminally MBP- tagged constructs of Gorab corresponding to the FL molecule, the putative coiled-coil domain alone (aa 191–338), and a C-terminally truncated form of the putative coiled-coil domain (aa 191–279) (Figure 5A). The resulting EM images, together with their respective schematic interpretations, are shown for FL Sas6 alone and Sas6 FL in complex with different MBP-Gorab constructs (Figure 5B–E, Figure 5—figure supplement 1).
The appearance of Sas6 FL molecules confirms previous findings (Cottee et al., 2015;
Kitagawa et al., 2011;Qiao et al., 2012;van Breugel et al., 2011) that Sas6 exists as a parallel dimer in which the two globular head domains lie on one end of a coiled coil, visible as a long rod of mean length 41 nm (n = 106) (Figure 5B). When Sas6 FL was complexed to the different constructs of N-terminally MBP-tagged Gorab, we observed the two globular head domains of Sas6 and one globular domain of MBP to be separated by a long coiled-coil rod (Figure 5C–E). The mean length of the rod between the Sas6 head domains and the MBP tag was greater than the Sas6’s coiled-coil rod alone; 54.8 nm (n = 87), 51.5 nm (n = 118), and 49.6 nm (n = 114) for Sas6 in complex with MBP- Gorab FL, MBP-Gorab CC long, and MBP-Gorab CC short, respectively (Figure 5F). These observa- tions confirm that Sas6 forms a parallel dimer and indicate that a Gorab monomer binds Sas6 dimer in an antiparallel manner.
Gorab interacts with Rab6 via its C-terminal coiled-coil domain
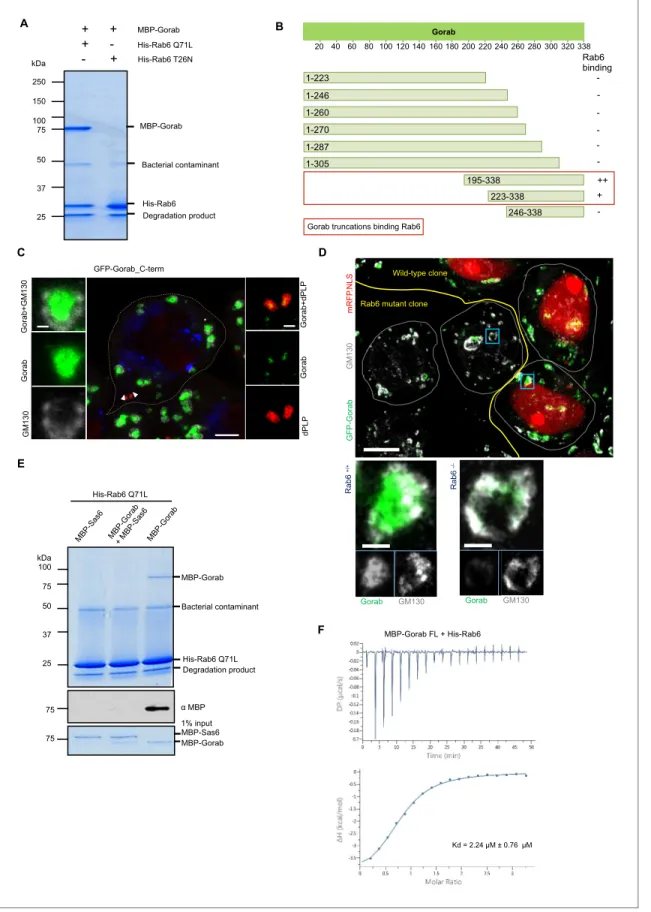
As the golgins are known to interact with Rab family proteins through their C-terminal regions (Short et al., 2005), we sought to determine whether Gorab’s interaction with Rab6 fol- lowed similar requirements. To demonstrate the interaction between Gorab and Rab6, we per- formed an in vitro binding assay between Gorab and active (GTP locked mutant) Rab6 (Figure 6A, Figure 6—figure supplement 1A). In order to determine which part of Gorab was involved in the interaction with Rab6, we made a series of N- and C-terminal truncations of Gorab.
This revealed that C-terminal region of Gorab (aa 223–338) is able to weakly bind Rab6. However, for a complete interaction with Rab6, a longer C-terminal region of Gorab (195–338 aa) is needed (Figure 6B, Figure 6—figure supplement 1B). This region encompasses Gorab’s entire coiled-coil domain that participates in the homodimerization. As even minor changes in this region can disrupt the dimerization, and hence Rab6 binding, we were not able to map the binding surface through this type of approach. Thus, the ability for Gorab to form a dimer appears critical for complex forma- tion between Gorab and Rab6.
Figure 4 continued
rescued with the indicated transgenes. The upper panel shows examples of the six phenotypic categories: 1: two normal centrioles; 2: one normal centriole; 3: one normal and one centriole showing diminished staining; 4: two centrioles with diminished staining; 5: one centriole with diminished staining; 6: no centrioles. Chromosomes are stained with DAPI (blue) and centrioles by anti-asterless (Asl) immunostaining (red). Arrows indicate centrioles with diminished Asl signal. Scale bar: 2.5mm. The lower histograms show the quantification of phenotypic categories for the indicated genotypes. Colors correspond to phenotypic categories (also indicated numerically). Means and standard errors are indicated for three independent experiments, each assessing 100 mitotic cells from 12 wing discs from each genotype. (C) Localization of GFP-Gorab expressed from the constitutive poly-ubiqitin promoter insas6null mutant wing discs in the absence and presence of the indicated Sas6 variants. The Sas6-WT (wild type), Sas6-M440A, and Sas6-L447A transgenes were integrated into the same genomic locus to achieve comparable expression levels from the ubiquitous Act5C-GAL4 driver. Interphase centrioles from the apical zone (upper row) and mitotic centrioles of metaphase cells (lower row) were visualized by anti-Asl immunostaining (red). GFP-Gorab not associated with centrioles corresponds to the Golgi fraction (see alsoFigure 4—figure supplement 1D). A total of 100 interphase cells and 30 mitotic cells from five independent wing discs were imaged for each genotype, all of which showed similar Gorab distributions within the same genotype. Scale bar: 5mm; scale bar in insets: 1mm.
The online version of this article includes the following source data and figure supplement(s) for figure 4:
Source data 1.Number of centrioles in different categories in wing imaginal disc of indicated genotypes.
Figure supplement 1.Centriolar phenotype ingorab, sas6, and sas6expressing variousSas6transgenes.
Figure supplement 1—source data 1.Number of centrioles counted in a 5050 um wing disc area in indicated genotypes.
MB P
A B
C D
F E
Sas6 FL
Sas6 FL + MBP
Gorab FL
Sas6 FL + MBP
Gorab CC
long
Sas6 FL + MBP
Gorab CC
short 30
40 50 60 70
Rod length / nm
472
Head domain
19 157
Coiled-coil
461
F143D 439-459
GID Sas6 F143D FL
MBP Gorab FL
MBP Gorab CC long (191-338aa)
MBP Gorab CC short (191-279aa)
MBP MBP
338
191 323
230-260 278-284
DC SID
MBP MBP
191 279
230-260
SID
338 Coiled-coil
191 323
230-260 278-284
DC SID MBP
MB P
MBP
Figure 5.Gorab monomer makes an antiparallel interaction with the Sas6 dimer. (A) Schematic depiction of Gorab and Sas6 constructs used for rotary shadowing electron microscopy inB–F. All Gorab constructs have an N-terminal MBP tag. Sas6 has an N-terminal His-tag. The Sas6 F143D mutation disables head-to-head interactions between Sas6 dimers and hence prevents formation of higher oligomeric structures of Sas6. SID: Sas6-interacting domain; DC: dimerization core; GID: Gorab-interacting domain as mapped by hydrogen–deuterium exchange in conjunction with mass spectrometry.
(A) Selected electron micrographs of rotary shadowed Sas6. (C) Sas6 in complex with MBP-Gorab full-length (FL). (D) Sas6 in complex with MBP-Gorab
‘CC long’ (aa 191–338). (E) Sas6 in complex with MBP-Gorab ‘CC short’ (aa 191–279). Schematic interpretations of structures are shown on the right in each case. Scale bars: 50 nm. (F) Box-and-whisker plots depicting coiled-coil lengths for Sas6 (average length 41.06 nm, n = 106), Sas6 in complex with MBP-Gorab FL (54.85 nm, n = 87), Sas6 in complex with MBP-Gorab ‘CC long’ (51.51 nm, n = 118), and Sas6 in complex with MBP-Gorab ‘CC short’
(49.56 nm, n = 114).
The online version of this article includes the following source data and figure supplement(s) for figure 5:
Source data 1.Table of rod lengths measured in rotary shadowing micrographs of each of the proteins mentioned.
Figure supplement 1.Representative electron micrographs of rotary shadowed molecules.
A
- - -
- - - ++
+ - Rab6 binding 338
Gorab truncations binding Rab6 1-223
1-246 1-260 1-270 1-287
20 40 60 80 100 120 140 160 180 200 220 240 260 280 300 320 Gorab
1-305
195-338 223-338
246-338 B
C D
E
F
kDa 250
150 100 75
50
37
25
MBP-Gorab
His-Rab6 MBP-Gorab His-Rab6 Q71L His-Rab6 T26N
+ + + - - +
Bacterial contaminant
Degradation product
GFP-GorabGM130mRFP.NLS
Rab6 mutant clone Wild-type clone
Rab6-/-
Gorab GM130
Rab6+/+
Gorab GM130
* GFP-Gorab_C-term
Gorab+GM130GorabGM130 Gorab+dPLPGorabdPLP
!"#$#%&%'#(#)#*&+,##(
MBP-Gorab
Bacterial contaminant
His-Rab6 Q71L
MBP-Gorab MBP-Sas6 His-Rab6 Q71L
kDa 100
75 50
37
25
75
75
1% input α MBP
Degradation product
!"#$#%&%'#(#)#*&+,##( MBP-Gorab FL + His-Rab6
Figure 6.Gorab interacts with Rab6 via its C-terminal domain. (A) Binding assay for His-Rab6 Q71L (GTP-locked) and His-Rab6 T26N (GDP-locked) with MBP-Gorab. SDS-PAGE shows Rab6 Q71L or Rab6 T26N as bait and Gorab as prey. Gorab binds only the active (GTP-locked) form of Rab6. (B) Schematic showing binding of Gorab truncations to Rab6 in vitro. –: no binding; +: binding; ++: strong binding. Red box: region of Gorab essential for Rab6 binding. Individual binding results for each construct are presented inFigure 6—figure supplement 1B. (C) Localization of C-terminal ‘half’ (CTH, Figure 6 continued on next page
As an alternative approach to narrow down the Rab6-interacting region of Gorab, we imple- mented HDX-MS. Our findings (Figure 6—figure supplement 2) are consistent with the binding assays using truncations. The resulting difference spectra between Gorab alone and Gorab bound to Rab6 over intervals between 10 s and 30 min indicated the interaction to be made by the 190–320 aa segment of Gorab, the coiled-coil region of its C-terminal part. However, the precise amino acid region varied as the period of incubation in deuterated water increased. The shorter incubation times of around 10 s identify regions of intermediate stability, around 220–250 aa, whereas at longer times this region is fully exchanged and this difference no longer observed. Instead, at longer times we also localized changes in the more stable 250–300 aa region. HDX therefore indicates destabiliza- tion of the whole 220–300 aa region encompassing destabilization both of less and of more stable sections.
We were, however, able to show that the C-terminal Rab6-binding domain of Gorab was suffi- cient for its Golgi localization by expressing the GFP-tagged C-terminal domain (aa 195–338) alone in flies and demonstrating that it could localize adjacent to GM130 at the Golgi and alongside dPLP at the centriole (Figure 6C). Asrab6mutants are early embryonic lethal, we had to generate homo- zygousrab6-/-clones in arab6 +/-background to be able to examine the requirements for Rab6 for Gorab localization in the fly. Whereas Gorab localized to the Golgi alongside GM130 in rab6+/- cells, cells from therab6-/- clone had no Gorab at the Golgi (Figure 6D). Together, this strongly sug- gests that interactions between the dimerizing C-terminal part of Gorab and Rab6 are required for Gorab to localize to the Golgi.
We then considered how Sas6 might interfere with the binding of Gorab to Rab6. To this end, we immobilized Rab6 as bait and then asked if Gorab would bind to it when it is involved in the interac- tion with Sas6 (Figure 6E, Figure 6—figure supplement 3). We showed that Rab6 binds Gorab only as a dimer, but is not able to interact with Gorab when in complex with Sas6 (Figure 6—figure sup- plement 3). This result strongly suggests that the Gorab’s interaction with Sas6 is much stronger than its interaction with Rab6. We were able to confirm this using isothermal titration calorimetry (ITC), which revealed that the Gorab–Rab6 complex showed a KDof 2.24mM. Thus, the interaction between Gorab and Rab6 is significantly weaker than that between Gorab and Sas6 (KD = 47 nM) (Figure 6F).
A stronger interaction of Gorab with Sas6 than with itself and Rab6 leads to the prediction that increased expression of Sas6 should lead to a reduction in the amount of Gorab associating with the Golgi apparatus. Indeed, we were able to see this in the experiments described above (Figure 4B).
The elevated expression of both wild-type Sas6 and Sas6-M440A in a sas6 background had the effect of increasing the GFP-Gorab signal intensity at the centrosomes and reducing it at the Golgi.
By contrast, elevated expression Sas6-L447A in thesas6null background did not affect the Golgi pool of Gorab, which was not recruited to residual centrosomes, that could have robust staining of Asl (Figure 4B). Thus, it seems that the relative levels of Gorab at the centriole and Golgi are set by its high affinity to Sas6 and the concentration of Sas6 at the centriole.
Figure 6 continued
aa 195–338) of Gorab in interphase primary spermatocytes of adult testes Primary spermatocytes expressing N-terminally GFP-tagged CTH-Gorab by a poly-ubiquitin promoter were stained to reveal GM130 (Golgi marker, white) and dPLP (centrosome marker, red). Asterisks: Golgi bodies; arrowheads:
centrosomes shown in insets. In total, 30 primary spermatocyte were imaged, all showing similar localization. Scale bar: 5mm; scale bar in insets: 1mm.
(D) Golgi localization of Gorab depends on Rab6. Confocal micrographs of mutant mosaic spermatocytes generated by FLP-FRT recombination inrab6 heterozygous males expressing GFP-Gorab, stained for Golgi marker GM130. Rab+/+ (red nuclei) and Rab6-/- (nuclei not labeled) cells are indicated.
Scale bar: 10mm; inset scale bar: 1mm. (E) SDS-PAGE and western blot of in vitro binding assay for His-Rab6 (bait) with MBP-Gorab, MBP-Sas6, or complex MBP-Gorab-MBP-Sas6 (prey). Upper panel: SDS-PAGE showing His-Rab6 Q71L is not able to bind Gorab when Gorab is in the complex with Sas6. Central panel: western blot revealing Gorab; lower panel: SDS-PAGE of the Gorab, Sas6, and Gorab–Sas6 input. (F) ITC profile of His-Rab6 Q71L interacting with MBP-Gorab FL WT. Indicated Kd with standard deviation is the average value of the ITC experiment performed in triplicate.
The online version of this article includes the following figure supplement(s) for figure 6:
Figure supplement 1.Regions of Gorab required to interact with Rab6.
Figure supplement 2.Deuteration time course identifying regions of Gorab that interact with Rab6.
Figure supplement 3.Sas6 interferes with binding of Gorab to Rab6.
Discussion
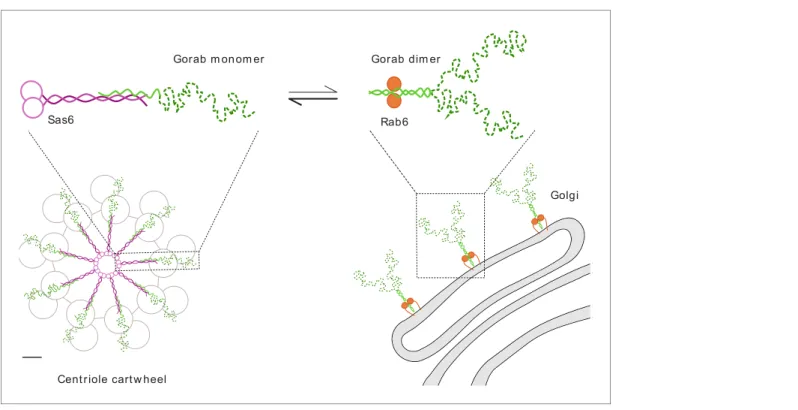
Together, our findings indicate that Gorab exists at the trans-Golgi network as a homodimer. Dimer- ization requires its coiled-coil motif (residues 200–315) within which is a core sequence (residues 270–287) that represents the most stable part of this dimerization region. Dimerization enables Gorab to interact with Rab6, and this in turn enables its association with the trans-Golgi. In contrast, Gorab interacts with Sas6 as a monomer. Gorab’s binding to Sas6 occurs with a higher affinity than its homodimerization, enabling a Gorab monomer to associate with the Sas6 dimer. Thus, the rela- tively small number of Sas6 molecules at the centriole would more avidly bind the Gorab monomer, allowing greater excess of Gorab to accumulate as dimers at the trans-Golgi (Figure 7). Sas6 and Gorab interact through short interfaces within their coiled-coil regions. Disruption of this region of Sas6 through mutation of a single conserved leucine residue, L447, results in a failure of Gorab to bind to Sas6 and localize to the centriole. While we cannot formally exclude the possibility that the L447A mutation affects some other aspect of Sas6 function, the finding that expression of this mutant phenocopies a stronggorabhypomorph in its effects upon both co-ordination and centriole duplication suggests that failure to recruit Gorab is responsible for the Sas6-L447A defect. The find- ing of some residual apparent Gorab-like function in Sas6-L447A-expressing flies may reflect the overexpression of the protein due to the technical requirements of the experiment and the fact that Sas6-L447A still binds Gorab but with a sixteenfold reduced affinity compared to wild-type Sas6.
Given that Sas6-L447A greatly diminishes the interaction with Gorab, whereas the mutation, M440A, in the adjoining ‘a’ position of the ‘a–g’ coiled-coil heptad repeat does not, leads us to conclude that Gorab binds to a narrow region near the C-terminus of the coiled coil of Sas6.
Gorab shows many of the properties typical of golgins, a family of tentacle-like proteins that pro- trude from the Golgi membranes to capture a variety of target vesicles. Redundancy between gol- gins in their ability to bind target vesicles could act as a functional safeguard and might explain why
Gorab m on om er
Sas6 Rab6
Gorab dim er
Golgi
Cent r iole cart w heel
Figure 7.Schematic representation of Gorab, its interacting partners Sas6 and Rab6, and the cellular localization of their complexes. Gorab is shown in green: N-terminal dynamic domain in dashed dark green and C-terminal putative coiled-coil domain in solid light green. Sas6 is shown in magenta, depicting two N-terminal head domains and the coiled coil formed in a Sas6 dimer. Rab6 is shown in orange. Although Gorab forms a dimer in solution, it dissociates to a monomer upon binding to Sas6 via its C-terminal coiled-coil domain. The Sas6–Gorab complex present in the centriole cartwheel is shown superimposed over the outer microtubule wall ofDrosophilacentriole consisting of MT doublets, roughly in scale (scale bar 20 nm).
Gorab also interacts with Rab6 via its C-terminal coiled-coil domain, but only as a dimer and with a much weaker binding affinity compared to Sas6 binding. Interaction with Rab6 enables Gorab’s localization to the trans-Golgi network, similarly to other golgins.