Proceedings of the PhD Conference
organised by the Doctoral School of Physics of the Faculty of Natural Sciences Budapest University of Technology and Economics,
in the framework of TÁMOP-4.2.2/B-10/1-2010-0009
May 17, 2013
Table of Contents
INTRODUCTION 5
SESSION A 7
Signal optimization of contrast enhanced GRE sequences using a 1T permanent-magnet high homogeneity MRI system
(Noémi Kovács) 8
Determination of chemical state of the arsenic in plant samples by XANES
(Anita Gerényi, I. Szalóki) 9
Study of hydrogen permeation through polymer membranes
(Béla Sebık, G. Kiss) 10
Engineering of semiconductor biomarkers by means of first principles methods (Bálint
Somogyi, Á. Gali) 14
First simulational and experimental test of a new SiPM based PET detector module (Judit
Lantos, P. Major) 18
Characterization of PET detector modules using UV excitation
(Balázs Játékos, E. Lırincz, F. Ujhelyi, G. Erdei) 21
SESSION B 23
Enhancing resilience of interdependent networks
(Marcell Stippinger, J. Kertész) 24
Ab initio spin dynamics: application to a linear ferromagnetic chain
(Levente Rózsa) 28
Magnetic anisotropy in frustrated clusters and monolayers
(László Balogh, L.Udvardi, L. Szunyogh) 33
Magnetic correlations in an Fe monolayer on Rh(001)
(András Deák) 34
Efficient orbital dependent STM simulation model
(Gábor Mándi, K. Palotás) 39
Study on the applicability of thorium as fuel in Generation IV reactors
(Hunor György) 40
SESSION C 41
CFD analysis of flow field in L-STAR facility
(Gábor Matulik, S. Tóth, A. Aszódi) 42
Radiation shielding calculations of APDCAM for KSTAR tokamak
(Gábor Náfrádi, G. Pór, S. Zoletnik) 48
Measurements with the final Beam Emission Spectroscopy diagnostic on the KSTAR tokamak
(Máté Lampert, S. Zoletnik, Á. Kovácsik) 52
Fast ion loss measurements at the ASDEX Upgrade tokamak
(Nóra Lazányi) 56
The efficiency of the Radosys MN Series automatic micronucleus counter software and the concepts of further development
(Timea Hülber, D. Selmeczi, Cs. Pesznyák, G. Sáfrány) 57
Dosimetric comparison of different techniques in external accelerated partial breast irradiation
(Gábor Stelczer, N. Mészáros, Cs. Pesznyák, T. Major, Cs. Polgár) 58 Respiratory gated CT imaging and radiotherapy at the National Institute of Oncology – technical aspects
(Tamás Pócza, Cs. Pesznyák) 59
SESSION D 61
Precursor configurations and post-rupture evolution of single-molecule junctions revealed by correlation analysis
(Zoltán Balogh) 62
Zero bias anomalies in single atom contacts
(László Pósa) 63
Magneto-Optical Diagnosis of Malaria
(Ádám Butykai) 64
Engineering InAs NW based Cooper pair splitter devices
(Gergı Fülöp, S. d’Hollosy, A. Márton, A. Baumgartner, C. Schönenberger, Sz. Csonka) 65 Detecting split Cooper-pairs at the single electron level
(Zoltán Scherübl, A. Pályi, Sz. Csonka) 66
Dosimetrical effects of different source arrangements in permanent prostate brachytherapy
(András Herein, T. Major, P. Ágoston, Cs. Polgár) 72
INTRODUCTION
The mission of the Doctoral School for Physics of the Budapest University of Technology and Economics (BME) is to further educate the MSc graduated students of excellence for assuring the supply of future scientists and university professors in the relevant fields of science. The Doctoral School was established in 1993. The human and infrastructural resources needed for the successful operation of the PhD School are assured mainly by the departments of the Institute of Physics and of the Institute of Nuclear Techniques in the BME.
The research group established commonly by the BME and the Hungarian Academy of Sciences as well as several scientific research institutes also contribute to the achievement of the goals of the PhD School. A tight connection with the industry assures that our PhD students’ knowledge and skills will be also relevant and usable in industrial applications.
There are three subprograms in the PhD School for Physics, each of them include several important and wide research areas (listed in parentheses below):
• Condensed Matter Physics (Solid State Physics, Material Sciences, Nanoscience, Statistical Physics)
• Applied Physics (Optics, Laser Physics, Holography, Surface Physics)
• Reactor Physics (Reactor Physics and Thermohydraulics of Nuclear Reactors, Nuclear Fusion Diagnostics and Technology, Nuclear Fuel Cycle, Nuclear Energy Systems, Application of Nuclear Techniques, Medical Physics)
The average number of the PhD students in the PhD School for Physics is 45-50 in the three grades. The scientific outcome can be characterized by the number and the quality of their publications. Based on the publication database of the university the students of the school publish ~35 scientific papers in a year, with an average impact factor of 2,43. This relatively high IF value reflects, that – according to the requirements of the school – the PhD thesis should be supported by papers appeared in high ranking journals.
The scientific results reported in this Proceeding have been presented at the annual PhD Conference of the Doctoral School for Physics of the BME on the 17th of May 2013. The Conference was organised in four sessions: Session A to Session D. For some of the results only abstracts are published, for others a fully detailed paper is presented. The results were achieved in connection with the project „Talent care and cultivation in the scientific workshops of BME" project, and were supported – partly or completely – by the grant TÁMOP - 4.2.2.B-10/1--2010-0009.
SESSION A
Signal optimization of contrast enhanced GRE sequences using a 1T permanent-magnet high homogeneity MRI system
Noémi Kovács1,2
1 BME TTK, Graduate School in Physics, Budapest
2 “Frédéric Joliot-Curie” National Research Institute for Radiobiology and Radiohygiene, Budapest
Abstract
Magnetic resonance imaging (MRI) can provide not only anatomical but functional information on living organisms like diffusion, neuron activation, permeability and perfusion. These modern techniques are challenging in preclinical studies especially on a 1 T MRI system due to the small changes that have to be detected. A promising possibility is to use exogenous contrast agents with appropriate pharmacokinetic features and high relaxivity. In low field MRI paramagnetic ion based contrast agents are preferred because their relaxivity increases with decreasing field strength and by shortening the T1 relaxation rate of adjacent tissues signal is enhanced in the vicinity of the contrast agent on T1 weighted images. Therefore T1 weighted sequences are needed, which are optimized for the used contrast agent and for the expected local concentration of the contrast agent.
A Gd3+ ion based contrast agent, PhenoQuant (CAGE Chemicals, Turine, Italy) was tested. In healthy animals PhenoQuant is an intravascular contrast agent due to its non-covalent binding with albumin, but it allows the quantification of vascular permeability in neo-formed vessels in tumors. For the in vitro measurements a phantom was prepared using 1.5 ml Eppendorf plain tubes containing 1 ml of PBS (phosphate buffer saline) doped with different amount of contrast agent (0, 0.06, 0.12, 0.21, 0.45, 0.6, 0.81, 1.05, 1.2, 1.5, 2.1, 4.05, 6, 8.1 mM).
All images was performed on a nanoScan PET/MRI scanner (Mediso Medical Imaging System Ltd, Hungary), in which a preclinical 1T permanent magnet MRI (M2, Aspect Imaging, Israel) is installed.
Spoiled gradient echo (GRE-SP) sequence was chosen to be optimized for contrast enhanced imaging, because it allows three dimensional acquisition (thin slices and even iso-voxel imaging) in reasonably acceptable time. Flip angle was varied between 10°-70° to find the largest enhancement in physiological concentration range (0 – 1 mM).
Relaxivity measurement was performed to characterize PhenoQuant contrast agent. Inversion recovery gradient echo snapshot (IR-GREsnap) sequence was run 8 times with different inversion times to calculate T1 and T1 relaxivity. The fitting resulted in R1 = 1.33 ± 0.07 mM-1s-1 relaxivity and T10 = 3362 ± 123 ms for pure PBS. In GRE-SP parameter optimization the flip angles of 20° - 30° were found to be the most appropriate for detecting concentration changes in physiological ranges. If concentration more than 2 mM is to be imaged 30° is preferred, but below 2mM 25° is enough in order to get better slice profile – avoid side lobes and aliasing. To directly compare two GRE-SP scans knowing the gain is not enough, because the reconstruction procedure gives normed images. The scaling factor depends on the measured maximum signal, so a control object is recommended to be in the field of view.
An in vivo study was performed on a tumor model to validate the in vitro measurements. The images showed high contrast agent concentration in the bladder and lower uptake in the tumor periphery 30 minutes after the injection. This means, that signal enhancement can be detected with the optimized sequence parameter, but the contrast agent contains BSA free gadolinium, which is secreted fast through the kidneys.
Acknowledgement
The work reported in the paper has been developed in the framework of the project „Talent care and cultivation in the scientific workshops of BME" project. This project is supported by the grant TÁMOP - 4.2.2.B-10/1--2010-0009
Determination of chemical state of the arsenic in plant samples by XANES
A. Gerényi1, I. Szalóki1
Institute of Nuclear Techniques, Budapest University of Technology and Economics, Budapest, Hungary
Abstract
The physiological effects in biological systems strongly depend on the chemical state of the component chemical elements. Arsenic is a toxic element for biological systems, but its toxicity level depends on its oxidation state. The uptake process frequently investigated by plant physiology researches because of the arsenic toxicity in plants can cause human health risk. The ultimate goal of our recent research project is to study the level of accumulation process of toxic elements in cucumber plants as a model biological system. The distribution of arsenic concentration in cross section of the hypocotyl was previously determined by confocal X-ray fluorescent imaging. The toxicity level of arsenic in the plant depend on the oxidation state, therefore this effect has been studied by X-Ray Absorption Near Edge Structure (XANES) spectroscopy method (in-vivo) at HASYLAB Beamline L.
Acknowledgement:
The work reported in the paper has been developed in the framework of the project „Talent care and cultivation in the scientific workshops of BME" project. This project is supported by the grant TÁMOP - 4.2.2.B-10/1--2010-0009Study of hydrogen permeation through polymer membranes
Béla Sebık*, Gábor Kiss
Department of Atomic Physics, Budapest University of Technology and Economics, Budapest, Hungary
*: e-mail: bsebok@eik.bme.hu
Abstract
Hydrogen permeation through a 0.25 mm thick polytetrafluoroethylene (PTFE) membrane between room temperature and 110 °C is presented in this study. The diffusion coefficient of hydrogen in PTFE was determined with the time-lag method. The frequency factor(
D0=8.2⋅10−7±1.7⋅10−7m2 s)
and the activation energy(
Ea =20±0.6kJ mol)
of the diffusion were calculated from the temperature dependence of the measured diffusion coefficients. The activation energy found in this study is in good agreement with literature data for the permeation of hydrogen through PTFE.Introduction
Measuring the time dependence of a gas flux permeating through a membrane contains information about the elementary processes involved in the permeation.With the aid of an instrument designed at our department [1] time-lag permeation measurements [2] can be carried out which can provide information about diffusion coefficients of different membrane materials. As the temperature of the membrane can be adjusted, the temperature dependence of the diffusion coefficient - thus the activation energy of the diffusion - can also be determined.
When gas is admitted to the upstream side of a membrane, the permeating flux of the particles originating from the gas is time dependent. If the permeated gas is continuously removed from the downstream side - given enough time - steady-state permeation can be achieved. In case of a polymer membrane originally free from permeating particles, the amount of gas permeated vs. time in steady-state can be described by (1), where Q is the amount of the permeated gas, L is the membrane thickness, D is the diffusion coefficient and C0 is the solved concentration of the permeating particles at the upstream side of the membrane [2, 3].
−
= D
t L L Q DC
6
2
0 (1)
The equation defining the amount of the permeated gas vs. time in steady-state (1) has an intercept on the time axis, called the lag-time (τ). The diffusion coefficient can be calculated with the aid of the lag-time:
τ 6 L2
D= (2)
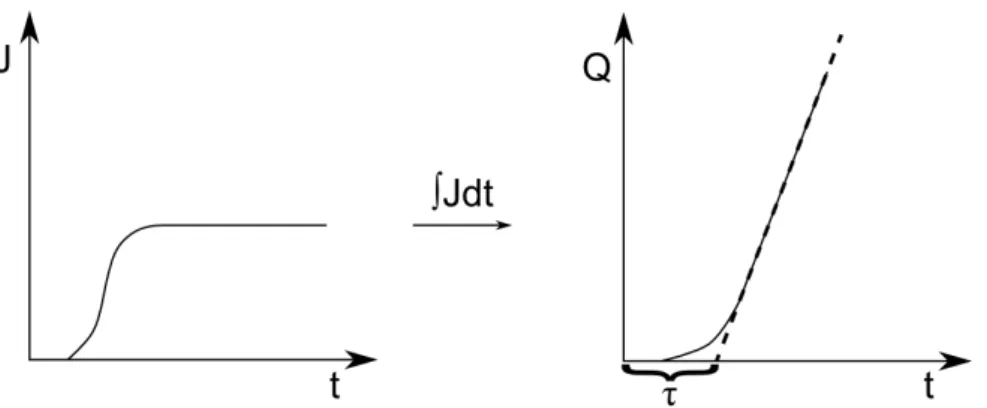
The amount of gas (Q) diffusing through the membrane can be determined by integrating the permeating flux vs. time curve over time and the time-lag can be obtained by fitting a straight line to the steady-state segment of the Q(t) curve (Figure 1).
The temperature dependence of the diffusion coefficient is described by (3), where D0 is the frequency factor, Ea is the activation energy of the diffusion, T is the absolute temperature and R is the universal gas constant [3].
RT Ea
e D
D= 0⋅ − (3)
Figure 1: Schematic calculation of the time-lag (τ) by integrating the permeating flux (J) vs.
time curve over time and fitting a straight line to the steady-state segment of the permeated amount (Q) vs. time curve. The permeating gas is first admitted to the upstream side of the
membrane at t=0.
Investigated sample
During the measurements high purity hydrogen (99.999 %, Messer Hungarogáz Kft, Hungary) permeated through a 0.25±0.02 mm thick 100 % polytetrafluoroethylene (PTFE) membrane (Kolofol Kft, Hungary).Experimental method
A new measurement setup [1] was built earlier for the investigation of permeation through different metal and non-metal membranes. This setup consists of a vacuum chamber equipped with a hot cathode pressure transducer and a turbomolecular pump attached to it. The membranes are mounted to a CF40 flanche in a way that any arbitrary gas can be admitted to their upstream side between 1 and 6 bar of pressure, while on their downstream side there is high vacuum in the vacuum chamber. In order to prevent the rupture of the membranes due to the pressure difference and to ensure the relatively free flow of permeated gas, a new membrane support method was developed [1].Before the measurements the pressure in the vacuum chamber is constant (base pressure): the pumping speed of the turbomolecular pump is in equilibrium with the desorption speed of the contaminants desorbing from the walls of the vacuum chamber. Furthermore, the upstream side of the membrane is pumped down to fore-vacuum to prevent any permeation and to ensure the purity of the gas admitted to the high pressure chamber. Once gas is admitted to the upstream side of the membrane and a permeating flux starts to flow through the membrane, the pressure in the vacuum chamber is raised because the permeating flux shifts the dynamic equilibrium pressure (the pumping speed of the turbomolecular pump is assumed to be constant). The increase in pressure above the base pressure in the vacuum chamber can be assumed to be directly proportional to the permeating flux.
Results
Permeating flux vs. time and amount of permeated gas vs. time:
The pressure difference in the vacuum chamber was investigated at different temperatures with 1.5 bar H2 pressure on the upstream side of the membrane (Figure 2).
Figure 2: Pressure difference in the vacuum chamber (permeating flux) vs. time through a PTFE membrane at different temperatures (upstream hydrogen pressure 1.5 bar). Hydrogen
was admitted to the high pressure side of the membrane at t=0 s.
The permeating flux vs. time curves show similar shape at each temperature investigated. The pressure starts to rise with a time lag after the hydrogen is admitted to the high pressure side.
The latency is due to the time required for the particles to diffuse through the membrane and it shows a decreasing trend with increasing temperature because of the faster diffusion. Other differences between the curves are the slope of the transition stage and the value of the steady-state flux which can also be explained by the faster diffusion at elevated temperatures.
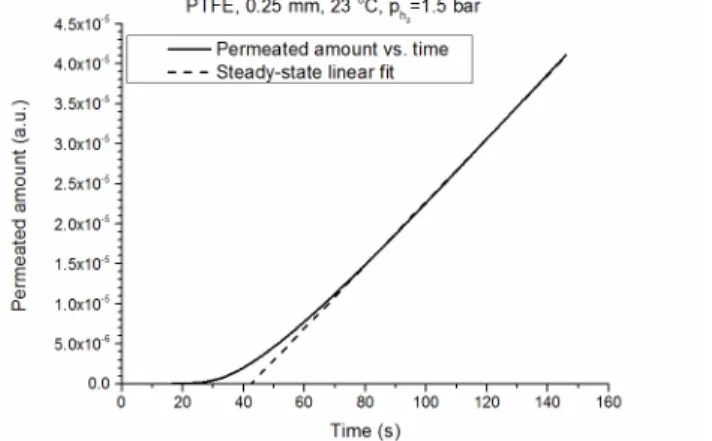
With the integration of the curves, the amount of the permeated gas vs. time curves can be generated and the time-lags can be calculated for each temperature investigated. Figure 3 shows one example of the resulting permeated amount vs. time curves with a straight line fitted to the steady-state segment. In the figure the transition stage and the steady-state permeation is clearly visible.
Figure 3: Determination of the time-lag in case of the measurement made at room temperature.
Determination of the frequency factor and activation energy:
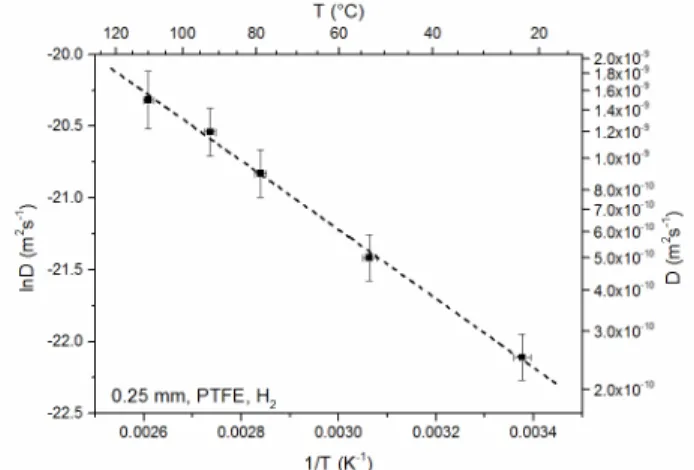
The time-lag values were evaluated for each measurement at different temperatures and the diffusion coefficient corresponding to each temperature was calculated. The frequency factor and activation energy of the diffusion were computed by the aid of an Arrhenius plot (Figure 4).
Figure 4: Arrhenius plot of the measured diffusion coefficients with the best-fit straight line From the best-fit straight line the frequency factor of the diffusion coefficient and the activation energy of the diffusion of D0=8.2⋅10−7 ±1.7⋅10−7m2 s and Ea =20±0.6kJ mol, respectively, were calculated (see eq. 3). The activation energy measured here is in good agreement with the activation energy reported for the permeation of hydrogen through PTFE [4]. As hydrogen diffuses in molecular form the activation energy of the permeation can be assumed to be the same as the activation energy of the diffusion. However no reliable literature data was found for the frequency factor of hydrogen diffusion in PTFE.
Conclusion
Permeation of hydrogen through a 0.25 mm thick PTFE membrane was investigated with a device designed by the authors. The results of the measurements were evaluated with the time-lag method. A frequency factor of D0 =8.2⋅10−7±1.7⋅10−7m2 s and an activation energy of Ea =20±0.6kJ mol was calculated for the diffusion of hydrogen in PTFE. The activation energy measured here is in good agreement with the value measured by other authors.
Acknowledgement
The work reported in the paper has been developed in the framework of the project „Talent care and cultivation in the scientific workshops of BME". This project is supported by the grant TÁMOP - 4.2.2.B-10/1--2010-0009.
References
[1] B. Sebık, G. Kiss, et al: Novel instrument and method for the investigation of small permeation fluxes of gases through different membranes Measurement In Press (2013) [2] H.L. Frisch: The time lag in diffusion J. Phys. Chem. 61 (1957) 93-95
[3] J. Crank: The Mathematic of Diffusion, Clarendon Press, Oxford (1975)
[4] J. Brandrup, E.H. Immergut, E.A. Grulke (editors): Polymer handbook 4th ed, John Wiley and Sons, New York (1999)
Engineering of semiconductor biomarkers by means of first principles methods
Bálint Somogyi1 and Adam Gali1,2
1 Department of Atomic Physics, Budapest University of Technology and Economics, Hungary
2Institute for Solid State Physics and Optics, Wigner Research Center for Physics, Hungarian Academy of Sciences, Hungary
Abstract
Ultrasmall, biocompatible and water-soluble fluorescent nanocrystals are much sought- after to probe biomolecules in living cells. Silicon carbide nanocrystals are promising for bioimaging applications, as they are water-soluble, biologically inert and experimentally achievable with diameter less than 3 nm. However their optical properties are non-ideal for in vivo applications as they emit light in the visible-UV range. We demonstrate here by time-dependent density functional calculations that 1-2 nm sized silicon carbide nanocrystals can emit light in the near-infrared region after introducing appropriate color centers in them, such as tungsten, molybdenum and vanadium related point defects, Si-vacancy and divacancy. According to our results, donor-acceptor pairs such as boron- nitrogen and aluminium-nitrogen can also lower the absorption energies of nanocrystals. Our results confirm that SiC nanoparticles with well-chosen point defects could be the next generation of biomarkers, satisfying all of the most important requirements needed for in vivo biological imaging.Introduction
For in vivo biological imaging, a fluorescent biomarker have to meet the following requirements: (i) they should be non-toxic and bioinert, (ii) their hydrodinamical size should be sufficiently small (with diamater less than 5 nm [1]), (iii) they should have intense, stable emission in the near-infrared range (700-1300 nm [2]), (iv) they should be photostable, (v) they should be produced in large amount for biological studies. At the moment, none of the existing organic molecule or semiconductor nanoparticle based solutions can fulfill all of the aforementioned criteria.SiC quantum dots are considered bioinert [3], they can manufactured with diameter less than 5 nm [4], and their chemical and photostability is outstanding. However, their emission wavelength is in the blue-UV region, which is a major disadvantage in the aspect of in vivo biological imaging.
Introducing color-centers to the SiC nanoparticles, their optical properties can be modified, and near-infrared (NIR) emission can be achieved. NIR photoluminescence were reported in case of tungsten [5], vanadium [6] and molybdenum [7] related point defects in bulk 4H-SiC and 6H-SiC. We investigated the effect of these three metal point defects in SiC nanoparticles on the absorption spectra.
Results and discussion
In our study, we used nearly spherical, 3C-SiC nanoparticles with their diameter varying in the 1.1-1.9 nm range, which is experimentally available [4]. The dangling bonds on the surface of the nanoparticles were passivated with hydrogen atoms. Two different types of transition metal related point defects were investigated: i) a substitutional defect, where the metal atom takes the place of the central Si atom (later reffered as MSidefects, where M is the chemical symbol of the metal atom) ii) and a substitutional defect- vacancy complex, where the metal atom takes the place of the central Si atom and a near C atom is missing (MSi-Cvac). In case of ion-beam epitaxy doping of the SiC nanoparticles, C vacancies are formed at a high concentration, which can lead to the formation of ii) defects.
We also investigated Si-vacancy, divacancy and two different types of donor-acceptor pairs in SiC nanocrystals.
The geometries of the investigated nanoparticles were optimized by using the PBE exchange- correlation functional, utilizing the VASP plane-wave code. We calculated the lowest excitation energy (absorption edge) using the Time-Dependent Density Functional Theory (TDDFT). In our TDDFT calculations, we used the PBE0 hybrid-functional, since based on some recent papers [8], the TDDFT with PBE0 kernel results quantitatively correct absorption spectra compared to the experimental results. We utilized the TURBOMOLE cluster code with DZP basis set for the TDDFT calculations.
The most important results of our calculations are shown in Figure 1. The metal-related point defects, Si vacancy and divacancy lower the absorption edge to the NIR region. The nanoparticles with diameter less than 1.5 nm show stronger quantum-confinement effect, however as the diameter approaching 2 nm, the size-dependency of the optical gap becomes insignificant, thus we expect the larger sized nanoparticles to have a similar optical gap as the nanoparticle with 1.93 nm diameter. The reduced size-dependency of the optical gap compared to the defect-free nanoparticles can be related to the strong localization of the electron levels relevant in the transition. As the absorption edge of the doped nanoparticles lowered to the NIR, we expect them to have luminescent emission in the 800-1200 nm range,
which is optimal for biological imaging.
Figure 1. The calculated excitation energies for transition-metal related point defects, vacancy and divacancy. Left: large circle (with letter inside) denotes Si-vacancy (substitutional defects), right: large and small circle (with letter inside) denotes divacancy (substitutional defect-vacancy complexes). The point defects lower the optical gap of the SiC nanocrystals drastically, and the size-dependency of the optical properties is much weaker compared to the pristine nanoparticles.
We investigated the nature of the defect levels which are relevant to the lowest energy optical transition. We found that the first excitation occurs between the highest occupied molecular orbital (HOMO) and the lowest unoccupied molecular orbital (LUMO) in all of the investigated cases. These deep, defect-related states are localized on the point-defects. In case of MSi defects, the HOMO is an atomic-like state because there is no interaction between the host dangling bonds and the corresponding d-orbitals of the metal atom due to symmetry reasons. The LUMO of the MSi defects, and the HOMO/LUMO of the MSi-Cvac defects are the bonding/anti-bonding combinations of atomic-like d-orbitals of the metal atom and the dangling bonds of the vacancy/divacancy.
To connect the calculated absorption energies to the fluorescent properties, we calculated the Stokes-shift utilizing the constrained DFT method within the Franck-Condon approximation.
The Stokes-shift was found to be relatively small (<0.2 eV) meaning that our results for the optical gaps are closely related to the fluorescent wavelengths of the of the nanoparticles.
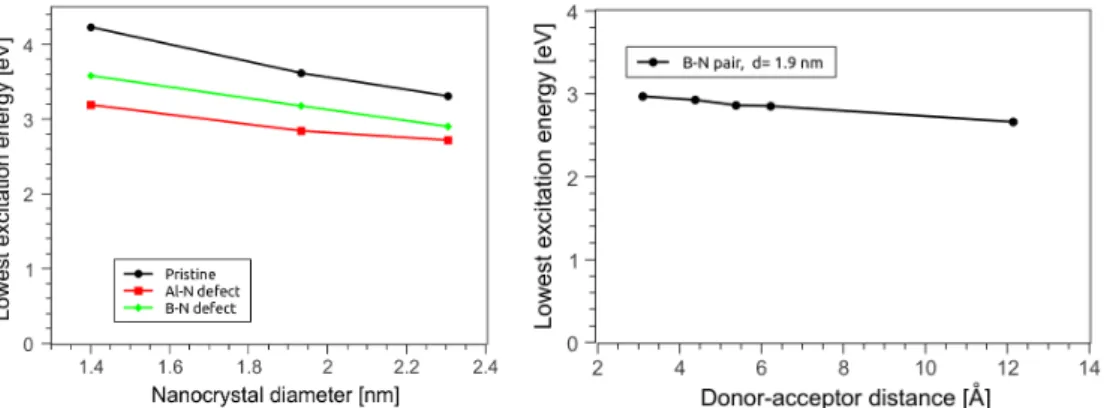
Introducing donor-acceptor pairs to the nanocrystals could be an other, slightly different approach to modify their optical properties. We investigated AlSi-NC and BC-NC donor- acceptor pairs in SiC nanocrystals. The donor and acceptor atoms create shallow defect levels in band gap of the semiconductors, and these defect states are optically active even in the case of bulk SiC [9, 10] (which has an indirect band gap). The absorption and photoluminescence spectra depend on the donor-acceptor distance due to Coulomb interaction between the donor and acceptor ions. Figure 2. shows the most important results of our calculations. In case of nanocrystals, the lowest excitation energy (which is related to the donor-acceptor transition) depends on (a) the donor-acceptor distance and (b) the size of the nanocrystal. We note, that the TDDFT with PBE0 exchange-correlation kernel is not a generally reliable method to describe charge-transition defects, as the PBE0 functional yields qualitatively incorrect asymptotic behavior for the exchange-correlation potential. This problem can be tackled using range-separated exchange-correlation functional, which gives the proper 1/r asymptotic behavior for the effective potential. These types of calculations are yet to be performed.
Figure 2. The first excitation energies of the SiC nanocrystals containing donor- acceptor defects. (a) shows the dependency of the optical gap on the size of the nanocrystals, (b) shows the dependency of the optical gap on the donor-acceptor separation in case of the BC-NC defect in SiC nanocrystal with diameter 1.9 nm.
Conclusions
In summary, we have calculated the first excitation energies of SiC QDs containing Si- vacancy, divacancy, and various transition-metal related point defects. Our most important result is that fluorescent emission can be obtained in the near infrared region by introducing Si-vacancy, divacancy, and molybdenum, tungsten or vanadium point defects to SiC nanoparticles. Our results confirm, that SiC nanoparticles with Si-vacancy, divacancies or well-chosen transition-metal point defects could be the next generation of biomarkers, satisfying all of the most important requirements needed for in vivo biological imaging. We found, that the AlSi-NC and BC-NC donor-acceptor defects also lower the optical gap of the SiC nanocrystals but to a much lesser extent, and it is not entirely clear yet, if NIR emission can be achievable with these defects in SiC nanocrystals.
Acknowledgement
The work reported in the paper has been developed in the framework of the project „Talent care and cultivation in the scientific workshops of BME" project. This project is supported by the grant TÁMOP - 4.2.2.B-10/1--2010-0009
References
[1] H. Soo Choi, W. Liu, P. Misra, E. Tanaka, J. P. Zimmer, B. Itty Ipe, M. G. Bawendi, and J. V. Frangioni. Renal clearance of quantum dots. Nat. Biotechnol., 25(10):1165-1170, (2007)
[2] A. M. Smith, M. C. Mancini, and S. Nie. Bioimaging: Second window for in vivo imaging.
Nat. Nano, 4(11):710-711, (2009)
[3] J. Botsoa, V. Lysenko, A. Gélon, O. Marty, J. M. Bluet, and G. Guillot. Application of 3C- SiC quantum dots for living cell imaging. Appl. Phys. Lett., 92(17):173902, (2008) [4] D. Beke, Zs. Szekrényes, I. Balogh et al. Characterization of luminescent silicon carbide
nanocrystals prepared by reactive bonding and subsequent wet chemical etching. Appl.
Phys. Lett. 99(21):213108, (2011)
[5] A. Gällström, B. Magnusson, F. C. Beyer, A. Gali, N. T. Son, S. Leone, I. G. Ivanov, C.
G. Hemmingsson, A. Henry and E. Janzén. Optical identification and electronic configuration of tungsten in 4H- and 6H-SiC. Physica B: Condensed Matter 407, 1462- 1466 (2012)
[6] J. Schneider , H. D. Müller , K. Maier , W. Wilkening, F. Fuchs et al. Infrared spectra and electron spin resonance of vanadium deep level impurities in silicon carbide. Appl.
Phys. Lett. 56(12), 1184 (1990)
[7] K. F. Dombrowski, M. Kunzer, U. Kaufmann, J. Schneider, P. G. Baranov and E. N.
Mokhov. Identification of molybdenum in 6H-SiC by magnetic resonance techniques.
Phys. Rev. B. 54(10): 7323–7327 (1996)
[8] M. Vörös and A. Gali. Optical absorption of diamond nanocrystals from ab initio density- functional calculations. Phys. Rev. B, 80:161411, (2009)
[9] Choyke, W. J. and Patrick, Lyle. Luminescence of Donor-Acceptor Pairs in Cubic SiC.
Phys. Rev. B, 2(12):4959-4965, (1970)
[10] Kuwabara, H. and Yamanaka, K. and Yamada, S. Donor-acceptor pair emission in β-SiC doped with Boron. physica status solidi (a). 16:K67, (1973)
First simulational and experimental test of a new SiPM based PET detector module
Judit Lantos, Péter Major
Abstract
In this paper we propose a novel SiPM sensor based PET detector module which consists of a pixelated LYSO crystal with 1.27 mm × 1.27 mm × 12 mm pins, a BK-7 optical glass light guide and four Hamamatsu S12342-33ddDG(X) SiPM matrices. To test the parameters of the proposed detector module Monte Carlo simulations using the DETECT2000 based PetDetSim software and then measurements on the prototype module were performed. The results showed that the crystal matrix can be resolved at room temperature and the time resolution is also suitable for PET measurements.Introduction
In the last decade the fast improvement of semiconductor light detectors has opened the way for combining PET systems with MRI equipments. The high soft tissue contrast of MRI can further improve the diagnostic value of combined systems compared to PET-CTs [1]. The drawback of the conventional light detectors, PMT tubes which are used almost exclusively in current PET detectors is that they are sensitive to magnetic field, so cannot operate in the field of MRIs. SiPM sensors are the most promising candidates to replace PMTs. They are insensitive to magnetic field, have high photon detection efficiency (PDE), high gain, but they are very sensitive to the variance of bias voltage and temperature and have internal noise due to dark current.
In this paper we propose a novel SiPM sensor based PET detector module which consists of pixellated LYSO crystal, light guide and SiPM sensor matrices. The surface of the module is approximately 5×5 cm2, which is a practical size to build detector rings with various Field of View (FOV) extents.
To test the parameters of the proposed detector module Monte Carlo simulations were performed using the DETECT2000 based PetDetSim software to predict the expectable detected photon numbers and study the effect of DC noise on the separability of the detector pins. After the promising results of the Monte Carlo simulations, the detector was built and the first measurements were performed.
Materials and methods
Detector moduleThe new SiPM based PET detector module consists of a LYSO crystal matrix optically coupled via light guide to four SiPM sensor matrices read out by two electronic boards (two sensor matrices share one electronic unit). The crystal matrix contains 35×35 crystal needles of dimensions of 1.27 mm × 1.27 mm × 12 mm and the pins are separated by optical reflector foil. As light detector the Hamamatsu S12342-33ddDG(X) sensor is used. The 3×3 mm2 pixels are arranged into a 5×5 matrix with a pitch of 5 mm, thus four sensors can cover a 50 × 50 mm2 area. Each pixel of the SiPM matrix is divided to 3600 subpixels (with 61.5 % fill factor) to ensure energy linearity. The SiPM sensor has high PDE (about 50 % at the maximum of the emission spectrum of LYSO) and moderate DCR (4-10 MHz / pixel).
Monte Carlo simulations
Monte Carlo simulations have proved to be efficient methods [2] to study performance of hypothetical detector geometries to prove or reject their feasibility. To characterize the planned detector geometry Monte Carlo simulations were performed using the DETECT2000
[3] based PetDetSim (PDS) software [4]. This tool follows the optical photon tracks originating from the scintillation events and computes the detected photon number in each subpixel. Volumetric and surface specific optical parameters can be set; wavelength dependency is also taken into account.
Due to the symmetry of the module in the PDS simulation 200 photons were started from each needle of the fourth of the crystal matrix. The scintillation depth was chosen according to its expected value in the 12 mm thick crystal, i.e. 5.6 mm. To ensure reasonable computation time, the sensor geometry was simplified. The SiPM pixels were not divided to subpixels, but the rejection of photons absorbed in a “dead” area was done subsequently using a Matlab script. The noise caused by the dark counts was also added afterward to the raw data.
Measurements
After the promising results of the Monte Carlo simulations, the detector was built and the first measurements were performed. The detector module consists of four SiPM matrices, but due to accessibility problems in the first measurements described below only two were used. The two sensors were connected to the same electronic board thus the performance of the half module can be studied without any biasing factor.
The detector module was connected to a conventional PMT tube to ensure the conditions of coincidence measurement. Using a 22Na point source with the activity of approximately 0.45 MBq, the module was irradiated homogeneously. In the raw data spatial, time and energy information was recorded and using this data flood field image, time and energy spectra were calculated. To ensure the optimal acquisition setup the bias voltage was adjusted to the temperature of the system based on previous examinations.
Results
Monte Carlo simulations
The simulation result file contains the position of the termination of each optical photon.
From this information the counted event number of each SiPM pixel can be calculated. The number of the detected photons strongly depends on the position of the crystal needle in which the scintillation event occurred. Its value varies between 1100 and 2200.
From the sensor signal Anger coordinates can be derived. The crystal pins are separable for almost all of the needles. The noise has little impact on the Anger image; the sum of counts originating from dark current is approximately 15-40 for the length of a scintillation event so it is less than 4 percent of the signal.
Measurements
The measurements with the detector module were performed at room temperature. This is a worst case scenario in the means of dark current noise. The flood field measurement was performed using various bias voltages. The optimal choice at 27.4 °C was 72.4 V. At this value 200k events were recorded from which flood filed image, energy and time spectra were calculated.
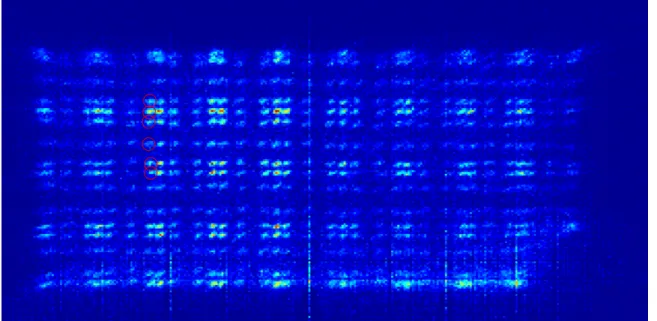
Fig. 1. Anger image of the detector module at 27.4 °C temperature. Some pins are marked with red circles. The vertical continuous lines are caused by noise.
In the flood field image approximately 16 × 34 crystal needle can be separated (see Fig. 1.), which results in a 21.6 mm × 45.9 mm FOV. Using all events in which the absorbed energy belongs to the photo peak the coincidence time resolution is 2.4 ns.
Conclusion
The simulation and measurement results confirm the feasibility of the proposed detector module. Based on the flood field image the crystal pins can be resolved at room temperature.
The time resolution is also promising. In the near future the cooling and crystal-sensor optical coupling need to be further optimized to reduce noise and improve light yield.
Acknowledgement
The work reported in the paper has been partially developed in the framework of the project
„Talent care and cultivation in the scientific workshops of BME" project. This project is supported by the grant TÁMOP - 4.2.2.B-10/1--2010-0009
We would like to thank Gergely Vaspál, Sándor Török, Márton Görög and Gergely Németh for their assistance concerning the operation of electronic and software components.
References
[1] Habib Zaidi and Alberto Del Guerra, An outlook on future design of hybrid PET/MRI systems, Med. Phys. 38, 5667 (2011), DOI:10.1118/1.3633909
[2] H. Zaidi, Relevance of accurate Monte Carlo modeling in nuclear medical imaging, Medical Physics, vol. 26, no. 4, pp. 574–608, 1999.
[3] Francois Cayouette; Denis Laurendeau and Christian Moisan, DETECT2000: an improved Monte-Carlo simulator for the computer aided design of photon sensing devices, Proc.
SPIE 4833, Applications of Photonic Technology 5, 69 (February 1, 2003)
[4] Steinbach, C.O., Szlavecz, A., Benyo, B.; Bukki, T., Lorincz, E.; Validation of Detect2000-Based PetDetSim by Simulated and Measured Light Output of Scintillator Crystal Pins for PET Detectors, Nuclear Science, IEEE Transactions on, vol. 57, no.5, pp.2460-2467, Oct. 2010
Characterization of PET detector modules using UV excitation
B. Játékos, E. Lırincz, F. Ujhelyi, G. Erdei
Abstract
Monolithic scintillator block-based detector modules used in positron emission tomography (PET) have the benefit of being capable to determine the depth of interaction (DOI) of a γ-photon inside the scintillator material. Lower price along with the DOI capability make them the primary competitors of pin matrix-based modules, especially when equipped with advanced silicon photomultiplier (SiPM) sensors.
In such detector modules both light transport processes and spatial sampling of the sensor differ from the conventional, pin scintillator matrix approach that uses photomultiplier tubes (PMT) as sensors.
Consequently, the design of such detector modules require new principles. In this work we investigate the optical phenomena taking place in the scintillator and present two optical design approaches. We performed both measurements and simulations to validate our concepts.
Formerly, we developed a new measurement setup using UV excitation of the scintillator in order to test detector blocks. Simulations on this setup were performed in ZEMAX, a validated optical design software. The aim of developing a simulation environment for slab scintillators is dual: 1) we want to understand which effects are important and which are not in our measurement setup; 2) we need a design tool that can be used to optimize slab based detector module systems. We show the effect of two design principles applicable for slab scintillator PET detector modules: slanted crystal side faces and retro-reflector structures. Slanted crystal faces are found to be beneficial if better photon extraction is required. Using retro-reflectors to cover the γ-side (instead of mirrors) show better spatial resolution with only slightly worse total count performance. Measurement results are compared with detailed optical simulations. We show that our simulation environment can be used for the optimization of PET modules. Additionally, a few unwanted effects of the previously developed measurement method was discovered. Solutions for eliminating these effects are proposed.
Acknowledgement
The work reported in the paper has been developed in the framework of the project „Talent care and cultivation in the scientific workshops of BME" project. This project is supported by the grant TÁMOP - 4.2.2.B-10/1--2010-0009
SESSION B
Enhancing resilience of interdependent networks
Marcell Stippinger1 and János Kertész1,2
Abstract
Failures in complex interdependent systems like the ongoing economic crisis have drawn special attention to the importance of network stability. We examine the behavior of interdependent networks under random failures. The interdependence via dependency links between two networks is known to lead to cascading failures [1,2]. Motivated by real-life scenarios, we introduce the possibility of edge re-organization, as a means of enhancing network resilience. This healing, controlled by a tunable parameter, is accomplished by establishing new connectivity links which proves to be efficient in retaining longer the connected state of the network. Furthermore, instead of modeling breakdown by single shots of random failures releasing cascades, we consider a dynamic process by gradually introducing the random failures after relaxation. We present simulation results for square lattice network under random attacks of constant intensity and compare our results with previous results. We find that the increase in the lifetime (measured in number of initiating events) of two interdependent square lattice networks has a power-law scaling as a function of the healing probability with exponent 1.07±0.02. We also observe a transition in the evolution of the average degree of network nodes.Networks with healing probability above a critical value have no cascades and exploding average degree, while collapsing networks have monotonously decreasing average degree. We demonstrate that the number of cascades may but the cascade sizes cannot be used to predict breakdown.
Introduction
The cascading of failures in networks, and in interdependent networks in particular, is a very relevant issue in various fields, including infrastructure systems as well as finances. Interdependency can lead to an enhanced vulnerability [1,2].In [2] they considered a system of two connected networks and analyzed a model in which removing a fraction of nodes from one network resulted in the removal of their pairs in the adjoining network. Furthermore, nodes that became separated from the giant component in either network were also considered non-functional. In real networks, however, if a node fails, considerable effort is spent on alleviating the consequences of its failure. We introduce therefore the possibility [3] of edge healing to the model and analyze the new behavior. We find that it is possible to suppress cascading effects for healing probabilities smaller than one.
Finally we analyze cascade statistics to propose ways of predicting system breakdown.
The model
A binetwork is composed of two interdependent networks. In this paper we examine the case of two N×N square lattice networks A and B of identical topology where each node has connectivity links to their nearest neighbors within the same network and in addition, there is a bijection between the nodes of the two networks via the dependency links which assign a node Ai in A to each node Bj in network B within a radius r. (Within this paper we restrict ourselves to the case of r unlimited.)Let us suppose that failures affect the nodes one by one in a random order. This timeline is easily adapted to any Poisson process of intensity ρ(t). The cascade dynamics is symmetric on the two networks and can be phrased in the following steps:
(1) a node Aatt in network A gets attacked and fails;
(2) neighbors of Aatt try to heal the network, that is, each pair of them establishes a new link with probability w; Batt the adjoint of Aatt and its neighbors do alike with same w;
(3) a cascade may follow the initial failure:
1 Budapest University of Technology and Economics, Department of Theoretical Physics
2 Central European University, Center for Network Science
a) nodes
{ }
Aik nk=1 in A which became isolated from the giant fail;
b) counterparts
{ }
Bjk nk=1 in B of nodes
{ }
Aik nk=1 fail as well;
c) the surviving neighbors of
{ }
Bjk nk=1try to heal the network (here with the same probability w as in (2) );
d) nodes
{ }
BIl ml=1 in B which became isolated from the giant component fail as well;e) counterparts
{ }
AJl ml=1 in A of nodes{ }
BIl lm=1 fail as well;f) the surviving neighbors of
{ }
AJl lm=1 try to heal the network;(4) then (3) a) to (3) f) is repeated until n or m gets 0.
Suppressing cascades
We executed a Monte Carlo simulation of the above model with periodic boundary condition on square lattices of linear size 20, 40, 80 and 160.The network resilience is characterized by the fraction pc(w) of nodes attacked that causes the whole system to fail. According to one’s intuition, the data shows that the smallest critical fraction pc0 belongs to the case where there is no healing:
pc0 = pc(w=0).
Figure 1: (left) The fraction b(p) of failing nodes as a function of the fraction p of nodes attacked. Note: In order to sharply mark the breakdown, averaging in variable p is done for a
given b(p) over 60 simulations. (right) The same curves scaled on each other.
In [2] a fraction P of the original network was destroyed in the first step and then the size of the giant component was monitored after the cascades had relaxed as a function of P. There is an important difference between this procedure and ours. In the version of [2] nodes may be accidentally attacked, which already fail in our step-by-step (dynamic) model. Let us denote the fraction b(p) of failing nodes as a function of the fraction of attacked nodes p in the step- by-step model. The number of unattacked but disconnected nodes is [b(p)–p]N2. The probability of randomly destroying an already disconnected (but not attacked) node is b(1p−)p−p , so the implicit relation between the two attacking methods is
∫
− −−=P dp
p p p P b
p
01 1 ~
~ ) ~ (~ )
( . (1)
(1) can be numerically evaluated more precisely by =
∫
( )(
− −− ~))
(
~)
~ ( ~
~) ( ' )
( bP
b p
b p
b p b db
P
p 0 1 1 where p(b)
is the inverse function of b(p). Using this transformation our pc(w=0) = 0.3143 turns out to be in good agreement with Pc = 0.3175 [2].
In Figure 1, we observe that the connected state of the network can indeed be retained longer by increasing the probability w of new links between the neighbors of failing nodes. The increase ∆p = pc(w) – pc0 and w describes a general scaling form of
( )
p w b(
p w)
b , =λ λα∆ ,λβ , (2)
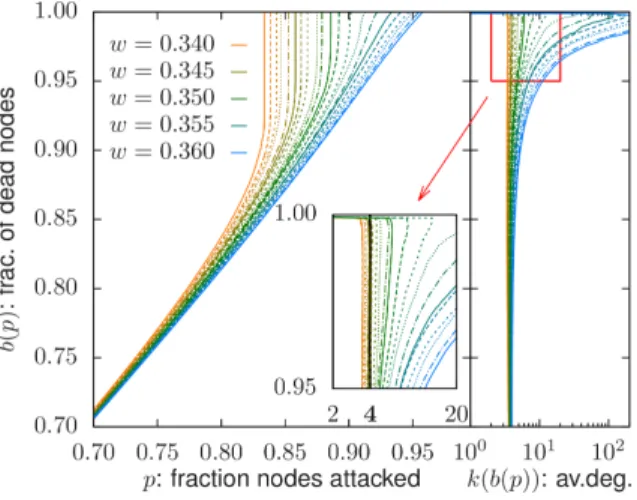
from the slope of b at the origin we find α = 1 and measurement gives 1/β =1,07±0,02. The healing dynamics changes the network topology and the average degree as well. Figure 2 allows us to describe a transition: below a critical healing threshold wc we find a sharp breakdown in the number of surviving nodes. The critical healing is defined as the lowest healing for which the b(p) function is smooth for all p. In our simulation we observe wc = 0.353.
It is worth to examine the Markov process which describes the evolution of the degree distribution. Let ak denote the number of nodes having degree k. A node of degree n is selected by a random attack with probability an/
∑
ak . Such a selection erases 1 node with n links while the healing effort of the n neighbors introduces w( )
n2 new links on average. Its neighbors have degree m with probability∑
km ka
ma / . After the healing, the new degree
of the that neighbor is
{
1, ,..., 2}
ˆ∈ m− m m+n−
m with probability
( )
m n mm
m w
wˆ−( −1) 1− + −2−ˆ . This allows us to describe the transition matrix and numerically simulate the Markov-process of the degree distribution. If we ask for which wc the average degree n = 4 of the square lattice is conserved, we find that 2wc
( )
n2 =n is to be solved (each link joins 2 nodes), leading to the mean-field result wc = 1/3. We find that the average degree n = 4 is constant through the simulation for wc = 0.345, see Figure 2, which is close to the critical healing defined via the breakdowns.Cascade statistics
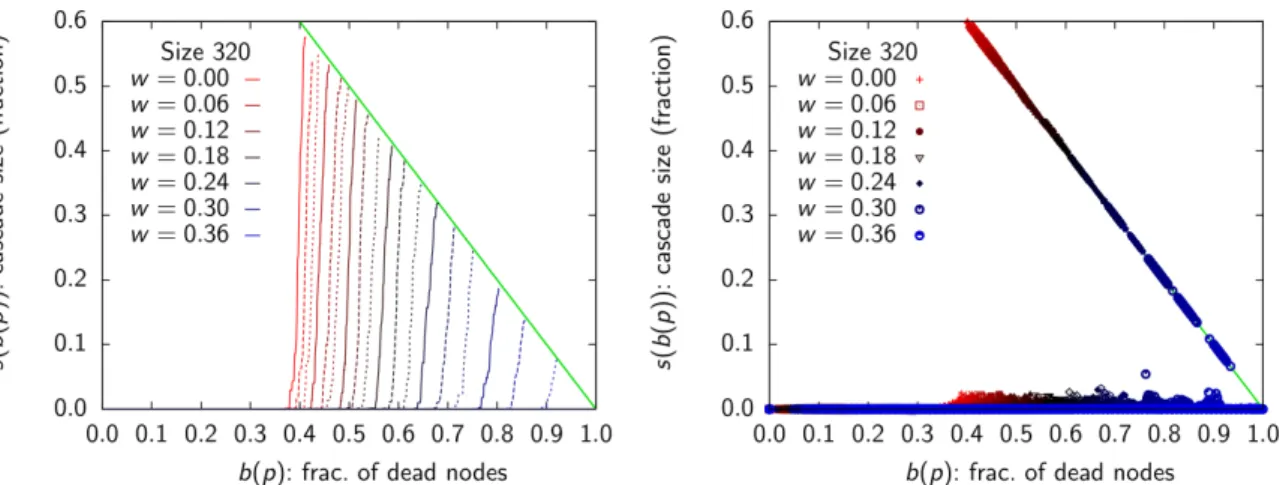
Another approach of analyzing and predicting breakdowns is to look at precursor events. We call cascades all events involving more nodes than the attacked one and its counterpart, that is, steps (3) a) to (3) f) are executed. The distribution of the sizes of cascades (number of nodes involved) shows that the typical size neglectable to the lattice size.Thorough inspection of Figure 3 shows that all simulations end with a cascade wiping out all of the remaining part of the network. Therefore this macroscopic breakdown begins at the fraction pc(w) therefore cascade-sizes have no predictive value of a coming breakdown. For the same reason, maximum cascade size smax(w) is 1–pc(w).
Figure 2: (left) The fraction b(p) of failing nodes as a function of the fraction p of nodes attacked. Above wc = 0.352 there is
no breakdown. (right and inset) The average degree on the horizontal axis as a
function of the fraction of dead nodes on the vertical axis. The average degree
remains constant for wc = 0.345.
Figure 3: The size s(b(p)) of the cascades expressed in the fraction of the original network.
(Unintermittent repetition of steps (3) a) to (3) f) is considered one cascade). Averaged values on the (left). Individual simulations on the (right) show that no macroscopic cascades occur
before the breakdown.
The maximal number of cascades within the same time frame (the cascade frequency) is proportional to the system size [3], and the slope of increase is greater in systems with breakdown which features can be used to predict cascades, see Figure 4.
Conclusions
We examined the consequences of edge healing in interdependent networks. We found that the resilience of the network, measured in the number of survived attacks, has power-law scaling with the effort w spent on healing and it is possible to suppress cascading effects for healing probabilities higher than wc = 0.352. We proposed a way of predicting system breakdown using the frequency of cascade occurrences.Acknowledgement
This work was partially supported by the grant TÁMOP-4.2.2.B-10/1–2010-0009. We thank Éva Rácz for her help at the early stage of this work.
References
[1] S. V. Buldyrev, R. Parshani, G. Paul, H. E. Stanley, and S. Havlin. Catastrophic cascade of failures in interdependent networks. Nature 464, 1025-1028, April 2010.
http://www.nature.com/nature/journal/v464/n7291/abs/nature08932.html
[2] W. Li, A. Bashan, S. V. Buldyrev, H. E. Stanley, and S. Havlin. Cascading failures in interdependent lattice networks: The critical role of the length of dependency links. Phys.
Rev. Lett., 108:228702, May 2012.
http://link.aps.org/doi/10.1103/PhysRevLett.108.228702
[3] M. Stippinger, J. Kertész. Enhancing resilience of interdependent networks. To be published.
[4] M. E. J. Newman. Spread of epidemic disease on networks. Phys. Rev. E, 66, 016128, July 2002. http://link.aps.org/doi/10.1103/PhysRevE.66.016128
Figure 4: The number of cascades within a time frame of ∆b(p)=0.001. The maximal
number and the slopes are different for systems with and without breakdown.
Ab initio spin dynamics: application to a linear ferromagnetic chain
Levente Rózsa
Abstract
We developed a new numerical method for solving the dynamical equations of spin dynamics, the stochastic Landau-Lifshitz-Gilbert equations. This method is applicable for small clusters, where the low symmetry of the system makes it more difficult to use a method based on an effective Hamiltonian. The simulation program was applied to a linear Heisenberg chain as well as Co10/Au(001).Introduction
Ab initio spin dynamics simulations are suitable for examining the magnetic properties of small systems, which have many important applications in magnetic devices. Atomistic spin dynamics is used to describe systems on the nanometer scale, which may contain from a few dozen to a few thousand atoms, and time scales ranging from a few femtoseconds to several hundred picoseconds. Experimental tools, for example spin-polarized scanning tunneling microscopy, are also available[1] for examining systems on the atomic level.
Atomistic simulations are usually[2] based on effective Hamiltonians, which are generalizations of the Heisenberg model, where the coefficients are determined from ab initio calculations. However in the case of small atomic clusters, there exist many different types of interactions which may heavily influence the behaviour of the system, and it is difficult to extract all the quantities which should be used in an effective Hamiltonian, especially the on- site anisotropy terms due to the low symmetry of the system.
On the other hand, it is possible to directly determine the effective magnetic field from ab initio principles, thereby avoiding the use of an effective Hamiltonian. We implemented a numerical method which uses this effective field in the solution of the dynamical equations.
This method was used to describe linear chains of atoms. Later it may be possible to compare the results to experimental ones, since measurements have been carried out recently[3] on similar systems.
Numerical solution of the dynamical equations
In spin dynamics at finite temperatures the time evolution of the local magnetic moments is described by the stochastic Landau-Lifshitz-Gilbert equations[4][5]
( )
i(
i(
effi thermali) )
i thermal i eff i i
i M M B B
B M B t M
M =−γ × + −αγ × × +
∂
∂ '
' ,
(1) where Mi=Miσi stands for the localized magnetic moment at site i with magnitude Mi, which will be called the spin at site i, α is the Gilbert damping, and
m e 1 2
' 1
γ = +α is the gyromagnetic factor. The thermal magnetic field has the form
i i B i i
thermal
i M
T D k
B η
γ
η α o
o 2
2 =
= ,
(2)
where T is the temperature and ηi denotes the stochastic white noise. The magnitude Mi is kept constant during the time evolution, both in the deterministic and the stochastic case. We use Stratonovich stochastic calculus in the latter, which interpretation is denoted by the ◦ symbol.
The effective magnetic field is given by
i eff band
i M
B E
∂
−∂
= , where Eband is the sum of the single- particle Kohn-Sham energies. Beffi will be determined in a local coordinate system, which transforms along with the spin vectors σi. Using the results of multiple scattering theory, one can calculate the derivative of the energy with respect to the angle variables in this system as
[ ( ) ]
τ επ
βα α
d t
J i e
E EFermi Tr i ii
i i
band
∫
∞
−
−
=
∂
∂ 1
, 1 Im
h , (3)
where α=1, 2 and tiand τiiare on-site and multiple-site scattering matrices, respectively. If we are interested in more accurate numerical schemes when solving the equations, it may be necessary to calculate higher order derivatives of the energy functional, which have similar forms.
For the stochastic Landau-Lifshitz-Gilbert equations, Mentink et al.[6] recently proposed a numerical integration method which is based on the stochastic Heun scheme, but also conserves the length of the spin vectors. This method provides a fast way of solving the differential equations, both by allowing larger time steps during the solution and by requiring relatively few computer operations at each time step.
We applied three different numerical schemes for solving the equations in the local coordinate system. The first one is called the two-step scheme, which is based on the Heun method. This requires the calculation of the effective field at two different spin configurations at every time step, which is the most time-consuming part. Therefore we also constructed the so-called one- step scheme, which calculates the effective field at only a single spin configuration, but also requires higher order derivatives of the energy functional. Finally the simplified one-step scheme calculates with a single spin configuration, and only uses the first order derivatives of Eband.
Application to a linear Heisenberg chain
First we took a model Hamiltonian of the form 1
1
1 +
−
=
∑
= i
N
i
J i
H σ σ , a one-dimensional Heisenberg model with only nearest-neighbour interactions and free boundary conditions. We chose this model for two reasons: firstly, since there is an effective Hamiltonian in this case, the three new numerical integrations schemes can be compared not only to each other, but also to the method described in [6], which uses a global coordinate system. Secondly, this is an exactly solvable model[7], so analytical results are also available for comparison. For example, the expectation value of the energy takes the form of the Langevin function
( ) ( )
−
−
= k T
J J
T J k N T E
B
B coth
1 . (4)
We chose a ferromagnetic system with J=-1, and calculated the energy at ten different temperatures for each of the numerical schemes. As can be seen in Figure 1, all the proposed methods give results which are in relatively good agreement with the analytical solution.
Further investigation shows that the one-step and two-step methods have similar stability properties, both of them giving the proper result for the expectation value of the energy up to