The Kiskunhalas-NE (KIHA-NE) fractured hydrocarbon reservoir is part of the structurally rather complex crystalline basement of the Great Hungarian Plain. In the course of petrologic and thermometric examinations various rock types of the investigated area have been classified and characterized. There are four basic lithological units in the area. In the lowest structural position orthogneiss is common, which according to its petrographic features is assumed to be identical to the orthogneiss body of the adjacent Jánoshalma (JH) basement high (metamorphic peak temperature T
< 580 °C according to Zachar and M. Tóth 2004). The next rock unit upward is the highly mylonitized variety of the orthogneiss with textural features suggesting deformation in an extensional stress regime. In the higher section of the mylonite zone graphitic gneiss mylonite is characteristic, with a peak metamorphic T of 410±45 °C. The lithology in the shallowest position of the area is a graphitic carbonate phyllite, with a T of 375 ± 15 °C. Estimation of the deformation temperature for both mylonitic rocks results in approximately Tdef~ 455 °C. All data together suggest that between the top (graphitic carbonate phyllite) and the bottom (orthogneiss) of the ideal rock column there is about 200 °C peak metamorphic temperature deviation. The two extreme metamorphic blocks probably became juxtaposed along an extensional fault zone in the basement at approximately 15 km depth.
Key words: hydrocarbon reservoir, Great Hungarian Plain, petrologic and thermometric examinations, petrographic features, deformation temperature
Introduction
In several places the crystalline basement of the Pannonian Basin accumulates significant amounts of hydrocarbon. Understanding these fractured reservoirs is rather challenging because of the complicated structural evolution of the metamorphic complexes. As there is no surface outcrop in the region, the metamorphic rock bodies can only be examined using the very limited number of core samples. Previous studies of numerous hard rock reservoirs in the Pannonian Basin (Zachar and M. Tóth 2001; Schubert and M. Tóth 2002; M. Tóth
Addresses: Á. Nagy, T. M. Tóth: H-6701, Szeged P. O. Box 651,
e-mails: agnes.nagy@geo.u-szeged.hu, mtoth@geo.u-szeged.hu Received: December 5, 2011; accepted: January 1, 2012
DOI: 10.1556/CEuGeol.55.2012.1.1
Petrology and tectonic evolution of the
Kiskunhalas-NE fractured hydrocarbon reservoir, South Hungary
Ágnes Nagy, Tivadar M. Tóth
Department of Mineralogy Geochemistry and Petrology, University of Szeged, Szeged
et al. 2002; Zachar and M. Tóth 2004; M. Tóth and Zachar 2006; Zachar et al. 2007) nevertheless pointed out that diverse rock types tend to show significantly different fracture characteristics and therefore reservoir behavior. That is why understanding the lithological framework in each single fractured hydrocarbon field is crucial and requires a detailed study of petrology and microstructures of the given rock types.
In the Kiskunhalas (KIHA)-NE Field 69 wells penetrated the metamorphic basement, but only specific segments of a few of them produce any fluid (water, oil or gas). The depth of the oil-water contact is also significantly different in neighboring wells, suggesting a highly compartmentalized reservoir. Previous studies (Cserepes 1980; T. Kovács and Kurucz 1984; Árkai 1991) suggest many different rock types in the KIHA-NE Field that may exhibit various petrophysical behaviors, providing a possible explanation for the coexistence of permeable and impermeable zones within the metamorphic rock body.
The aim of the present study is to characterize and classify the basement rocks of the poorly-known KIHA-NE Field. Furthermore, we aim at presenting a thorough petrologic characterization of the most important rock types from the research area, sketching physical conditions of their metamorphic evolutions as well as outlining the spatial relationship of the main lithologies. Such a petrologic background may serve as a firm basis for modeling petrophysical properties of the complex rock body at reservoir scale in the future.
Geologic setting
Inside the Alpine-Carpathian-Dinaric orogenic belt the Pannonian Basin has a structurally rather complex crystalline basement, because of its complicated, multistage tectonic evolution. The essentially unknown Variscan tectonic events were followed by large scale extension during the Early Jurassic and nappe formation in the Cretaceous. Finally, the basement rocks were intensely deformed due to basin subsidence during the Miocene and Pliocene. As a result, at present the basement is a complicated mosaic of blocks with mutually incompatible metamorphic and structural evolutions.
The KIHA-NE Field is situated south of the Mid-Hungarian tectonic zone that separates the Tisza Unit from the Alcapa Unit (Csontos and Nagymarosi 1998).
According to recent interpretations the study area is located rather close to the assumed front of the Codru Nappe, which was formed as a result of Cretaceous tectonic activity. Although the KIHA-NE area has never been studied in detail petrologically, there are better-known neighboring metamorphic uplifts.
Information concerning the petrologically well-known Jánoshalma High (JH) to the SW (Zachar and M. Tóth 2004; Zachar et al. 2007) and the Tázlár (T) area to the NE may be used for comparing results of the entire, relatively small region of
Fig. 1
Location of the Kiskunhalas-NE Field on the Pre-Cenozoic geologic map of Hungary (after Haas et al.
2010). 1. Cretaceous sediments; 2. Cretaceous volcanites; 3. Jurassic sediments; 4. Triassic sediments;
5. Mesozoic rocks in general; 6. Permian rhyolite; 7. Variscan crystalline formations; 8. Unknown basement
According to Zachar and M. Tóth (2004) JH is a uniform orthogneiss block with the presence of numerous amphibolite and eclogite enclaves of diverse metamorphic evolutions. Zachar et al. (2007) consider that these enclaves are in fact various xenoliths of the original igneous (granitoid) body and represent rock pieces of the mélange zone of an ancient subduction-accretionary complex. The gneiss body itself exhibits a clear two-phase evolution. Conditions of the first detectable, probably igneous event can only be estimated in a rather wide window of T ~ 700–850 °C and P < 0.65 GPa. The second phase of the history is characterized by the development of schistosity at T < 580 °C. Due to post- metamorphic ductile deformation, mylonite formed along the retrograde phase under greenschist facies conditions. Brittle deformation and widespread metasomatic overprint further complicated the current structure of the gneiss body. The most common mafic xenoliths are amphibolites and the occurrence of amphibole xenocrysts in the orthogneiss texture is common as well. The only eclogite xenolith is characterized by a T ~ 710±10 °C and P ~ 2.6±0.75 GPa peak followed by retrogression during decompression (Zachar et al. 2007). The original granitoid intrusion indicates a peraluminous composition and syn-collision origin (Zachar and M. Tóth 2004).
According to the small number of previous papers dealing with the KIHA-NE Field, gneiss, micaschist, amphibolite, different mylonitic types, migmatite, and a low-grade phyllite variety predominate in the study area, in an unknown structural arrangement (Cserepes 1980; Cserepes-Meszéna 1986; T. Kovács and Kurucz 1984). T. Kovács (1973) suggests that in relation to the general amphibolite facies metamorphism of Variscan age, in some places migmatite and diatexite formed. In the course of the following retrograde metamorphism, mylonite, chlorite schist and sericite schist evolved (Árkai 1991). Árkai (1978, 1991) suggests that the protolith of the phyllite was a marly sediment formed under reducing conditions. Using illite crystallinity indices it underwent a very low-grade metamorphism with a peak of about 270–300 °C (Árkai in Cserepes-Meszéna 1986). Árkai (1991) supposes that the very low-grade phyllite represents an exotic nappe, and consequently its contact to other rock types must be tectonic.
Geochemical data infer weathering of the phyllite body under surface conditions.
The Tázlár Field belongs morphologically to the same ridge as KIHA-NE, with highly similar rock types. Nevertheless it has not yet been studied in detail.
Gneiss and various mylonite types are common, with subordinate amounts of graphitic carbonate phyllite and relatively fresh amphibolites. Migmatite and related lithologies are not reported from this area (Cserepes 1980).
Methodology
In general, the crystalline formations of the Pannonian Basin are deep-seated
cores and diverse geophysical methods. In the KIHA-NE region 69 non-oriented wells penetrated the basement; among these only 25 sampled it at different depth intervals, while core recovery was only a few per cent in the case of each well. At present, core samples of 15 wells are available for petrographic study, while several samples have disappeared in the last decades and are represented only by old thin sections. Altogether, more than 100 thin sections were investigated, most of which belong to the collection of the Hungarian Gas and Oil Company (MOL Plc.). In order to make the lithological classification in the study area as detailed as possible, petrographic investigation of each single core sample was carried out. Afterward, microstructural and thermometric examinations were done on selected samples.
Carbonaceous material thermometer by Raman microspectroscopy
During diagenesis and metamorphism of sedimentary rocks the carbonaceous material (CM) contained in it undergoes transformation from disordered CM to fully ordered graphite (graphitization). The degree of organization of metamorphic CM indicates the metamorphic grade, and especially the importance of temperature. The Raman spectra of metamorphic CM exhibit a significant evolution with metamorphic grade (e.g. Wopenka and Pasteris 1993;
Yui et al. 1996). The process of graphitization has a strictly irreversible character;
thus it primarily depends on the maximum temperature reached along a given P- T path (e.g. Beyssac et al. 2002; Beyssac et al. 2004; Wiederkehr et al. 2011; Aoya et al. 2010). Therefore the CM structure is insensitive to retrograde metamorphic overprint or polymetamorphic evolution (Wiederkehr et al. 2011; Beyssac et al.
2002; Wopenka and Pasteris 1993). Due to the high spatial resolution and the short acquisition time, which allows numerous spectra to be recorded and therefore to quantify the sample heterogeneity, Raman spectroscopy appears the most appropriate tool to characterize metamorphic CM. A further advantage of the method is that it can be obtained on conventional petrographic thin sections, which is a non-destructive, in situmeasurement; thus the textural relationship of the CM in the surrounding matrix can be checked. The thin section has a better heat removal because of the mineral matrix and it is possible to control the orientation of the CM with respect to the incident laser beam (Beyssac et al. 2002).
A Raman spectrum of CM is composed of first-order (1100–1800 cm–1) and second-order (2500–3100 cm–1) regions (Tuinstra and Koenig 1970; Nemanich and Solin 1979). In the first-order region, at 1580 cm–1, the G band (as graphite band) occurs, and three additional bands (the so-called defect bands), D1 (1350 cm–1), D2 (1620 cm–1) and D3 (1500 cm–1) are directly related to the degree of structural disorder (e.g. Tuinstra and Koenig 1970). With increasing metamorphic grade the defect bands become narrower and decreasing, while the G band becomes more intense. The second-order region is characterized by two further bands, S1 (2700 cm–1) and S2 (2900 cm–1); they also disappear gradually with increasing metamorphic grade.
Each spectrum can be characterized with the peak intensity ratio (R1=D1/G) and the peak area ratio (R2=D1/(G+D1+D2). The more ordered the graphite the lower value of R2 it is characterized by. Beyssac et al. (2002) described an empirical equation to estimate the peak metamorphic temperature on the basis of the parameters of Raman spectra of metamorphic CM:
T (°C) = –445 (R2) + 641. (1)
The peak temperature can be determined to ±50 °C (due to the uncertainty of the calibration), within the range of 330–650 °C. Rahl et al. (2005) modified the thermometer, applicable from 100 up to 700 °C so that:
T (°C) = 737.3 + 320.9 (R1) – 1067 (R2) – 80.638 (R1)2 (2) Aoya et al. (2010) re-calibrated the geothermometer of Beyssac et al. (2002) for regional metamorphism, and found that the co-variation between R2 and T can be described by the following quadratic equation:
T (°C) = 91.4(R2)2– 556.3(R2) + 676.3. (3) On the basis of abundant measurements (Wiederkehr et al. 2011) the methods of Beyssac et al. (2002) and of Rahl et al. (2005) provide similar temperature estimates, with discrepancies of less than 30 °C. Wiederkehr et al. (2011) recognized that the relative uncertainties in temperatures derived using the calibration of Rahl et al. (2005) are higher when compared to results using those of Beyssac et al. (2002), especially at temperatures above 480 °C. A discussion of calibration possibilities at lower temperatures (~200–300 °C) is given in Lahfid et al. (2010).
The measurements were carried out on oriented (perpendicular to the foliation) thin sections with a THERMO DXR Raman microscope, at the Department of Mineralogy, Geochemistry and Petrology, University of Szeged, with green laser source (532 nm laser, Nd-YAG). The laser passed through an optical microscope (Olympus BX41); for measurement the 100× lens was used in confocal mode. Irradiation power at the sample surface was 5 mW. The spectra were measured by high resolution grating with spectral window of 50–1861 cm–1, with a CCD detector. A minimum of 10 independent points were analyzed on each sample and the data were collected at 20×10 s length, with quadratic fluorescent correction (following the suggestions of Beyssac et al. 2002 and of Rahl et al. 2005).
The peak position, band area and band weight (FWHM) were determined using the Peak Fit 4.12 computer program with Voight-functions (combined Gaussian and Lorentzian profiles) after Beyssac et al. (2003).
Sutured quartz grains as a deformation-related thermometer
In metamorphic and igneous rocks complex interfingering (sutures) may occur along the monomineralic quartz–quartz grain boundaries. In numerous naturally deformed rocks Masuda and Fujimura (1981) and Hirth and Tullis (1992) studied the relationship between temperature, strain rate and the grain-boundary geometry, and found that the length of the suture segment increases with decreasing temperature. Kruhl and Nega (1996) established on natural samples derived from different metamorphic grades (low-greenschist to medium- granulite facies) that the sutured quartz grain boundaries are statistically self- similar and so can be represented as fractal-like objects. On the calibrated geothermometer a linear function is suggested between the fractal dimension of the sutured quartz grain boundaries and the formation temperature. Kruhl and Nega (1996) also suggest that the result of the thermometer does not depend on the strain rate. This textural thermometer was refined by Takahashi et al. (1998) using artificial samples. The result of the thermometer is valid for an approximately 100 °C temperature interval. Among many others, Majumder and Mamtani (2009) successfully used the thermometer on deformed granite samples to determine the tectonic relationship and deformation history of the given rock unit.
For measurements of grain boundaries normal microscopic thin sections (30 µm) with identical magnification (×10) were evaluated. The sutured grain boundaries were digitized manually. The fractal dimension values (D) were obtained by Benoit 1.0 fractal geometry software using the divider method (Mandelbrot 1967) following the suggestions of Kruhl and Nega (1996). The slope of the regression line fitted onto the middle section of the log-log transformed L- r diagram defines D for each individual suture.
Petrography Orthogneiss
Slightly foliated, coarse-grained, biotite-dominated gneiss is representative for the KIHA-NE Field (Fig. 2a). The principal phases are K-feldspar, plagioclase, quartz and two micas; the accessories are apatite and zircon, which usually occur as idiomorphic grains.
In all studied samples feldspar predominates over quartz (Fig. 2b). The grains are not deformed; they are commonly sericitized and altered to carbonate and an undetermined set of clay minerals. Several feldspar grains contain quartz inclusions forming a myrmekitic microtexture. The second main rock-forming mineral, quartz, shows marks of moderate ductile deformation exhibiting subgrains and slightly serrated grain boundaries. Biotite and muscovite coexist in the samples with a clear dominance of biotite which determines the foliation planes of the samples at macroscopic scale (Fig. 2b). The large biotite flakes are
reddish brown, usually fresh, although in some cases slightly chloritized.
Chlorite commonly forms pseudomorphs after single amphibole grains as well.
These grains have a greenish-colorless pleochroism and bright blue, locally yellowish interference color. Small, secondary opaque and carbonate minerals are present in them as inclusions.
The fractures of the gneiss samples are usually narrow; they contain carbonate infill and in some cases have a few cm-wide altered zone around them (Fig. 2a), where biotite is replaced by chlorite, while feldspar is sericitized.
Amphibolite
Only a few samples represent this rock type; all of them show slightly oriented (nematoblastic) texture. Samples are strongly altered (Fig. 2c); the chloritized amphibole grains with carbonate patches are resorbed and not oriented. The sericitized plagioclase feldspar grains form polysynthetic twins. Accessories are zircon, apatite, magnetite and ilmenite. Narrow quartz veins cut the fine-grained, dark greenish samples.
Mica-poor granite
The few coarse-grained granite samples exhibit equigranular texture with only moderate deformation but without any visible orientation (Fig. 2d). These samples are of rather simple mineralogy consisting mainly of quartz, K-feldspar with a little bit of muscovite.
Orthogneiss mylonite
The samples (Fig. 2e) are characterized by biotite and nearly equal amounts of feldspar and quartz with a texture similar to that of a typical orthogneiss (Fig. 2f).
Accessories are rutile, apatite and zircon. In some cases the strongly sericitized feldspar grains are myrmekitic. The rock type exhibits mylonitic foliation (Fig.
2g); the S planes are formed by chlorite flakes after biotite, while the C planes show sericite bunches in the C/S fabric. Feldspar deformed in a brittle manner, forming microboudinage with formation of sericite, clay and carbonate minerals in the necks of the structure. Quartz grains in the samples show evidence of
← Fig. 2a–h
Rock types of the KIHA-NE Field. a) macroscopic appearance of the typical orthogneiss; b) biotite flakes defining orientation in the feldspar and quartz-dominated matrix (+N); c) texture of the altered amphibolite xenolith (+N); d) macroscopic appearance of the mica-poor granite; e) macroscopic appearance of the orthogneiss mylonite; f) common myrmekitic feldspar suggesting igneous origin (+N); g) C/S fabric in orthogneiss mylonite (+N); h) bookshelf-textured apatite in the orthogneiss mylonite (+N). Mineral abbreviations after Whitney and Evans (2010)
ductile deformation with strongly serrate grain boundaries, undulose extinction and presence of deformation lamellae. Biotite is almost entirely replaced by chlorite. The chlorite flakes with deep purple interference color often show kink band deformation and undulose extinction. White mica flakes are folded and locally form mica fishes. Carbonate minerals are common in the matrix as a secondary mineral. Apatite shows clear evidence of microfaulting presenting bookshelf structure (Fig. 2h).
The mylonite samples are significantly more fractured than the common orthogneiss is. Nevertheless, usually there is no metasomatized zone along the veins; they are mainly filled with carbonate minerals locally enclosing fragments of the adjacent rock.
Graphitic gneiss mylonite
Texturally this lithology is a fine-grained mylonite characterized by a well- developed C/S fabric (Fig. 2j). Unlike with orthogneiss mylonite, in this case graphite defines the S planes; sericite packets are typical along the C planes.
There is no biotite in these samples; the role of feldspar is subordinate, while quartz is essential. Graphite and sulfide minerals (mainly pyrite) are present in significant amounts.
Feldspar is altered to sericite. Carbonate minerals and the few larger porphyroclasts are fractured and exhibit microboudinage fabric (Fig. 2l). Quartz commonly appears as monocrystalline ribbons and shows the same markers of ductile deformation as in the orthogneiss mylonite. Sericite, the most frequent mica phase, is present in fine-grained aggregates and locally forms folded bunches. It coexists with graphite stripes in interfingering texture that sporadically also contain larger muscovite flakes. Graphite usually appears in narrow bands of various widths that play a remarkable role in determination of the foliation. Pyrite grains appear both in single crystals and in large aggregates;
no other sulfide minerals have been determined. In some cases they are mantled by a narrow pressure fringe of quartz (Fig. 2k). Accessories are zircon, rutile and apatite. The latter often takes on bookshelf structure similar to that observed in the orthogneiss mylonite.
Carbonate minerals are essential matrix constituents. Due to their common dissolution, cavities of a few cm in size are frequently present in the samples. A few cores are completely brecciated and highly fractured. Veins are mainly filled
← Fig. 2i–p
Rock types of the KIHA-NE Field. i) macroscopic appearance of the graphitic gneiss mylonite; j) C/S fabric in graphitic gneiss mylonite (+N); k) narrow graphite stripes and small pyrite cubes in the quartz-sericite-carbonate matrix (+N); l) feldspar boudinage in the graphitic gneiss mylonite (+N);
m) macroscopic appearance of the graphitic carbonate phyllite; n) wide graphite stripes in carbonate- quartz-sericite matrix (+N); o) pyrite cubes with quartz fringe in carbonate matrix (+N); p) pressure fringe around a pyrite grain in the graphite carbonate phyllite (+N). Mineral abbreviations after Whitney and Evans (2010)
by carbonate with a moderate amount of quartz. Most samples in cavities, breccia zones as well as along the numerous fractures are oil-spotted (Fig. 2i).
Graphitic carbonate phyllite
These samples distinctively consist of chaotically folded bands of fine-grained black and white material (Fig. 2m). The dark bands are characterized by graphite with some sericite and tiny muscovite flakes. Unlike with the graphitic gneiss mylonite, graphite is an essential rock-forming phase (Fig. 2n). Graphite is present in massive, thick bands interfingering with a small amount of white mica.
Carbonate minerals and a subordinate amount of quartz form the white bands.
Pyrite, the only sulfide mineral, is ubiquitous in this lithology (Fig. 2o). Their grains appear in varying size from sub-millimeter up to around half a centimeter, forming single idiomorphic crystals as well as aggregates. Individual crystals are usually surrounded by fringes of quartz and a small amount of carbonate (Fig.
2p). The pressure fringes are face-controlled and usually deformed (Passchier and Trouw 2005). Samples of this rock unit are fractured; the main vein filling mineral is carbonate with rare quartz.
Results of Raman spectrometry
Representative spectra for each measured rock unit are shown in Fig. 3. The characteristic spectra of the graphitic carbonate phyllite and the graphitic gneiss mylonite samples are significantly different. The intensity of D1 of graphitic
carbonate phyllite is slightly higher than that of the G band, while in the graphitic gneiss mylonite D1, the band is less intense than the G band.
Furthermore, the G band of the mylonite is much narrower than that of the phyllite. The G band in both cases composes a prominent shoulder (D2) on the G band. Numerical results of the Raman spectral analyses are summarized in Table 1, based on 10–13 spectra in each studied sample. The sample heterogeneity in the graphitic carbonate phyllite lithology was found to be generally small, with the average standard deviation on R2 of 0.03. The results for graphitic gneiss mylonite have a greater average standard deviation (0.1). Plotting the results on a histogram (Fig. 4), skewness can be observed toward the smaller R2 values.
The results of the carbonaceous material thermometry are presented in Table 1.
The average difference between the result of Equation 1 (Beyssac et al. 2002) and Equation 2 (Rahl et al. 2005) is about 25 °C. The temperature values for the graphitic carbonate phyllite (n=60) with the different calibrations are 368.1±15 °C (Beyssac et al. 2002), 384.2±38 °C (Rahl et al. 2005) and 369.8±15 °C (Aoya et al. 2010), while for the graphitic gneiss mylonite (n=55) they are higher, being 411.9±45 °C (Beyssac et al. 2002), 387.5±35 °C (Rahl et al. 2005) and 415.6±47 °C (Aoya et al. 2010). The Student's t-test, the statistical probe regularly used to compare means of independent populations, confirms that at a 0.01 significance level the estimated metamorphic peak temperatures for the two units are different.
Results of sutured quartz grains geothermometry
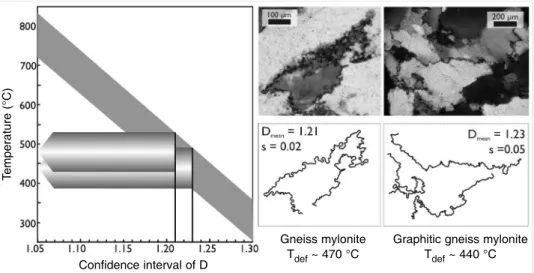
This geothermometer was used in cases of the orthogneiss mylonite and the graphitic gneiss mylonite in order to provide information about temperature conditions of the ductile deformation event. The D value of the sutured quartz grain boundaries was found to be 1.21±0.02 (15 cases) in the orthogneiss mylonite samples, while in the graphitic gneiss mylonite samples D=1.23±0.05 (5 cases) is typical. Using the calibration scheme of Kruhl and Nega (1996) deformation temperatures of Tdef~ 470 °C can be estimated for the orthogneiss mylonite and Tdef~ 440 °C for graphitic gneiss mylonite, respectively (Fig. 5).
Fig. 4
Distribution of R2 values of graphitic gneiss mylonite (Mean = 0.53, Mode = 0.52, Std. Dev.
= 0.13)
Frequency
R2 value
n of Raman emperatures: 1: Beyssac et al. (2002), 2: Rahl et al. (2005), 3: Aoya et al.
Discussion and conclusions
Interpretation of the results of Raman spectrometry and the CM thermometer
Raman spectroscopy of the carbonaceous material thermometer is quite a new method for estimating the characteristic temperature for CM containing-rocks.
Several factors that may influence the measurement and the temperature estimation were previously discussed in numerous papers. The most essential points are summarized here. Measurement on polished surfaces may cause an anomalously high D band. To avoid this effect measurement should be carried out beneath the surface, or on transparent adjacent grains (Beyssac et al. 2003).
According to Beyssac et al. (2003) sample orientation may affect the Raman spectrum, especially in the case of well-crystallized graphite. Therefore it is worth measuring on thin sections oriented perpendicular to foliation. In this way the optical axis of the laser beam is set perpendicular to the mean CM axis.
Aoya et al. (2010) investigated the orientation effect in almost deformation-free contact metamorphosed and deformed regional metamorphosed samples. The measurements were carried out both perpendicular and parallel to the graphite c axis. The result in R2 values shows as little as 0.004 difference (Aoya et al. 2010:
fig 9.), suggesting that the Raman spectroscopy method can be used as a CM thermometer regardless of the crystallographic orientation of CM. Furthermore, for samples nearly free of orientation, R2 values depend on the sample hetero- geneity, if a sufficient number of measurements is carried out (Aoya et al. 2010).
Fig. 5
Estimation of the fractal dimension values (D) of serrated grain boundaries measured on quartz grains from graphitic gneiss mylonite and gneiss mylonite, respectively. Temperature data calculated using the method of Kruhl and Nega (1996)
Temperature (°C)
Confidence interval of D
Gneiss mylonite Tdef~ 470 °C
Graphitic gneiss mylonite Tdef~ 440 °C
The basic measurement parameters, acquisition time and magnification (×50 vs.
×100) have no significant effect on the temperature determination (Aoya et al. 2010).
It is proved that if the wavelength (514.5 nm vs. 532 nm) and the laser energy increase, the D1 intensity decreases compared to that of G. Nevertheless this systematic difference is negligible in temperature estimation (Aoya et al. 2010).
Since the thermometer is based on the structural defects of the metamorphic CM, the effect of pressure or mechanical shearing must be discussed as well.
According to Beyssac et al. (2004) mechanical shearing could be an important source of uncertainty, but based on their results this effect does not contribute more than a few °C uncertainty to the estimated temperature. Aoya et al. (2010) also studied the effect of high differential stress. They consider that the deformed metamorphic CM has higher R2 values because of a greater amount of crystal defects. According to Kwiecinska et al. (2010) pressure can have a distinct influence on the process of physical-structural graphitization. Nevertheless they emphasize the reliability of the thermometer calibrated by Beyssac et al. (2002).
Beyond these factors the CM has a natural heterogeneity (Wiederkehr et al.
2011), which may have an influence on the results of the measurement and temperature estimation. During deposition CM types of various organic precursors that underwent heterogeneous graphitization may mix (Wiederkehr et al. 2011; Rantitsch et al. 2004). Aoya et al. (2010) note that graphitization is a time-dependent process before attaining thermal equilibrium, resulting in larger R2 values of the CM. Heterogeneity may also appear within a single grain (Aoya et al. 2010). Nevertheless, standard parameters, mean and standard deviation usually provide reliable characteristics of the data distribution (Rantitsch et al.
2004); when applying the CM thermometer the average R2 value for the sample must be determined (Aoya et al. 2010). To obtain a reliable metamorphic temperature a substantial number of measurements should be made for each sample (Aoya et al. 2010).
Wiederkehr et al. (2011, fig. 9) compared Raman spectroscopy of CM-derived temperatures with literature data and established that these temperatures are consistently in coincidence with the peak temperature of the given rock unit. The authors studied in detail (2011, fig. 5) the relationship between the calibrations of Beyssac et al. (2002) and those of Rahl et al. (2005). In general the differences are within ±50 °C uncertainty, while the relative errors of the temperature data computed by Rahl et al. (2005) are higher compared to Beyssac et al. (2002), especially for temperatures above 480 °C.
In the measured KIHA-NE samples co-variation of temperature data estimated by the two calibration methods fits well to that observed by Wiederkehr et al.
(2011). Temperatures estimated by Aoya et al. (2010) essentially overlap with those derived from Beyssac et al. (2002). In the case of the graphitic carbonate phyllite unit heterogeneity of the CM is quite small; average standard deviation
just the opposite. Here R2 values show significantly larger average standard deviation (0.1). In addition, its distribution function (Fig. 4) is asymmetric and exhibits a clear skewness towards smaller R2 values. If this high sample heterogeneity were caused by the above-mentioned factors, usually an increase of heterogeneity (deformation, imperfect graphitization), the data would shift toward the higher R2 values (smaller temperatures). That is why it is suggested that the above effects are not responsible for the observed heterogeneity. Instead, rock fragments of diverse metamorphic histories may have become juxtaposed in the mylonite zone. Although the most typical rock type is characterized by T ~ 410 °C, some pieces probably represent even higher temperatures. In the graphitic gneiss mylonite, Raman spectrometry data indicate mixing of rocks of different peak metamorphic conditions along the single time shear zone.
Petrologic interpretation
According to the results of the petrologic and thermometric study, the KIHA- NE Field consists of four main lithological units with incompatible structural and metamorphic evolutions. Each well that samples more lithologies suggests the same systematic spatial order for the four block along the ideal rock column, with orthogneiss, orthogneiss mylonite, graphitic gneiss mylonite and graphitic carbonate phyllite from the bottom to the top (Fig. 6). The figure displays a summary of the thermometric results for the four units outlined above.
Gneiss samples in the lowermost structural position are similar in all mineralogical and textural characteristics to those described by Zachar and M.
Tóth (2004) for the JH uplift. Based on the presence of relic myrmekite as well as euhedral habit of the accessory phases (zircon, apatite) the protolith of this gneiss variety is of igneous origin. Similarly to the JH area, the sporadic appearance of amphibole xenocrysts in the gneiss matrix is typical. There are only a few amphibolite samples available in the KIHA-NE area. They all appear within the orthogneiss-dominated interval, so even if amphibolite pieces do not exhibit a clear evidence for the contact with the gneiss, they should be xenoliths in the orthogneiss body similar to the adjacent JH dome (Zachar and M. Tóth 2004). The presence of the mica-poor granite specimens further strengthens the similarity between the two neighboring localities.
The gneiss mylonite samples have a very similar mineral assemblage and relic textural features to the lowermost orthogneiss body, suggesting that orthogneiss should have been the protolith of the gneiss mylonite and their evolution had to be identical prior to the last ductile deformation event. The typical deformation features, presence of mica fish, bookshelf texture, as well as microboudinage, all indicate mylonitic deformation in an extensional rather than compressive stress field (Passchier and Trouw 2005). According to the retrograde mineral assemblage (sericite, chlorite, carbonate minerals) the ductile deformation took place under low-grade conditions. The quantitative determination of the temperature of mylonitization gives Tdef ~ 470 °C, with a significant but poorly estimated error due to the rough calibration method and the uncertainty of image analysis.
The graphitic gneiss mylonite, on the basis of its mineral composition, can clearly be separated from both the orthogneiss and the graphitic carbonate phyllite. Its undeformed protolith from the adjacent terrains of the basement is still unknown. The carbonaceous material thermometer allows estimating the peak metamorphic temperature of this rock type with T ~ 410±45 °C. The mylonitic deformation of this rock unit can be characterized by extensional textural features at Tdef ~ 440 °C.
According to Árkai (1991) the graphitic carbonate phyllite probably had a marly protolith formed under euxinic facies conditions. Although the mineral assemblages of the two upper lithological units are similar, the evidently different Raman spectra of the carbonaceous materials of the graphitic carbonate phyllite and the graphitic gneiss mylonite samples prove their separate evolution.
Furthermore, carbonaceous material is more homogeneous in the case of the graphitic carbonate phyllite unit resulting in temperature estimations of much lower peak temperature, with smaller uncertainty (370±15 °C).
PTd evolution
Core data from several wells suggest that at the deepest structural position of
Fig. 6
The ideal rock column for the KIHA-NE field with the characteristic temperature data for the metamorphic, structural evolutions of the subsequent rock units. a – orthogneiss; b – orthogneiss mylonite; c – graphitic gneiss mylonite; d – graphitic carbonate phyllite; TCM – temperature of carbonaceous material thermometer by Raman microspectroscopy; Tdef– temperature of deformation by quartz suture thermometer; T1 and T2 – characteristic temperatures (Zachar and M. Tóth 2004)
Temperature (°C) Temperature (°C)
Zachar and M. Tóth (2004) and Zachar et al. (2007). The existence of a SW–NE extending orthogneiss zone in the southern part of the Pannonian Basin was already assumed by Szepesházy (1962) who found that the JH block is the westernmost part of this belt. Assuming the identical nature of the neighboring orthogneiss blocks, the metamorphic conditions of the JH gneiss (T < 580 °C;
Zachar and M. Tóth 2004) can be applied to the KIHA-NE block as well.
Although beside the orthogneiss samples, a highly mylonitized variety is also known from the KIHA-NE area, the transition between the two lithologies is not exposed. In the JH block only a few samples remind of the effect of the post- metamorphic greenschist facies mylonitization event (Zachar and M. Tóth 2004), without any information about the spatial context. A much better-represented situation is reported from the Szeghalom-N area (NE of the KIHA-NE Field) by Schubert and M. Tóth (2002). Here wells penetrated and sampled an almost 150 m-thick shear zone from the undeformed orthogneiss down to the mylonitic core zone, proving continuous change. In spite of missing transitional rock types between orthogneiss and mylonite, a similar situation is assumed for the KIHA- NE area. In the Szeghalom-N Field a mylonitic deformation temperature of Tdef
~ 430 °C was calculated in the orthogneiss using the quartz suture thermometer (Jánosi et al. 2007). A rather similar value can be estimated for the KIHA-NE orthogneiss mylonite samples, suggesting comparable post-metamorphic evolution.
Although the metamorphic evolution of the next block upward along the KIHA-NE ideal rock column is essentially different, the mylonitic deformation temperature of graphitic gneiss mylonite is comparable to that calculated for the orthogneiss mylonite. These Tdef values are also coherent with the textural observation that in both sample groups feldspar deforms in a brittle way (Voll 1980).
The two uppermost lithological blocks consist of similar, but slightly different mineralogical compositions. Calculated metamorphic peak temperatures are also different, but have a slight overlap.
All thermometry data together suggest that the present lithological section exposed in the upper few hundred meters of the KIHA-NE area does not represent an undisturbed piece of the original Variscan lithosphere. Instead, the total thickness of the missing portion is significant. In fact, between the top and the bottom of the ideal rock column there is about 200 °C peak metamorphic temperature deviation. Depending on the local thermal gradient this may mean even reach 5–10 km total difference in formation depth. The metamorphic peak temperature of the graphitic carbonate phyllite is the lowest; it must represent the shallowest portion of the one-time lithosphere. After a several hundred meter-thick hiatus the undeformed variety of graphitic gneiss mylonite follows downward. The position of the orthogneiss block in the original metamorphic column was several km deeper. This picture necessarily implies the presence of post-metamorphic tectonic boundaries between the subsequent lithological units.
Taking the uncertainty of the applied thermometry methods into account, the estimations of peak metamorphic temperature and that calculated for deformation overlap significantly, suggesting mylonitization occurred close to the deepest point of the metamorphic evolution of the graphitic gneiss mylonite.
Furthermore, this value is identical to that calculated for mylonitization of the orthogneiss block. So, both the textural features implying deformation in extensional regime and the estimated temperatures (~455 °C), are rather similar for the two mylonitic lithologies. This suggests that although physical conditions of the peak metamorphism were significantly different, the last deformation events of the two bodies are in close relationship. The two contrasting metamorphic blocks became juxtaposed along an extensional fault zone in the basement at approximately 15 km depth (Fig. 7). We assume that the same event may have been responsible for transportation of the graphitic carbonate phyllite on top of the graphitic gneiss unit. As a result of the large-scale motion several km of material has disappeared due to tectonic erosion.
The appearance of blocks of contrasting metamorphic evolution in a relatively small region is not uncommon in the basement of the Pannonian Basin. A similar situation has previously been inferred in the Mezõsas-Furta, Szeghalom and Dorozsma areas (M. Tóth and Zachar 2006; Schubert and M. Tóth 2002; M. Tóth and Zachar 2002; M. Tóth et al. 2002). The age of this tectonic event, essential for a significant part of the metamorphic basement, is still unknown. Following mylonitization the entire basement block was consolidated, uplifted and probably exhumed to the surface, as is indicated by surface weathering of the graphitic carbonate phyllite, proved by Árkai (1991).
Acknowledgements
We thank MOL Hungarian Oil and Gas Company for making the study of the samples and thin sections possible. Balázs Kiss is thanked for the fruitful discussions about the behavior of the KIHA-NE reservoir.
Kálmán Török is thanked for a thorough review and constructive criticism. The publication is supported by the European Union
Fig. 7
A hypothetical outline sketched for the development of the current rock bodies along the mylonitic shear zone
Depth (km)
Research University Centre of Excellence at the University of Szeged by ensuring the rising generation of excellent scientists." Project number: TÁMOP-4.2.2/B- 10/1-2010-0012. The procurement of the THERMO DXR Raman microscope was financially supported by the Gábor Baross Program (Baross - DA07-DA-ESZK-07- 2008-0007).
References
Árkai, P. 1991: Kishõmérsékletû regionális metamorfózis (Low temperature regional metamorphism). – DSc Thesis. Budapest, 190 p.
Árkai, P. 1978: A Kiskunhalas ÉK-i terület mezozoikumnál idõsebb metamorf és magmás képzõdményeinek szénhidrogénprognózist elõsegítõ ásványtan-kõzettani és geokémiai vizsgálata (Mineralogical-petrological investigation of the igneous and metamorphic formations of the Kiskunhalas-NE region older than Mesozoic to improve hydrocarbon prognostics). – MTA GKI, Manuscript.
Aoya, M., Y. Kouketsu, S. Endo, H. Shimizu, T. Mizukami, D. Nakamura, S. Wallis 2010: Extending the applicability of the Raman carbonaceous-material geothermometer using data from contact metamorphic rocks. – J. Metamorphic Geol., 28/9, pp. 895–914.
Beyssac, O., B. Goffé, C. Chopin, N. Rouzaud 2002: Raman spectra of carbonaceous material in metasediments: a new geothermometer. – J. Metamorphic Geol., 20, pp. 859–871.
Beyssac, O., B. Goffé, J.-P. Petitet, E. Froigneux, M. Moreau, J.-N. Rouzaud 2003: On the characterization of disordered and heterogeneous carbonaceous materials by Raman spectroscopy. – Spectrochimica Acta Part A, 59, pp. 2267–2276.
Beyssac, O., L. Bollinger, J-P. Avouac, B. Goffé 2004: Thermal metamorphism in the lesser Himalaya of Nepal determined from Raman spectroscopy of carbonaceous material. – Earth and Planetary Science Letters, 225, pp. 233–241.
Cserepes, L. 1980: A Duna–Tisza Közi karbonnál idõsebb képzõdmények petrológiai vizsgálata (Petrologic study of the formations older than Carboniferous of the Danube–Tisza Interfluve). – MSZKFI, Budapest, 159 p.
Cserepes-Meszéna, B. 1986: Petrography of the crystalline basement of the Danube–Tisza Interfluve (Hungary). – Acta Geologica Hungarica, 29/3–4, pp. 321–339.
Csontos, L., A. Nagymarosi 1998: The Mid-Hungarian line: a zone of repeated tectonic inversion. – Tectonophysics, 297, pp. 51–71.
Haas, J., T. Budai, L. Csontos, L. Fodor, Gy. Konrád 2010: Pre-Cenozoic geological map of Hungary, 1:500 000. – Geological Institute of Hungary.
Hirth, G., J. Tullis 1992: Dislocation creep regimes in quartz aggregates. – Journal of Structural Geology, 14, pp. 145–159.
Jánosi, T., T. M. Tóth, Zs. Jánosi 2007: Kvarc szutúra mintázatok képanalízise és termometriai alkalmazásuk (Image analysis and termometrical application of quartz suture patterns). – Conference on Mining, Metallurgy and Geology Buziásfürdõ, pp. 206–209.
Kruhl, J. H., M. Nega 1996: The fractal shape of sutured quartz grain boundaries: application as a geothermometer. – Geol. Rundsch, 85, pp. 38–43.
Kwiecinska B., I. Suárez-Ruiz, C. Paluszkiewicz, S. Rodriques 2010: Raman spectroscopy of selected carbonaceous samples. – International Journal of Coal Geology, 84, pp. 206–212.
Lahfid, A., O. Beyssac, E. Deville, F. Negro, C. Chopin, B. Goffé 2010: Evolution of the Raman spectrum of carbonaceous material in low-grade metasediments of the Glarus Alps (Switzerland). – Terra Nova, 22, pp. 354–360.
Majumder, S., M.A. Mamtani 2009: Fractal analysis of quartz grain boundary sutures in a granite (Malanjkhand, Central India) – Implications on Infer Regional Tectonics. Journal Geological Society of India, 73, pp. 309–319.
Mandelbrot, B.B. 1967: How long is the coast of Britain? Statistical self-similarity and fractional dimension. – Science, 156, pp. 636–638.
Masuda, T., A. Fujimura 1981: Microstructural development of fine-quartz aggregates by syntectonic recrystallization. – Tectonophysics, 72, pp. 105–128.
M. Tóth, T., F. Schubert, T. Földes, Cs. Hollós, J. Komlósi 2002: Modelling of the fractured Dorozsma crystalline reservoir, SE Pannonian Basin. – EAGE Annual Meeting Abstracts, pp. 297.
M. Tóth, T., J. Zachar 2006: Petrology and deformation history of the metamorphic basement in the Mezosas–Furta crystalline high (SE Hungary). – Acta Geologica Hungarica, 49/2, pp. 165–188.
Nemanich, R.J., S.A. Solin 1979: First- and second-order Raman scattering from finite-size crystals of graphite. – Physical Review B, 20, pp. 392–401.
Passchier, C.W., R.A.J. Trouw 2005: Microtectonics. – Springer, Berlin Heidelberg, 366 p.
Rahl, J.M., K.M. Anderson, M.T. Brandon, C. Fassoluas 2005: Raman spectroscopic carbonaceous material thermometry of low grade metamorphic rocks: Callibration and application to tectonic exhumation in Crete, Greece. – Earth and Planetary Science Letters, 240/2, pp. 339–354.
Rantitsch G., R.F. Sachsenhofer, C. Hasenhuttl, B. Russegger, T. Rainer 2005: Thermal evolution of an extensional detachment as constrained by organic metamorphic data and thermal modeling:
Graz Paleozoic Nappe Complex (Eastern Alps). – Tectonophysics, 411, pp. 57–72.
Schubert, F., T. M. Tóth 2002: Structural evolution of mylonitized gneiss zone from the Norther flank of the Szeghalom dome (Pannonian Basin, SE, Hungary). – Acta Min. Pet. Szeged, 42,
pp. 59–64.
Szepesházy, K. 1962: Mélyföldtani adatok a Nagykõrös–Kecskeméti területrõl (Deep structure data from the Nagykõrös–Kecskemét area). – Földtani Közl., 92, pp. 40–52.
T. Kovács, G. 1973: A Duna–Tisza köze déli részének földtani fejlõdés története (Geological evolution of the southern part of the Danube–Tisza Interfluve). – PhD. Thesis, JATE, Szeged, Hungary.
T. Kovács G., B. Kurucz 1984: A Dél-Alföld mezozoikumnál idõsebb képzõdményei (Formations older than Mezozoic of the Southern Great Hungarian Plain). – MÁFI, Budapest.
Takahashi, M., H. Nagahama, T. Masuda, A. Fujimura 1998: Fractal analysis of experimentally, dynamically recrystallized quartz grains and its possible application as a strain rate meter. – Journal of Structural Geology, 20/2–3, pp. 269–275.
Tuinstra, F., J.L. Koenig 1970: Raman spectrum of graphite. – Journal of Chemical Physics, 53, pp.
1126–1130.
Zachar, J., T. M. Tóth 2001: Myrmekite-bearing gneiss from the Szeghalom Dome (Pannonian Basin, SE Hungary) Part II.: Origin and spatial relationships. – Acta Min. Pet. Szeged, 42, pp. 39–43.
Zachar, J., T. M. Tóth 2004: Petrology of the metamorphic basement of the Tisza Block at the Jánoshalma High, S Hungary. – Acta Geologica Hungarica, 47/4, pp. 349–371.
Zachar, J., T. M. Tóth, M. Janák 2007: Kyanite eclogite xenoliths from the orthogneiss terrane of the Tisza Megaunit, Jánoshalma area, crystalline basement of southern Hungary. – Lithos, 99, pp. 249–265.
Yui, T.F., E. Huang, J. Xu 1996: Raman spectrum of carbonaceous material: a possible metamorphic grade indicator for low-grade metamorphic rocks. – J. Metamorph Geol., 14, pp. 115–124.
Voll, G. 1980: Ein Querprofil durch die Schweizer Alpen vom Vierwaldstatter See zur Wurzelzone- Strukturen und ihre Entwicklung durch Deformationsmechanismen wichtiger Minerale. – Neues Jahrbuch für Geologie und Paläontologie, Abhandlungen, 160, pp. 321–335.
Wiederkehr, M., R. Bousquet, M. A. Ziemann, A. Berger, S.M. Schmid 2011: 3-D assessment of peak- metamorphic conditions by Raman spectroscopy of carbonaceous material: an example from the margin of the Lepontine dome (Swiss Central Alps). – Int. J. Earth Sci. (Geol Rundsch), 100/5, pp. 1029–1063.
Whitney, D.L., B.W. Ewans 2010: Abbreviations for names of rock-forming minerals. – American Mineralogist, 95, pp. 185–187.