DOI: 10.1556/606.2018.13.1.5 Vol. 13, No. 1, pp. 57–64 (2018) www.akademiai.com
EFFECTS OF SUB-BASE SURFACE ROUGHNESS ON SHRINKAGE CRACKING OF INDUSTRIAL FLOORS
1 Dávid PAPP, 2 Zoltán ORBÁN
Department of Civil Engineering, Faculty of Engineering and Information Technology University of Pécs, Boszorkány u. 2, H-7624 Pécs, Hungary
e-mail: 1papp.david.pecs@gmail.com, 2orbanz@mik.pte.hu Received 31 December 2016; accepted 1 October 2017
Abstract: Avoiding the formation of shrinkage cracks is one of the most important tasks in construction of concrete industrial floors. Cracks appear on the surface of floors when the non- linear processes in the structure lead to internal stresses that exceed the actual tensile strength of the concrete. The tensile stresses developed depend on the constrained deformation of the floor during shrinkage and the elastic modulus of the material of the concrete slab. However, on the top surface of the floor, the tensile stresses can be increased, if the shrinkage deformations are constrained by the uneven evaporation and the generated friction between the sub-base and the floor. The value of friction coefficient is depended primarily on the surface roughness of the sub- base and the type of polyethylene foil used between the sub-base and the concrete slab. The paper presents the results of experimental investigations on the friction coefficient and the effects of its value on the cracking process of industrial concrete floor slabs.
Keywords: Crack, shrinkage, restrained deformation, sub-base course roughness
1. Introduction
The constrained shrinkage, that generates tension in the floor, is resulted from the uneven evaporation along the cross section and also the friction between the concrete floor and the sub-base surface.
In this subject, several researchers have carried out tests on specimens to investigate this phenomenon [1], [2] [3] or made statements on the subject [4], [5], [6]. Based on their experimental results the following observations were made:
• The shrinkage deformation of the specimens depends upon geometrical characteristics, technology of casting, environmental conditions and the evaporating surface area of the specimens;
• The thickness of the specimen fundamentally influences the shrinkage deformations along the cross-section. Thicker specimens with smaller evaporating Surface/Volume (A/V) ratio undergo smaller shrinkage deformation and its ultimate value is reached at a later time;
• The constrained deformation can be described by the differences of the measured shrinkage deformation at the edges and the center line of the specimen;
• The rate of friction between the sub-base and the concrete floor is a fundamental factor for the formation of tensile stresses that cause cracks in the floor.
Fig. 1 shows the friction free deformation of a prism specimen that is capable to evaporate through three sides. The test’s results mean good basis for this research, however real conditions at industrial floors differ from this idealized case, therefore further considerations are needed to be made. In case of industrial floors water can evaporate only through the upper surface of the floor slab and the friction between the sub-base and the slab constrains deformations at the lower surface. Both effects generate additional tensile stresses that increase the probability of cracking.
Fig. 1. Shrinkage strain along rectangular cross section, [2]
The friction between connecting surfaces was considered a shear-like effect in earlier literature [7], [8], [9] and was described by using Mohr-Coulomb criteria. In these models the surface roughness of the sub-base was taken into account by the cohesion factor. In case of small normal stresses and surfaces with small roughness the slip of the connecting surfaces can simply occur, and the proposed formulas could describe the real behavior with appropriate accuracy. However, in case of higher normal stresses and surface roughness (described as the elevation difference between two points at the surface of the slab) the shear stresses considerably increase [10], because relative slip of the connecting surfaces requires break of the contacts. To take account of this
effect Barton [7], [8], [11] further developed the previously proposed formula as follows:
( )
, log
tan , tan
¸¸
¹
·
¨¨
©
§ ¸¸¹·
¨¨©§
⋅ +
⋅
=
+
⋅
=
n b
n n
JRC JCS c φ σ σ
τ
φ σ τ
(1)
where ın is the normal stress; c is the cohesion; b is the basic friction angle of the surface; JRC is a parameter that accounts for the difference between the actual roughness of the surface and a perfectly smooth surface; JCS is a parameter that describes the shape and contacting surface of the grains in the sub-base.
In the tests carried out the required forces were measured that initiated and maintained the movement of plate specimens with a given weight and size on sub-bases of various type. The method was developed to investigate the effect of the contact between the sub-base and the concrete slab on the formation of cracks in the slab. This contact was characterized by the friction coefficient. Based on the results of these tests a model has been developed to describe the constrained deformations and the additional tensile stresses formed in the concrete slab.
2. Description of tests
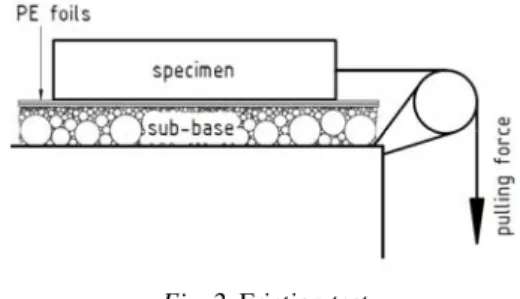
Test series were carried out to gain better knowledge on the problem described above and help to develop an appropriate calculation model. The configuration of the test is shown on Fig. 2.
Fig. 2. Friction test
The boundary conditions of the tests were the followings:
• The tests were carried out on a vertically fixed surface;
• The sub-base layer was laterally fixed;
• As there were no measurable sagging anticipated for the applied 30-60 kg concrete plates, the application of a 10 cm thick sub-base layer with hand compaction in two layers was considered appropriate. The applied sand and 0/45 fine and coarse aggregate sub-base materials were well compactable.
However, it was more difficult to compact the 4/11 course aggregate layers as the fine particles were missing from this material;
• After compaction the unevenness of the surface was minimized. According to Lohmeyer [3] the working surface of the sub-base should be made in a way that the difference between the actual and designed elevation of the surface, and the difference between the elevation of two points selected on any 4 m length section do not exceed 2 centimeters;
• The roughness of the sub-base varied according to the application of three different materials (sand, 0/45 and 4/11 course aggregates);
• The concrete slab was prepared on two-layer, 80 and 150 micron thick PolyEthylene (PE) foils into a mould;
• The size of the mould (50 cm x 50 cm x 5 cm) was large enough to ensure proper contact between the slab and the sub-base;
• During the tests gradually increasing pulling force was applied with the help of gravity.
The test was carried out in three series:
• Test series I: The weight of the slab specimens were 30 kg in all cases. The surface roughness of the sub-base was varied according to the applied materials (sand, 4/11, 0/45 aggregates). Two layers, 80 micron thick PE foils were applied between the slab and the sub-base;
• Test series II: The weight of the slab specimens were 30 kg in all cases. The surface roughness of the sub-base was varied according to the applied materials (sand, 4/11, 0/45 aggregates). Two layers, 150 micron thick PE foils were applied between the slab and the sub-base;
• Test series III: The weight of the slab specimens were 60 kg in all cases. The surface roughness of the sub-base was varied according to the applied materials (sand, 4/11, 0/45 aggregates). Two layers, 150 micron thick PE foils were applied between the slab and the sub-base.
Following the test the unevenness of the bottom surface of the slab specimens was measured. This value (e.g. the difference from a perfectly smooth surface) was 0.7-1.0 cm in case of the concrete slab casted on 0/45 sub-base and maximum 0.5 cm for the one casted on the 4/11 sub-base. In case of sand sub-base the surface of the concrete slab was much smoother and the unevenness of the surface remained below 0.3 cm.
As it was expected [12] the effect of the shear stress between the layers has measurably decreased by the use of a thicker foil, and also the movement of the specimen slabs has slowed down. This very slow movement can be explained by the fact that the difference between the bonding and sliding friction coefficients becomes negligible with the application of an appropriately thick foil, and consequently the steep parts and the hoops of the diagram in Fig. 3 disappears.
The individual results of the test series are given as follows (Table I-Table III):
Fig. 3. Connection between the shear strength, the normal stress and the displacement, [7]
Table I
The measured friction coefficient, test series I
Sub-base
Net weight
[kg]
Pulling force [kg]
Friction coefficient
Movements of element 0/45 - slightly wet 30.6 31.7 1.0 gradually
accelerating
0/45 - dry 30.8 26.8 0.9 gradually
accelerating
sand - dry 33.2 21.8 0.7 slow
sand - wet in paches 35.1 25.5 0.7 slow 4/11 - dry-slightly
wet, rough-flat grains 31.4 31.8 1.0 fast
4/11 - dry-slightly
wet, rough-flat grains 35.2 39.9 1.1 fast
Weight of specimen: 30 kg, thickness of foils: 80 micron Table II
The measured friction coefficient, test series II Sub-base Net weight
[kg]
Pulling force [kg]
Friction coefficient
Movements of element
0/45 - dry 34.5 33.5 0.97 medium speed
0/45 - dry 33.7 38 1.13 medium speed
sand - dry 36 20 0.56 very slow
sand - dry 34 19.5 0.57 very slow
4/11 - dry-slightly wet,
rough-flat grains 29.5 26.8 0.91 medium speed
4/11 - dry-slightly wet,
rough-flat grains 32.3 29.2 0.90 medium speed
Weight of specimen: 30 kg, thickness of foils: 150 micron
Table III
The measured friction coefficient, test series III Sub-base Net weight
[kg]
Pulling force [kg]
Friction coefficient
Movements of element
0/45 - dry 61.5 68 1.11 medium speed
0/45 - dry 63 72 1.14 medium speed
sand - dry 60.7 34 0.56 very slow
sand - dry 62 36.5 0.59 very slow
4/11 - dry-slightly wet,
rough-flat grains 62 59 0.95 medium speed
4/11 - dry-slightly wet,
rough-flat grains 63.5 60.8 0.96 medium speed
Weight of specimen: 60 kg, thickness of foils: 150 micron
3. Results
Based on the measure data it can be stated that:
• With the application of thicker foils the movement of the slab specimens has considerably slowed down, as the difference between the bonding and sliding friction coefficients has practically disappeared;
• The increase in the weight of the specimens from 30 kilograms to 60 kilograms resulted measurable change in the friction coefficient only in the case of the sub- base made with 4/11 aggregate;
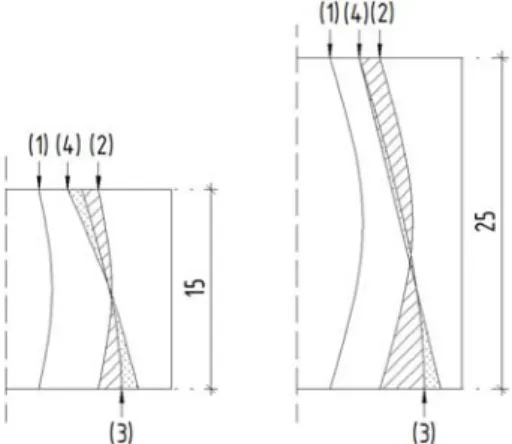
• The significance of uneven evaporation and the friction is demonstrated in Fig. 4.
Fig. 4. Effect of uneven evaporation and friction
In case of single-sided evaporation, the evaporating water amount and also the maximum value shrinkage strikingly decrease (2). Because of the distribution of the evaporating water amount, the diagram is shifted as signed (3). The neutral
plane takes a new position, but the areas signed with striped curve between the diagrams can approximately be taken as equal areas. Consequently the normal component of the stress resulted forces is equal to zero [13]. The friction effect developed on the bottom surface of the slab further constrains deformations along the bottom fiber (4). Consequently tensile stresses increase on the upper side of the slab specimen. The effect of the friction coefficient is more determining in case of slabs with smaller thickness, and this effect gradually decreases with enhanced slab thickness.
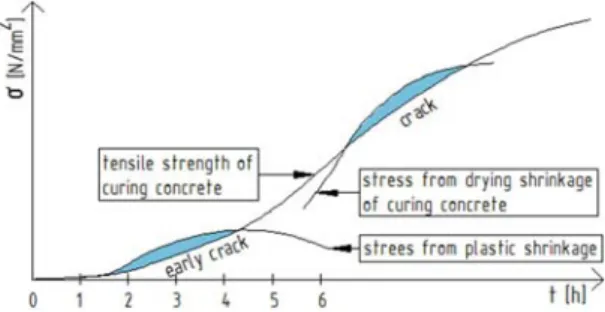
• The development of shrinkage, concrete’s modulus of elasticity and tensile strength in time can be accurately described by the application of appropriate material models (e.g. ACI 209, Bazant B3, CEB MC90, EC etc.) [14], [15], [16]. Based on the knowledge of the constrained deformations along the cross section and the development of the elastic modulus in time, the tensile stresses in the upper fiber of the slab due to the uneven evaporation and friction effects can be predicted. Comparison of actual tensile stresses with the actual tensile strength of the slab (Fig. 5) can give the critical time intervals when formation of cracks can be expected [17]. This knowledge enables the application of suitable measures to avoid cracks.
Fig. 5. Background of the formation of cracks
4. Conclusions
It has been pointed out that the constrained deformations of concrete in industrial slab structures are influenced mainly by the uneven evaporation from the surface and the friction between the sub-base and the concrete. Conclusions of the analytical and experimental research carried out bring us closer to the accurate description of the actual tensile strength distribution along the cross section of the slab caused by constrained deformations. The results of the survey help develop suitable technical solutions to prevent crack formation in industrial floor slabs.
Acknowledgements
This work has been undertaken as a part of a project founded by the Faculty of Engineering and Information Technology, University of Pécs.
References
[1] Dong W., Zhou X., Wu Z., Kastiukas G. Effect of specimen size on assessment of shrinkage cracking of concrete via elliptical rings: Thin vs. thick, Computers and Structures, Vol. 174, 2016, pp. 66−78.
[2] Balázs Gy. Special concrete and concrete technology. Vol. II (in Hungarian) Akadémia Kiadó, Budapest, 2009.
[3] Dong W., Zhou X., Wu Z. A fracture mechanics-based method for prediction of cracking of circular and elliptical concrete rings under restrained shrinkage, Engineering Fracture Mechanics, Vol. 131, 2014, pp. 687–701.
[4] Lohmeyer G., Ebeling K. Concrete slab in factory and storage hall - Planning, design, construction, (in Hungarian) Publikál Ltd, Budapest, 2008.
[5] Younis K. H., Pilakoutas K. Assessment of post-restrained shrinkage mechanical properties of concrete, ACI Materials Journal, Vol. 113, No. 3, 2016, pp. 267−276.
[6] Antona B., Johansson R. Crack control of concrete structures subjected to restraint forces, MSc Thesis, Department of Civil and Environmental Engineering, Chalmers University of Technology, Goteborg, Sweden, 2011.
[7] Hoek E., Kaiser P. K., Bawden W. F. Shear strength of discontinuities, In: Support of underground excavations in hard rock, E. Hoek, P. K. Kaiser, W.F. Bawden (Eds.), Chapter 5, Toronto, 1995.
[8] Tesfamariam E. K. Comparing discountinuity surface roughness derived from 3D terrestrial laser scan data with traditional Field-based methods, MSc Thesis, International Institute for Geo-Information Science and Earth Observation, Enschede, Netherlands, 2007.
[9] Boucz I., Rozgonyi-Boissinot N., Török Á., Görög P. Direct shear strength test on rocks along discontinuities, under laboratory conditions, Pollack Periodica, Vol. 9, No. 3, 2014, pp. 139–150.
[10] Mohamad M. E., Ibrahim I. S., Abdullah R., Rahman A. B., Kueh A. B. H., Usman J.
Friction and cohesion coefficients of composite concrete-to-concrete bond, Cement &
Concrete Composites, Vol. 56, 2015, pp. 1–14.
[11] Tannant D., Bahrani N., Gulati V. A. Bedding surface roughness profiles and estimateddilation angles, 61st Canadian Geotechnical Conference, Edmonton, Canada, 21-24 September 2008, pp. 588−595.
[12] Safranyik F., Csatár A., Varga A. Experimental method for examination of state dependent friction, Progress in Agricultural Engineering Sciences, Vol. 11, 2015, pp. 29–42.
[13] Fiedler J., Koudelka T. Numerical modeling of foundation slab with concentrated load, Pollack Periodica, Vol. 11, No. 3, 2016, pp. 119–129.
[14] ACI - Guide for modeling and calculating shrinkage and creep in hardened concrete, American Concrete Institute, Farington Hills, 2008.
[15] Bazant Z. P., Murphy W. P. Creep and shrinkage prediction model for analysis and design of concrete structures, Materials and Structures, Vol. 28, 1996, pp. 357−365.
[16] Wu S., Huang D., Lin F. B., Zhao H., Wang P. Estimation of cracking risk of concrete at early age based on thermal stress analysis, J Therm Anal Calorim, Vol. 105, 2011, pp. 171–186.
[17] Arany P., Balázs Gy., Balázs L. Gy., Buday T., Erdéi A., Forgács Sz., Illés F., Kaussay T., Kovács K., Liptay A., Migály B., Pluzsik T., Révay M., Salem G. N., SzegĘné K. É., SzegĘ J., Szilágyi J., Tariczky Zs., Tóth T., Újhelyi J., Zsigovics I. Holcim - Cement-concrete handbook, (in Hungarian) Pátria Nyomda Zrt, Budapest, 2008.
![Fig. 3. Connection between the shear strength, the normal stress and the displacement, [7]](https://thumb-eu.123doks.com/thumbv2/9dokorg/1416964.119743/5.892.192.638.192.383/fig-connection-shear-strength-normal-stress-displacement.webp)