The Composite Coincident Indicator (CCI) for Business Cycles
Yuriy Bilan
a, Beata Gavurova
b, Gędek Stanisław
c, Andrea Tkacova
da University of Szczecin, Faculty of Economics Science and Management, Mickiewicza 64, 70-101, Szczecin, e-mail: jurij@wneiz.pl
b,d Technical University of Košice, Faculty of Economics, Němcovej 32, 040 01 Košice, e-mail: beata.gavurova@tuke.sk, andrea.tkacova@tuke.sk
c Rzeszów University of Technology, Faculty of Management, al. Powstańców Warszawy 10, 35-959 Rzeszów, e-mail: gedeks@prz.edu.pl
Abstract: The aim of this paper is to introduce a composite coincident indicator for the Slovak economic cycle. The theoretical part of the work is concentrated on the analysis of current monitoring options of economic cycle using GDP, industrial production index and composite indicators. The analytical part of the work pays attention to authors’ own composite coincident indicator and to testing its monitoring capabilities. Methodology used in this paper is a combination of the methodologies by the OECD, Conference Board and the authors of this paper. Such methods as seasonally adjusted time series, Hodrick- Prescott filter, standardization and cross-correlations are used as applied to 134 indicators of Slovak economy. Coincident cyclic indicators are selected from them, as they form the basis for Slovak composite coincident indicator. The resulting coincident composite indicator for Slovakia is made up of four indicators – employment in manufacturing, export of goods and services, the number of hours worked in industry and industrial turnover. The assembled indicator is then tested over time and a need for change in its composition as a result of significant economic changes is grounded. Significant changes in the composition of coincident cyclical indicator for 2010 are also proved. For the period of 2010-2015 a new composite coincident indicator is suggested of the composition of production index in the construction industry, a factor limiting production - insufficient demand, unemployment in the age group of 25-74 y.o. and short-term interest rate.
Keywords: business cycle; composite coincident indicator; gross domestic product, industrial production index
1 Introduction
Business cycles can be presented as some sort of fluctuations within overall economic activity of countries that are basing their economies primarily on business enterprises. Such a cycle consists of expansions taking place during roughly same time in a range of economic activities, always followed by overall recession or some sort of other contractions, while revivals later merge into the expansion phase of a new, next cycle. This standard order of changes repeats itself in time, however, it is not periodic. In their duration, business cycles may vary from roughly a year to a decade or even more. Moreover, business cycles cannot be divided into shorter cycles of similar character and same volume of amplitude [1, 2]. From the time of Burns and Mitchell (1946), monitoring of the economic cycle is the subject of interest for many economists and international organizations such as the Eurostat, the OECD, the US Conference Board, and national statistical offices. The primary challenge in the pursuit of cyclical economic development is choosing the right economic indicator that by its nature would be able to replicate the economic cycle as accurately as possible. It is generally considered to be the best indicator of gross domestic product (GDP), which describes the development of economy and its cyclical behavior as a whole [3]. The growing influence of industry in most of the world´s economies convinced some economists that the Industrial Production Index is an equally appropriate indicator to monitor economic cycles. This observation is true in general, but in some countries the index of industrial production does not meet the basic assumptions that have oriented it to the representation of the economic cycle. For this reason, economists are designing new indicators, which by their nature seek to replace GDP due to the complexity and demands of their calculation. In this context, we encounter terms like composite, complete or complex indicators, which are composed of sub- economic indicators, corresponding with the development of GDP and can be used to monitor economic cycles [4]. There are many approaches in the world to the creation of composite indicators. Examples include works of Stock and Watson in 1991 and 1992 that describe the structure and advantages of the composite indicator, and are based on the work of Burns and Mitchell [5, 6].
Hamilton (1989) has shown that a set of coincident and upstream parameters for the production of composite indicators can be modeled [7]. On this basis, it is possible to identify and predict the turning points of an economic cycle [8].
The paper aims to form a coincident composite indicator (CCI), which can be used to monitor the cycle of the selected country. The theoretical part is devoted to review of the studies, which monitor the cyclical developments in the economy, by GDP, the industrial production index and CCI. By examining historical work, a methodology for indicator calculation is introduced applicable to any country. The analytical part demonstrates d its practical application on the example of Slovakia´s economic cycle. Then, it is examined for changes overtime, in the composition of the CCI.
2 Basic Monitoring Options of Economic Cycles
2.1 Gross Domestic Product (GDP)
The most commonly used indicator of monitoring the cyclical development of the economy is GDP (Gross Domestic Product) at constant prices, which is generally considered to be the broadest indicator of economic activity [9]. Real GDP provides the best representation that covers a broad range of economic activities and adequately reflects each of the real economic sectors in the country [10].
Eurostat defines GDP as a high quality economic indicator that best describes the cyclical behavior of the economy and can be set based on turning points that indicate economic growth, resp. economic downturn [11]. In the analysis it is not being used in the form of raw data, but the GDP time series is edited, only the cyclical component selected and analyzed [12]. There are many options for obtaining the cyclical component. The most commonly used methods to eliminate the trend and seasonal ingredients are Christiano-Fitzgerald (CF) filter, Hodrick- Prescott (HP) filter, or the Phase Average Trend method (PAT). The methods differ from each other, have their advantages and disadvantages [13]. GDP drawback is its temporal availability [14]. It is now featured in the form of quarterly data and is available with a delay of one or even two quarters, which is a problem in determining the current position of the economy as well as in predicting cyclical behavior of the selected economies [15]. Therefore, in practice, quarterly estimates of GDP are being used, that are of great value for policy makers and for assessment of its status in real time. In 2012, however, the OECD acceded to the making of methodology for decomposition of GDP and achieved a time series of GDP estimates on a monthly basis. Monthly estimates of GDP now represent a natural alternative for the composite coincident indicator. For the UK, Mitchell, Smith, Weale, Wright, and Salazar suggest a formal procedure to combine information about a range of monthly series into indications of short- term movements in output. Their assessment of the efficacy of the approach to evaluate the state of economic activity is rather satisfactory [16]. Significant problems of the GDP estimates are revisions, which are in macroeconomic indicators large and common [17-21]. Therefore, working with the last available data may provide starkly different results than those obtained using real-time data [22-24]. In particular, in forecasting applications, neglecting data revisions might substantially understate forecast errors [25].
2.2 Index of Industrial Production (IPI)
The Industrial Production Index (here and further - IPI, also known as the industrial output index or the industrial volume index) is one of the acknowledged globally business cycle indicator. It measures monthly change in the price- adjusted output of the national industrial production. IPI is one of the most
relevant and widely used short-term indicators in contemporary statistical analysis. It is usually used to identify the turning points in economic development at some early stage and it also assesses future development of GDP. For this matter, data in it is available on the monthly basis and in a rather detailed breakdown by activities. Noteworthy, this data is provided with a relatively short delay (1 month and 10 days). The industrial production index also belongs to the so-called Principal European economic indicators (PEEI)'which are used to monitor and reconsider economic and monetary policies within the EU and inside the Eurozone specifically [26]. The advantages of the industrial production index for monitoring the cyclical behavior of the economy in the long term used the OECD. This institution used IPI by March 2012 for major cyclical indicator precisely because of faster and more frequent time access compared to GDP [27].
Bascos-Deveza argues that Real Gross Domestic Product is the most comprehensive measure of overall economic activity. The second most complex indicator is currently the IPI, which should be used for verification of consistency of the business cycle [28].
In monitoring the global economic cycle the monthly IPI has ranked among the most important coincident indicators with the quarterly GDP [29]. IPI is not suitable as a main indicator tracking the cyclical development of the economy in all countries [10]. The disadvantage of the use of industrial production index for Slovakia is that it does not follow the trend of transition economies [30]. Another reason is that the index of industrial production, in some countries, may act as a leading indicator, that does not develop in coincident but with some time before the development of GDP, which precludes its use as a concurrent indicator.
Tkáčová, Siničáková and Králik explored in their study the cyclical properties of selected indicators of cyclical industries in the V4 countries in the years 1995- 2011. IPI was among the leading indicators in Poland, the Czech Republic and Slovakia. In Hungary it showed signs of concurrent indicator of Hungary's GDP [31]. Other problems associated with the industrial production index, also means that it indicates more turning points than GDP and can be a source of false signals even when converted to quarterly data [32].
2.3 Composite Indicator
The third option of monitoring the cyclical behavior of the economy is to create a unique composite indicator, which includes a number of selected cyclical indicators. We are talking about composite indicator of cyclical economic developments, which reflects the development of the economy and its cyclical behavior better than individual indicators alone. GDP or industrial production index are created in the case of reference range of composite indicators, which is the basis for its calculation. Choice of cyclical indicators into a composite indicator is not accidental, but is conditioned by their economic significance, explanatory value and statistical quality [33, 34].
Currently, there are several views on the composition of the composite indicator of cyclical economic developments. OECD believes that economies differ, and therefore the composition of the composite indicator varies depending on the country. On the contrary, Eurostat noted that economic cycles can be tracked through the composite indicator of the same composition [35]. In the case of composite indicators, the leading composite indicator is the most important that represents the aggregated time series showing ahead of the reference array representing the economic cycle of the selected country [27]. A composite indicator that can reproduce the cyclical development of the economy represents a coincident composite indicator (Composite Coincident Indicator - CCI).
Coincident indicators were viewed as useful tools for assessing the current condition of the business cycle and now casting [36, 37].
Cyclical indicators have been used for many years as tools to understand the aggregate U.S. economy. The National Bureau of Economic Research (NBER) published the first formal list of cyclical indicators in 1938. NBER then produced revised lists in 1950, 1961, and 1967. In 1975, in cooperation with NBER staff, BEA completed a comprehensive review of existing statistical indicators and began publishing cyclical indicators, including composite (leading, coincident and lagging) indices. In early 1996, the preparation and publication of cyclical indicators was transferred to The Conference Board. Today, The Conference Board maintains and publishes over 250 analytical indicators as part of its responsibility for producing and publishing the three composite cyclical indicators for the United States (leading, lagging, coincident) [38]. The composite coincident indicator designed by Conference Board includes employees on nonagricultural payrolls, personal income less transfer payments, index of industrial production and manufacturing and trade sales [39]. The Index of Coincident Indicators is issued monthly in a press release along with the other Business Cycle Indicator data [40]. Conference Board methodology used, for example, also by Marcellino but during the construction of leading composite indicator for the UK business cycle [41].
McGunckin, Ozyildirim and Yarnowitz noted that over time, it needs access to the translation of the composite indicator. The main reason is the availability of indicators, which in the past may not have been available (mainly on a monthly basis), and use more modern methods to produce composite indicator [42].
Carriero and Marcellino claim that there is an overall over time change in components forming the CCI [43]. The reason for this can be significant economic changes as the financial and economic crisis, accession to the integration groupings and other [44, 45].
In case of the Slovak and Czech economies, a coincident composite indicator has not been the preferred tracking option in the past [30]. The length of time series of economic indicators was too short and it was not possible to determine which variables define the economic cycle, and which ones are only random fluctuations [46]. Length of each cyclical indicator already enables the creation of a coincident
composite indicator of sufficient quality even when using quarterly data. Tkáčová lists the groups of coincident cyclical indicators that have been selected from a set of 425 indicators monitored for the V4 countries. Table 1 shows the coincident indicators that in time period Q1 1993 – Q4 2011 were appropriate for compiling the composite concurrent indicators in these countries [31].
Table 1
Coincident cyclic indicators for the creation of CCI (1993-2011) Country Coincident cyclic indicators
Slovakia Unemployment rate by age group and gender in % Imports of goods and services, mill. EUR
Official foreign reserves, special drawing rights (SDR), EUR Industrial Production Index, 2005 = 100
Poland GDP creation, PLN
Current account balance of payments, bill. USD Construction works (new construction) 2005 = 100 Foreign currency reserves (securities), mill. PLN Czech
Republic
Import of goods, bill. USD Confidence in retail trade
Total foreign reserves (including gold), mill. CZK Input prices of materials used in construction (2005 = 100) Hungary Industrial Production Index, 2005 = 100
Total retail sales, 2005 = 100
Imports of goods and services, bill. HUF
Turnover in industry (intermediate and capital goods), total market, 2005 = 100 Bakarić et al. reported on the example of Croatia's approach to generating CCI for this post transitive economy, while analyzing 278 monthly time series, of which only four are entering into the final CCI. Their article applies a combination of Markov switching modeling, logit and dynamic factor modeling in order to measure the business cycle condition for a European post-transition country [47].
Business cycle analysis in Croatia focused either on constructing a non-model based CCI, as in case of Cerovac or on constructing a quarterly composite index [48, 49]. Cerovac identified CCI components using correlation coefficients, while the CCI itself was calculated using deterministic formula [48]. Wozniak and Lohmus and Demekas do construct a CCI for Poland and Estonia but they do so by applying unobserved component method and ordinary least squares (OLS) regression respectively [50, 51]. In recent years, dynamic factor models were used more intensively, in order to build short-term a CCI, used for the purpose of now casting. These applications include Arnoštová et al. and Rusnák who develop cyclical indicators for the Czech Republic, and Porshakov et al. who build CCI for Russia [15, 52, 53]. Dynamic factor model is also being more widely used for examining business cycle properties in developed countries (see for example [54- 58]).
3 Objective and Methods of Creation of Coincident Composite Indicator and Data
The aim of this paper is to propose a suitable coincident composite indicator for tracking Slovak economic cycle. These hypotheses are being tested:
Hypothesis 1: As the reference range/series for the calculation of the composite coincident indicator for Slovakia the cyclical component of GDP at constant prices should be used.
Hypothesis 2: The created coincident composite index for Slovakia reaches higher value of cross-correlation than coincident cyclical indicators included in it.
Hypothesis 3: There are changes in the composition of coincident composite indicator for Slovakia over time.
The methodology used in the creation of CCI used in this paper is a combination of OECD and Conference Board methodologies. Formulation of a CCI is based on growing cycle that is more appropriate in the case of transition economies with higher rate of growth [59]. For proper design of CCI these steps need to be followed:
1. Choice of the reference series – it is a basic indicator that represents the economic cycle (cyclical component of GDP or IPI).
2. Creation of economic indicators database – The paper studied 134 indicators from various economic sectors such as industry, construction, trade, services, labor market, state budget, balance of payments, foreign trade, prices retailers and consumers, monetary aggregates, and stock indices. In addition to quantitative data, cyclical behavior, in the case of qualitative data, such as the consumer confidence indicator, or an indicator of consumer confidence in the retail, services, construction and industry was also observed. Preference is given to the quarterly data. If monthly data would be used, only 76 indicators would be valid, which would not represent the whole country. Data were obtained from OECD, Eurostat, Slovak Statistical Office and National Bank of Slovakia. Time period Q1 1997 – Q4 2015 was the subject of interest.
3. Seasonal adjustment of time series (seasonal indices) – seasonal indices enable us to adjust time series and gain a cyclical component from original data.
4. Trend elimination (Hodrick-Prescott filter) – Beneš and N´Diaye considered the HP filter to be the simplest variant of advanced filtering techniques [60]. It can be quite easily applied to any time series [61]. In addition, it is only necessary to specify the input parameter λ, which optimizes the smoothing trend [62]. Smoothing parameter cannot be accurately determined or calculated, it can be only estimated on the basis of
empirical observations; λ = 14400 for monthly data, λ = 1600 for quarterly data, λ = 100 if time series consists of annual data [63]. One of the reasons for the choice of the HP filter is that is eliminates trend component in one operation and it smoothes the whole time series in the same step [64, 65].
5. Cross-correlation – allows us to express relationship between a referential series and time series of cyclical indicators that we observe. Cross- correlations are carried out with five-period forward and backward looking shift. Linear relationship between variables is expressed via Pearson correlation coefficient [66]. If a time series is not linear, its linearization can be realized through variable transformation (e.g. logarithmical operations) [67]. Consequently, new correlation can be calculated.
6. Creation of coincident cyclical indicators group – according to the value of correlation coefficient we can create group of cyclical indicators. For coincident indicators the highest absolute value of correlation coefficient is in time t and the second highest absolute value of correlation coefficient has to be at least 0.55.
7. Selection and scoring methodology – data selection and scoring methodology are important for choice of convenient leading indicators involved in the CLI. We evaluate their economic and statistical significance, as well as statistical quality [32].
8. Data normalization (standardization) – normalization of data enables us to use data in different units. In our case, we will apply standardization of a time series.
9. Weight determination – to create a CCI we will application of the same weights.
10. The CCI formulation – the CCI will be based on the sum of indicators multiplied by their weights. The procedure is explained more precisely in the section on the CCI formulation.
4 Construction of the Coincident Composite Indicator for Slovakia
4.1 Choosing the Reference Series as a Representation of the Slovak Economic Cycle
To determine the relationship between GDP and industrial production index cyclical component of these indicators were extracted and cross-correlation for monthly and quarterly data was implemented. If data were monthly estimates of GDP according to OECD were used. Results can be seen in Table 2.
Table 2
The results of the cross-correlation between the cyclical component of GDP and the IPI for the period 1993-2015
t-5 t-4 t-3 t-2 t-1 T t+1 t+2 t+3 t+4 t+5
M 0.07 0.31 0.54 0.69 0.60 0.58 0.5 0.42 0.12 -0.2 -0.15 Q -0.06 0.09 0.34 0.52 0.68 0.61 0.43 0.16 -0.05 -0.29 -0.43 Note: M – monthly time series; Q – quarterly time series.
As Table 1 shows, there is a correlation between GDP and IPI as for the monthly and quarterly data. IPI, however, does not overlapping but advance of developments in the cyclical component of GDP demonstrating the highest cross- correlation value at time t-2 (advance two months) for monthly data and t-1 (advance 1Q) at a cross-correlation value of 0.68. IPI can be used as a reference range for the creation of coincident composite indicator for Slovakia. IPI would cause that the calculated CCI would have a character of a leading, not coincident composite indicator, which is not the aim of this article. Based on Table 2, we can accept Hypothesis 1, which says that as a reference range for calculation of composite concurrent indicator for Slovakia the cyclical component of GDP at constant prices should be used. A look on Figure 1 can be taken for an illustration, which shows the evolution of cyclical components of GDP and IPI in tracking quarterly time series from 1997 to 2015.
Figure 1
Development of cyclical component of GDP and IPI for Slovakia in 1997-2015
Figure 1 highlights the leading capabilities of IPI in comparison to GDP especially in the period before the crisis in 2008. A large number of signals are also apparent indicating a change in economic development, which is considered to be one of the drawbacks of the IPI for the monitoring of the economic cycle. For this reason -20 -15 -10 -5 0 5 10 15
-1000 -500 0 500 1000 1500 2000
Q1-1997 Q1-1998 Q1-1999 Q1-2000 Q1-2001 Q1-2002 Q1-2003 Q1-2004 Q1-2005 Q1-2006 Q1-2007 Q1-2008 Q1-2009 Q1-2010 Q1-2011 Q1-2012 Q1-2013 Q1-2014 Q1-2015
GDP IPI
there will be the cyclical component of GDP at constant prices chosen as a reference range for the calculation of CCI.
4.2 Composition of the Coincident Composite Indicator for Slovakia for the Period 1997-2015
Based on the chosen methodology 10 coincident cyclic indicators were selected.
They are listed in Table 3.
Table 3
Results of the cross-correlation in time "t" for coincident cyclical indicators calculated for the period Q1 1993 – Q4 2015
Coincident composite indicator The value of cross-
correlation at time
"t"
Exports of goods and services (bill. EUR) 0.6904
Export of services (bill. EUR) 0.6101
Employment in manufacturing 0.6812
The actual productivity of the employee 0.6805
Labor productivity (per hour) 0.5820
The number of hours worked in industry 0.6710
Turnover in industry, capital goods, domestic market 0.6210
Turnover in manufacturing, domestic market 0.6903
Turnover in industry, intermediates + capital products, domestic market 0.6925
Indicator of confidence in retail trade 0.5507
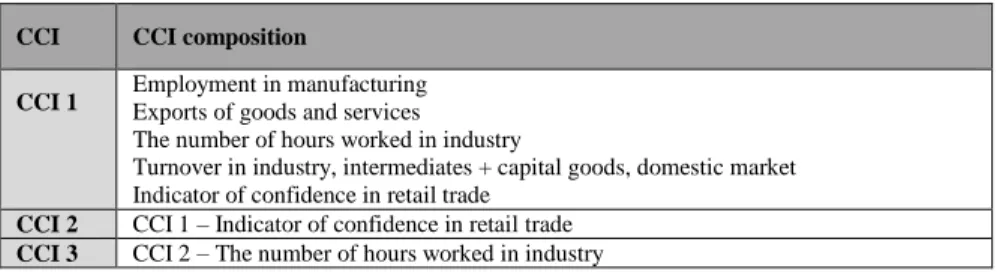
Indicators like turnover in industry or exports are found in Table 3 several times and would create duplication in the composition of the CCI. For selection of coincident indicators scoring method was used. 5 of 10 coincident indicators were selected by the use of this method. Due to the different units for the indicators, the method of normalization was applied. 5 of the selected indicators does not necessarily mean an optimal composition of CCI. Therefore, a CCI composed from 5, a CCI composed from 4 and a CCI composed from 3 indicators are created. The indicator with the lowest value of cross-correlation is still taken out.
Table 4 shows the different composition of the CCI for the period Q1 1997 – Q4 2015.
Table 4
Alternatives to composition of the CCI for the period Q1 1997 – Q4 2015
CCI CCI composition
CCI 1 Employment in manufacturing Exports of goods and services
The number of hours worked in industry
Turnover in industry, intermediates + capital goods, domestic market Indicator of confidence in retail trade
CCI 2 CCI 1 – Indicator of confidence in retail trade CCI 3 CCI 2 – The number of hours worked in industry
In the case of CCI 1, all the 5 indicators are included. For CCI 2, the Indicator of confidence in retail trade is taken out, which had cross-correlation value of 0.5507 at time t. For CCI 3, The number of hours worked in industry is taken out, which had cross-correlation value of 0.6710. To build relationships to calculate the CCI the system of same weights was used. Subsequently, the created CCIs were correlated with cyclical component of GDP. The results of the cross-correlation can be seen in Table 5.
Table 5
Results of the cross-correlation between the CCI 1, CCI 2, CCI 3 and the cyclical component of GDP for the period Q1 1997 – Q4 2015
t-5 t-4 t-3 t-2 t-1 T t+1 t+2 t+3 t+4 t+5 CCI 1 0.07 0.20 0.35 0.53 0.72 0.82 0.66 0.42 0.20 -0.05 -0.36 CCI 2 -0.01 0.18 0.32 0.52 0.74 0.87 0.66 0.46 0.27 0.05 -0.27 CCI 3 0.03 0.18 0.32 0.53 0.73 0.85 0.67 0.47 0.26 0.02 -0.29 Source: own processing by authors
The highest value of cross-correlation (0.87) was demonstrated in the CCI 2, which confirmed one of the basic properties of the composite indicator. The resulting CCI has a significantly higher cross-correlation value. This is higher than the cross-correlation values of indicators, which are involved in it.
The resulting relation for the calculation of the CCI 2 has this form:
CCI (1997–2015) = ¼ * employment in manufacturing + ¼ * export of goods and services + ¼ * number of hours worked in industry + ¼ * turnover in industry (1) A look on Figure 2 can be taken for illustration. It depicts the development of the CCI 2 and the cyclical component of GDP in Q1 1997 – Q4 2015. From Figure 2 it is apparent that CCI 2 and GDP are coincident especially in period 1997-2009.
It can be seen that since 2010 there is a number of false signals about the state of Slovak economy in CCI 2. For this reason, it is necessary to verify the ability of CCI to monitor the Slovak economic cycle even in shorter periods of time.
Figure 2
Development of CCI 2 and the cyclical component of GDP in Q1 1997 – Q4 2015
4.3 Verification of Concurrence Capabilities of CCI and GDP for Slovakia over Time
Periods after 2009 when the CCI 2 is not sufficiently coinciding with the cyclical component of GDP are visible based on Figure 2. Therefore, the quality of concurrence of CCI 2 even in shorter time periods, such as, 2000-2015, 2005-2015 and 2010-2015 was verified. The results of cross-correlation of CCI 2 calculated for the period 1997-2015 and the cyclical component of GDP for the given periods are visible in Table 6.
Table 6
Results of the cross-correlation of CCI 2 in shorter time periods
t-5 t-4 t-3 t-2 t-1 t t+1 t+2 t+3 t+4 t+5
2000-2015 -0.01 0.18 0.32 0.52 0.74 0.87 0.66 0.46 0.27 0.05 -0.27 2005-2015 -0.0 0.16 0.30 0.52 0.76 0.89 0.66 0.45 0.25 0.02 -0.32 2010-2015 -0.37 -0.11 -0.01 0.10 0.33 0.54 0.62 0.63 0.50 0.31 -0.06
Source: Research by authors
Based on Table 6 it can be seen that in the period from 2000 to 2015 and from 2005 to 2015 the ability of concurrence with GDP has been maintained or improved. In the period 2010-2015, the highest cross-correlation value was obtained at time t+2 and accounted as a delay. This means that in the period 2010- 2015 the composition of CCI 2 does not suit and there cannot be confirmation or -2,5 -2 -1,5 -1 -0,5 0 0,5 1 1,5 2 2,5
-1000 -500 0 500 1000 1500 2000
Q1-1997 Q1-1998 Q1-1999 Q1-2000 Q1-2001 Q1-2002 Q1-2003 Q1-2004 Q1-2005 Q1-2006 Q1-2007 Q1-2008 Q1-2009 Q1-2010 Q1-2011 Q1-2012 Q1-2013 Q1-2014 Q1-2015
cyclical component of GDP (current price, 2010=100) CCI 2
denial of the cyclical development of the Slovak economy on that basis. One can even say that the predictive abilities of CCI 2 until the year 2010 should be better, than shown by the cross-correlation for the period 1997-2015. This assumption was further examined and increase of cross-correlation CCI 2 up to 0.8910 in time to the year 2010 was found, which is also visible on the Figure 2. It can be presumed that the significant economic changes after 2008, as the financial crisis and subsequent economic crisis have resulted into the fact, that the composition of CCI 2 calculated from the period 1997 to 2015 was not suitable. Table 6 also highlights another important methodological fact. When using long time series (1997-2015) for the calculation of CCI a significant skewing of results can happen. Cross-correlation value of 0.87 speaks about a relatively good ability of CCI to copy the economic cycle in Slovakia in the period 1997-2015. Graphical analysis, however, revealed a time period for which the composition of the CCI 2 was not suitable at all. This means that the length of the used time series of all the economic indicators required for the calculation of CCI has a significant impact on the actual composition and therefore on the properties of the CCI. It is therefore necessary to carry out the conversion of CCI after at least every five years or after significant economic changes such as the transformation of the economy, entrance to integration groupings, whether financial, economic or debt crisis, which could affect the cyclical development of the economy.
4.4 Composition of the Coincident Composite Indicator for Slovakia for the Period 2010-2015
CCI calculated from the period 1997-2015 is not suitable to the present needs of monitoring the cyclical development of the economy and especially after 2010.
For this reason, the new CCI was made for the period Q1 2010 – Q4 2015. The most suitable is the variant of CCI with four coincident indicators – the volume index of output in the construction industry, factors limiting production - insufficient demand, unemployment 25-74 and short-term interest rate. Again, the same system of weights was used. Cross-correlation value at time t for the period 2010-2015 was 0.859. This is a significant improvement in the properties of the coincident indicator over time. Different coincident cyclical indicators were extracted the same way that were consistent with the cyclical development of the economy in 2010-2015. CCI with this composition can more accurately confirm or refute the current position of the economy. The resulting relation for CCI 2010- 2015 has the following form:
CCI (2010–2015) = ¼ * volume index of production in construction industry + ¼
* factors limiting production – insufficient demand + ¼ * number of hours worked in industry + ¼ * unemployment of the age group 25-74 + short-term interest rate (2)
Improved ability of CCI to copy Slovak economic cycle is shown also in Figure 3.
Figure 3
Development of cyclical component of GDP and new CCI in the period 2010-2015 After the establishment of the new CCI we can also confirm Hypothesis 3, stating that there is an overtime change in the composition of coincident composite indicator for Slovakia.
Conclusions
This paper represents a platform for the creation of a Coincident Composite Indicator (CCI) for monitoring the cyclical development of the economy with the application for Slovakia. The methodology for creating the CCI is universally valid for application in any country using methods, such as, seasonally adjusted time series, HP filter, cross correlation and normalization of data. In this study, three main hypotheses were validated. By testing Hypothesis 1 it was shown that as the reference range for the formation of CCI for Slovakia the cyclical components of GDP at constant prices should be used. The Industrial Production Index (IPI) has been ranked among the leading cyclical indicators for Slovakia, which precludes its use as a reference range, to calculate the CCI. The resulting CCI for the period 1997-2015 consists of four indicators from various economic sectors and the resulting CCI performs better than partial coincident cyclical indicators, which were included. That confirmed Hypotheses 2. The newly created CCI was analyzed for its capability to monitor the Slovak economic cycle over time. It has been found that the CCI created after 2010 did not copy at all the cyclical development of the economy. New CLI 2010-2015 contained a completely different composition. That confirmed Hypotheses 3, concerning the composition change of CCI over time. In practice, it is necessary to test the ability of CCI to monitor the economic cycle in real time, resp. accede to the conversion of CCI after significant economic changes.
In this paper we have managed to construct a quality indicator, for the concurrent need, of the constant monitoring of the cyclical behavior of an Economy. On that basis, it is possible to confirm the current position of Slovak economic cycle. A new area of research for the monitoring of economic cycles should also provide a CCI consisting of monthly data. The condition, however, is to ensure a sufficient -4 -2 0 2 4 6
-200 -100 0 100 200
300 cyclical component of GDP (current price, 2010=100) new CCI
set of economic indicators, which cover the entire economy. An interesting area for further investigation is the creation of CCIs for the different economies of the EU. On this basis, it is possible to create a group of countries with a similar structure of business cycles.
References
[1] Wesley C. Mitchell: “Business Cycles: The Problem and Its Setting”, New York, NY: National Bureau of Economic Research. 1927
[2] Burns, A. F., Mitchell, W. C.: “Measuring Business Cycles”, Cambridge:
NBER, 1946
[3] Tuveri, J. P.: “National accounts Central and Eastern Europe”, [cit. 2010-9- 16]
from:http://search.oecd.org/officialdocuments/displaydocumentpdf/?cote=
OCDE/GD%2897%2939&docLanguage=En, 1997
[4] OECD. “The OECD-JRC Handbook on Practices for Developing Composite Indicators”. Paris: OECD Committee on Statistics, 7-8 June 2004, Paris
[5] Stock, J. H. and Watson, M. W.: “A probability model of the coincident indicators”, K. Lahiri, G. H. Moore (Eds.), Leading economic indicators:
New approaches and forecasting records, Cambridge University Press, Cambridge, UK: (1991) pp. 63-90, 1991
[6] Stock, J. H. and Watson, M. W.: A procedure for predicting recessions with leading indicators: econometric issues and recent experience. NBER working paper series, Vol. 4014, 1992
[7] Hamilton, J. D.: “Time series analysis”, Princeton University Press, Princeton, 1994
[8] Hamilton, J. D. and Perez-Quiros, G.: “What do the leading indicator lead?”, The Journal of Business, 59 (1) pp. 27-49, 1996
[9] Czesaný, S. and Jeřábková, Z.: “Kompozitní indikátory hospodářského cyklu české ekonomiky”, Statistika, No. 3, pp. 257-274, 2009 [cit. 2010-10- 17] panda.hyperlink.cz/cestapdf/pdf09c3/czesany.pdf
[10] Wong, S. Siew-Ling., Puah, Chin-Homg., Abu Mansor, S. and Chin-Hong Puah, Chin-Hong, Abu Mansor, S. and Liew, V. Khim-Sen: “Measuring Business Cycle fluctuations: an alternative precursor to economic crises”, [cit. 2010-10-17]
http://pubdocs.worldbank.org/en/532031478564255805/Malaysia- Measuring-Business-Cycle-Fluctuations.pdf
[11] Ozyildirim, A., Schaitkin, B. and Zarnowitz, V.: “Business Cycles in the Euro Area Defined with Coincident Economic Indicators and Predicted
with Leading Economic Indicators”, 5th Eurostat Colloquium on Modern Tools for Business Cycle Analysis, Luxembourg, 29 September – 1 October 2008; Access 5 January 2009
[12] Czesaný, S. and Jeřábková, Z.: “Metóda konstrukce kompozitních indikatorú hospodářského cyklu pro českou ekonomiku” Statistika, No. 1, pp. 21-31, 2009 [cit. 2010-10-21]
http://panda.hyperlink.cz/cestapdf/pdf09c1/czesany.pdf
[13] Everts, M. P.: “Measuring Business Cycles”, Berlin: Verlag im Internet GmbH, 2006
[14] Camacho, M., and Perez-Quiros, G. P.: “Introducing the euro-sting: Short- term indicator of euro area growth” Journal of Applied Econometrics, 25, pp. 663-694, 2010
[15] Rusnák, M.: “Nowcasting Czech GDP in real time”, Working Papers 2013/6, Czech National Bank, 2013
[16] Mitchell, J., Smith, R. J., Weale, M. R., Wright, S. and Salazar, E. L.: “An indicator of monthly GDP and an early estimate of quarterly GDP growth”, Economic Journal, 115, pp. F108-F129, 2005
[17] Faust, J., Rogers, J. H. and Wright, J. H.: “News and Noise in G-7 GDP Announcements”, Journal of Money, Credit and Banking, 37(3) pp. 403-19, 2005
[18] Garratt, A. and Vahey, S. P.: “UK Real-Time Macro Data Characteristics.”
Economic Journal, 116(509) pp. F119-F135, 2006
[19] Aruoba, S. B.: “Data Revisions Are Not Well Behaved,” Journal of Money, Credit and Banking, 40(2-3) pp. 319-340, 2008
[20] Croushore, D.: “Frontiers of Real-Time Data Analysis.” Journal of Economic Literature, 49(1) pp. 72-100, 2011
[21] Fernandez, A. Z., Koening, E. F. and Nikolsko-Rzhevskyy, A.: “A realtime historical database for the OECD,” Globalization and Monetary Policy Institute Working Paper 96, Federal Reserve Bank of Dallas, 2011
[22] Robertson, J. C. and Tallman, E. W.: “Data Vintages and Measuring Forecast Model Performance.” Federal Reserve Bank of Atlanta Economic Review, b:4-20, 1998
[23] Faust, J., Rogers, J. H. and Wright, J.: “Exchange rate forecasting: the errors we’ve really made,” Journal of International Economics, 60(1) pp.
35-59, 2003
[24] Orphanides, A. and Van Norden, S.: “The Unreliability of Output-Gap Estimates in Real Time.” The Review of Economics and Statistics, 84(4), pp. 569-583, 2002
[25] Stark, T. and Croushore, D.: “Forecasting with a real-time data set for macroeconomists.” Journal of Macroeconomics, 24(4) pp. 507-531, 2002 [26] Eurostat: “Industrial production (volume) index overview”,
http://ec.europa.eu/eurostat/statistics-
explained/index.php/Industrial_production_(volume)_index_overview, 2016
[27] OECD: “Main economic indicator: Composite leading indicators for countries”, [cit. 2013-3-2] Dostupné na internete:
http://stats.oecd.org/mei/default.asp?lang=e&subject=5, 2012
[28] Bascos-Deveza, T.: “Early warning system on the macroeconomy identification of business cycles in the Philippines”, http://www.bsp.gov.ph/downloads/publications/2006/bsr2006a_02.pdf, 2006
[29] Camacho, M., Dal Bianco, M. & Martínez-Martín, J.: Toward a more reliable picture of the economic activity: An application to Argentina.
Economic Letters Vol. 132(C), pp. 129-132, 2015
[30] Czesaný, S., Macháčková, L. and Sedláček, P.: “Monitorování a analýza hospodárského cyklu”, Praha: Český statistický úrad, 2007
[31] Tkacova, A., Sinicakova, M. and Kralik. A.: “Industrial indicators and their influence on the V4 contries business cycles”, Actual probles of economics, 2(164), 2015
[32] Kľúčik, M.: “Composite Reference Series and Composite Leading
Indicator for Slovakia” [cit. 2013-3-3]
http://www.isae.it/MFC/2009/klucik.pdf, 2009
[33] OECD (2008) Handbook on Constructing Composite Indicators:
Methodology and User Guide, OECD Publishing, 2008
[34] Nardo, M., Saisana, M.: “Handbook on Constructing Composite Indicators:
Methodology and User Guide. OECD Statistics Working Papers 3/2005, Paris: OECD, 2005 [cit. 2013-3-3]
<http://www.olis.oecd.org/olis/2005doc.nsf/LinkTo/NT00002E4E/$FILE/J T00188147, 2005
[35] Czesaný, S.: “Hospodářsky cyklus”, Praha: Linde, 2006
[36] Giannone, D., Reichlin, L. and Small, D.: “Nowcasting: The real time informational content of macroeconomic data. Journal of Monetary Economics, 55, pp. 665-676, 2008
[37] Camacho, M., Martinez-Martin, J.: “Monitoring the World Business Cycle.
Federal Reserve Bank of Dallas Globalization and Monetary Policy Institute”, Working Paper No. 228
http://www.dallasfed.org/assets/documents/institute/wpapers/2015/0228.pd f, 2015
[38] Moylan, C. E.: “Cyclical Indicators for the United States. Third International Seminar on Early Warning and Business Cycle Indicators”, Moscow, Russian Federation November 17-19, 2010, https://www.bea.gov/papers/pdf/US_Cyclical_Indicators_Moscow.pdf, 2010
[39] Conference Board: “Business Cycle Indicator Handbook - Economic Research”, [cit. 2011-10-3] http://www.conference- board.org/pdf_free/economics/bci/BCI-Handbook.pdf, 2001
[40] Stone, Ch.: “Composite Index of Coincident Indicators”. New York: The Conference Board, February, 2017 [cit. 2013-3-3]
http://www.investopedia.com/university/conferenceboard/conferenceboard 3.asp#ixzz4Y5GmGMHn
[41] Marcellino, M.: “Leading indicators”,: in: G. Elliott, C. W. J. Granger, A.
Timmermann (Eds.), Handbook of Economic Forecasting, Vol. 1, Elsevier, pp. 879-960, 2006
[42] Mc Gunckin, R. H., Ozyildirim A., and Yarnowitz, V.: “Making the Composite Index of Leading Economic Indicators More Timely”, Business Cycle Indicators Handbook. Conference Board, New York, 2001
[43] Carriero, A.; Marcellino, M.: “A Comparison of Methods for the Construction of Composite Coincident and Leading Indexes for the UK”.
International Journal of Forecasting, 23, pp. 219-236, 2007
[44] Bartóková, Ľ. and Gontkovičová, B. “Labour Markets of EMU Countries in the Context of OCA”. Procedia Economics and Finance: Emerging Markets Queries in Finance and Business, 15, pp. 146-153, 2014
[45] Simionescu M. “Competitiveness and Economic Growth in Romanian Regions”, Journal of Competitiveness, 5(4), pp. 46-60, 2016
[46] Kaplanova, P. „Public Goods as Factors of a Local Economic Development in Slovakia”, Administration and Public Management, 26, pp. 6-24, 2016 [47] Rašić Bakarić, I., Tkalec, M. & Vizek, M.: “Constructing a composite
coincident indicator for a post-transition country”, Economic Research- Ekonomska Istraživanja, 29, No. 1, pp. 434-445, 2016
[48] Cerovac, S.: “Novi kompozitni pokazatelji za hrvatsko gospodarstvo: prilog razvoju domaćeg sustava cikličkih pokazatelja” [New Composite Indicators for the Croatian Economy: A Contribution to the Development of the National System of Cyclical Indicators] Istraživanja HNB, 1(16) pp. 1-32, 2005
[49] Krznar, I.: “Identifikacija razdoblja recesija i ekspanzija u Hrvatskoj”
(Identifying Recessions and Expansions in Croatia). Istraživanja HNB, 1(32), 1-17, 2011
[50] Wozniak, R.: “The coincident and leading business cycle indicator for Poland”, University of Warsaw Faculty of Economic Sciences Working Paper, 1, 2011
[51] Lo Lohmus, U., and Demekas, D.: “An index of coincident economic indicators for Estonia”, Review of Economics in Transition, 6, 77-88, 1998 [52] Arnoštová, K., Havrlant, D., Růžička, L., and Luboš, T. P.: “Short-term
forecasting of Czech quarterly GDP using monthly indicators. Finance a Uver, 61, pp. 566-583, 2011
[53] Porshakov, A., Deryugina, E., Ponomarenko, A., and Sinyakov, A.:
“Nowcasting and short-term forecasting of Russian GDP with a dynamic factor model”, BOFIT Discussion papers, 19/2015
[54] Matheson, T.: “New indicators for tracking growth in real time”, OECD Journal: Journal of Business Cycle Measurement and Analysis, 2, pp. 51- 71, 2014
[55] Antipa, P., Barhoumi, K., Brunhes Lesage, V., and Darné, O.: “Nowcasting German GDP: A comparison of bridge and factor models”, Working papers 401, Banque de France, 2012
[56] Tendera-Właszczuk, H., Szymański, M.:”Implementation of the Welfare State in the Visegrád Countries”, Economics and Sociology, Vol. 8, No. 2, pp. 126-142, 2015
[57] Błażejowski, M., Gazda, J., Kwiatkowski, J.: “Bayesian Model Averaging in the Studies on Economic Growth in the EU Regions – Application of the gretl BMA package”, Economics and Sociology, Vol. 9, No. 4, pp. 168- 175, 2016
[58] Simionescu M., Dobeš K., Brezina I., Gaal A.: “GDP rate in the European Union: simulations based on panel data models”, Journal of International Studies, Vol. 9, No. 3, pp. 191-202, 2016
[59] Czesaný, S.: “Kompozitní indikátory hospodářskeho cyklu české ekonomiky”, Statistika. 2009, No. 3, pp. 256-274, 2009
[60] Beneš, J. and N´ Diaye, P.: “A Multivariate Filter for for Measuring Potencial Output and the NAIRU: Application to the Czeck Republic”.
[Working Paper No. 04/45]. IMF, 2004
http://www.imf.org/external/pubs/ft/wp/2004/wp0445.pdf, 2004
[61] Hodrick, R. and Prescott, E.: “Postwar U.S. Business Cycles: An Empirical Investigation”. Journal of Money, Credit and Banking, 29(1), pp. 1-16, 1997
[62] Fabiani, S. and Mestre, R.: “Alternative Measures of the NAIRU in the Euro area: Estimates and assesment” [Working Paper No. 17] European Central Bank, 2000. http://www.ecb.int/pub/pdf/scpwps/ecbwp017.pdf, 2000
[63] Schilcht, E.: “Estimating the smoothing parameter in theso-called Hodrick- Prescott filter”, Journal of the Japanese Statistical Society. 35, pp. 99-119, 2005
[64] Triumbur, T. M.: “Detrending economic time series: a Bayesian generalization of the Hodrick-Prescott filter. Journal of Forecasting. 2006, Vol. 2005, No. 4, pp. 247-273, 2006
[65] Pigoń, A. and Ramsza, M. “Impact of a Modified HP Filter on Countercyclical Behavior of the Swiss Fiscal Rule”. Equilibrium, Quarterly Journal of Economics and Economic Policy, 11(4), pp. 661-674, 2016 [66] Marek, L. et al.: “Statistika pro ekonomy – aplikace”, Praha, Professional
Publishing, 2007
[67] Plachý, R. and Rašovec, T. “Impact of economic indicators on development of capital market”, E+M: Economics and Management. 18(3), pp. 101-112, 2015