Application of Evaluation Criteria to Cartographic Projections
Daniel Szatmári, Margita Vajsáblová, Denisa Mojšová
Slovak University of Technology in Bratislava Faculty of Civil Engineering
Radlinského 11, 810 05 Bratislava, Slovak Republic
daniel.szatmari@stuba.sk, margita.vajsablova@stuba.sk, xmojsova@stuba.sk
Abstract: The choice of the optimal cartographic projection, especially for large-scale maps, is an actual problem affected by the precision of positioning geodetic points using the new GNSS technologies in the coordinate systems. In this contribution we describe the map projections designed by minimax type criteria, Airy-Kavraiskii's variational criterion and map projections with a minimal RMS distortion in the category of conic, azimuthal and cylindrical projections. The aim of this paper is to compare the mentioned criteria based on the achieved values of scale distortion in the selected European countries.
Keywords: cartographic projection; conformal projection; scale distortion
1 Introduction
Design of the most suitable map projection, an actual problem affected by the precision of positioning geodetic points using the new GNSS technologies in coordinate systems, involves two classic options:
i. We choose a group of projections according to a purpose of the future map and calculate parameters of the projection according to distortion requirement (requirement of one standard parallel, requirement of two standard parallels, etc.),
ii. We calculate parameters of the ideal projection without any restrictions using minimax and variational criteria described in the following sections.
The aim of this paper is to present a combination of the above described options:
we calculate the parameters of the optimized map projection by minimization of the root mean square (RMS) distortion for the chosen group of projections of the reference ellipsoid because it has not been given attention for this issue – especially for the reference ellipsoid.
2 Cartographic Projections
Cartographic projections can be defined as a mathematical transformation of a surface of an ellipsoid (defined by its semimajor axis a and eccentricity e) or a sphere (defined by its radius R) onto a plane [4]. A point on the surface of an ellipsoid is referenced by its latitude φ and longitude λ or by isometric coordinates q, λ:
e
e q e
sin 1
sin 45 1
tan 2
ln
(1)The mathematical transformation between its ellipsoidical coordinates φ, λ and planar coordinates x, y is given by map equations:
, , 2
, .1 y f
f
x (2)
In case of conic and azimuthal projection, the polar coordinates ρ, ε are used. The map equations of these projections in general:
, , 2
, .1
g g (3)
A point on the surface of a sphere is referenced by its latitude U and longitude V or by isometric coordinates Q, V:
45
tan 2
ln U
Q
(4)Different projections cause different types of distortions. The scale distortion of a projection is characterized by the scale distortion factor m defined as the ratio of a differentially small distance, dS, on a mapping plane and the corresponding differential element ds on the reference surface. The angular distortion Δω of a projection is defined as the difference of an angle ω’ measured on the mapping plane and the corresponding angle ω on the reference surface. The distortion of the area of a projection is characterized by the area distortion factor marea defined as the ratio of a differential area element dP on the mapping plane and the corresponding differential area element dp on the reference surface. Conformal projections (projections with zero angular distortion) are the most frequently applied map projections in geodetic coordinate systems. The map equations for isometric coordinates in a conformal projection have to satisfy the following conditions:
q i , x iy f q i . f
iy
x
(5)Cartographic projections can be evaluated (with respect to extremal and minimax criteria) by the maximal value of the scale distortion |m – 1|max or using the RMS
value of scale distortion throughout the territory according to Airy’s, Jordan’s and Kavraiskii’s variational criteria [1], [5], [9]. The most popularized variational criterion for the valuation of map projections is Airy-Kavraiskii’s criterion, where the characteristic value of the cartographic projection of the domain Δ with area pΔ
on reference surface is:
1 ln2 d .
2 m p
I p (6)
The characteristic value of the cartographic projection for the n chosen points is:
n
i
mi
I n
1 2
2 1 ln .
(7) A minimax or variational projection can be derived for the reference sphere using the following procedure described in [13]. In conformal projections it holds:
ln 0 ln
2 2 2
2
V Q
(8)
where . cosU
m
(9)
The solution of (8) has the shape [6], [7]:
n
j
j j j
j b
a
0
ln (10)
where aj and bj are the coefficients of the conformal projection and ψj and τj are determined by:
j.j
ji QiV
(11)
After the separation of the real and imaginary components of the complex variables (if n = 4), we obtain for the scale distortion factor [8]:
4 6 4
lncos . 2 33 ln
3 3
4
3 2 3 2 1 4 2 2 4 4
2 3 3 2 2 2 1 0
U QV
V Q b
V V Q b QV b V b V V Q Q a
QV Q a V Q a Q a a m
(12)
2.1 Minimax Type Projections
Minimax projections [2], where:
1
1 min
max m
m (13)
can be derived by two consecutive steps:
1) need to minimize the natural logarithm of the scale distortion of the closed boundary points:
min ln
1
1 2
2
n
i
mi
I (14)
where the scale distortion factor is calculated by (12).
After minimizing the condition (14):
0 ,
0
2
2
j
j b
I a
I (15)
we get a system of nine equations in nine variables, and the coefficients a0-b4 of the projection can be calculated.
2) If the natural logarithm of the scale distortion factor of the boundary points is equal to zero, the extremal values of the projection´s scale distortion will be in the middle of the projected area. This can be reduced by the scale factor ms = 2/(mmax + mmin).
2.2 Variational Type Projections
A variational type of projection can be derived after the application of Airy- Kavraiskii’s criterion (7) and minimizing the natural logarithm of the scale distortion for n2 points inside the given area where the scale distortion factor is calculated by (12).
After minimizing the condition (7):
0 ,
0
2 2
j
j b
I a
I (16)
we get a system of nine equations in nine variables, and the coefficients a0-b4 of the projection can be calculated.
The main disadvantage of minimax and variational projections is the lack of geometric interpretation. However the process of deriving of these projections is applied for the reference sphere. Before the calculus we have to transform the ellipsoidical coordinates φ, λ on the spherical coordinates U, V by Gauss’
conformal projection:
V
e k e
U e
sin , 1
sin 45 1
tan 2 2 45
tan (17)
with the parameters α and k calculated for the central parallel of the given territory. The radius of the sphere is determined so that the reference sphere and the reference ellipsoid have the same Gaussian curvature [10].
3 Methods of Distortion Optimization in Conformal Cartographic Projections on Developable Surfaces
In 1933 Kavraiskii formulated the method of calculation of the parameters for conformal conic projection of the reference sphere [3] with minimal RMS value of distortion – the scale distortion between two parallels was minimized by Airy’s criterion (the procedure was also published in the Baltic Geodetic Commission Report in 1936). This method for the reference sphere, is inadequate, therefore, we formulate this process especially for the reference ellipsoid for conformal conic, conformal azimuthal and conformal cylindrical projections with the requirement of minimal RMS value of scale distortion in the projected area.
3.1 Conformal Conic Projection of the Reference Ellipsoid with Minimal RMS Value of Scale Distortion
A conformal conic projection was first introduced by Johannes Heinrich Lambert (1728-1777). Conic projections are appropriate for oblong territories along geographic parallels.
The map equations of Lambert’s conformal conic projection are:
n
e e
e e
n e
,
) sin 1 )(
sin 1 (
) sin 1 )(
sin 1 ( 2 45
tan 2 45 tan
0 0 0
0 (18)
where 0 is the ellipsoidal latitude of the standard parallel and 0 is its polar radius. The parameters 0, n and 0 are also the three constants of the conic projection affecting its accuracy.
The scale distortion m of a conformal conic projection is calculated by:
cos N
m n (19)
where N is a radius of curvature in the prime vertical:
. sin 1 e2 2 N a
(20)
The process of minimization of the RMS value of scale distortion throughout the territory is more effective using only two parameters, therefore we have defined the following substitution in [15]:
n e
e k e
0 0 0
0
1 sin
sin 45 1
tan 2
(21)then the conformal conic projection of the reference ellipsoid has only two constants n and k, then its map equations are:
n
e e
k
enn
,
sin 1
sin 1 2 45
tan
(22)
The scale distortion factor on the projected area is optimized according to Airy- Kavraiskii’s variational criterion (7) by minimizing the value of I. The projected territory is divided by ellipsoidal latitude to j segments pi with area pi, for i = 1, …, j:
p p p
m p I
j
i j i
i i j
i
i i
1 1
1 2
2
, where
ln
(23)
The scale distortion factor mi of the conformal conic projection of the ellipsoid for the determined area pi is evaluated after the substitution (22) in the equation (19):
n e
i i n i
i i
i
e
e N
k
m n
1 sin
sin 1 2 45
tan cos
(24)
where i is the ellipsoidal latitude of medial parallel of the ith band and Ni is its radius of curvature in the prime vertical.
Now, let us introduce a term hi = ln mi which can be expressed using (24):
) sin 1 2ln(
) sin 1 2ln(
2 45 tan ln
) cos ln(
) ln(
ln
i i
i
i i i
i
e e e e
n
N k n m h
(25)
and after the following substitutions:
) sin 1 2ln(
) sin 1 2ln(
2 45 tan ln
), cos ln(
), ln(
i i
i i
i i i
e e e e
N k
n b
(26)
we can evaluate the coefficients i and i for each of the bands and formulate j equations, whereby the equation for i th band of the projected territory is:
i i
i
n b
h
(27)The characteristic I , in (23) is a function of two variables n and b;
I 2 = f (n, b) after the substitution (26). We obtain the minimal value of I, if the partial derivative of this function is equal to zero:
0 ,
0
12 1
2
b h p n
h p
j
i i i j
i i i
(28) Therefore the normal equations are:
0 0
1 1
1
1 1
1 2
i j
i i j
i i j
i i i
i j
i i i j
i i i j
i i i
p p
b p n
p p
b p
n
(29)
The parameter n and the coefficient b are the solution of this system of equations.
The parameter k is evaluated from (26).
The ellipsoidal latitudes 1 and 2 of the preserved parallelscan be calculated for example by Newton’s method from the conditions for their scale distortion factor:
sin 1 1
sin 1 2 45
tan cos
sin 1
sin 1 1
sin 1 2 45
tan cos
sin 1
2 2 2
2
2 2 2 2
1 1 1
1
1 2 2 1
n e
n
n e
n
e e a
e k m n
e e a
e k m n
(30)
3.2 Conformal Azimuthal Projection of the Reference Ellipsoid with Minimal RMS Value of Scale Distortion
The author of the conformal azimuthal projection of the sphere (also known as stereographic projection) is Hipparchus. Azimuthal projections are appropriate for circle-shaped territories. In this chapter, we derive the formulas to calculate parameters of the conformal azimuthal projection of the reference ellipsoid with the requirement of minimal RMS value of scale distortion in the projected area.
The map equations for the conformal azimuthal projection of the ellipsoid are:
,
sin 1
sin 1 45 2
tan
e
e
c e
(31)where c is a constant of the azimuthal projection, its value affects the accuracy of projection.
The scale distortion of the conformal azimuthal projection is calculated by:
cos
m N
(32)We have realized the process of minimization of the RMS value of scale distortion throughout the territory by minimizing the value I of Airy-Kavraiskii’s variational criterion (7) after dividing the projected territory by ellipsoidal latitude to j segments pi.
We obtain the formula for the scale distortion factor mi of the conformal azimuthal projection of the ellipsoid for the determined area pi after substitution (31) in the equation (32):
e
i i i
i
i
e
e N
m c
1 sin
sin 1 45 2
cos
2
2(33)
where i is the ellipsoidal latitude of the medial parallel of the i th band and Ni is its radius of curvature in the prime vertical.
Now, as before, we can express hi = ln mi from (33):
) sin 1 2ln(
) sin 1 2ln(
45 2 cos ln 2 ln 2 ln ln ln
i i
i i
i i
e e e e
N c
m h
(34)
and apply the following substitutions:
) sin 1 2ln(
) sin 1 2ln(
45 2 cos ln 2 ln 2 ln ,
ln
i i
i i
i
e e e e
N c
b
(35)
We can evaluate the coefficients i for each of the bands and formulate j equations, whereby the equation for i th band of the projected territory is:
i
i
b
h
(36)The characteristic I is a function of parameter b; I 2 = f (b). We obtain the minimal value of I, if the partial derivative of this function is equal to zero:
1
0
2
b h p
j
i i i
(37) From there we obtain the normal equation:
0
1 1
ji i i j
i
i
p
p
b
(38)We can evaluate the coefficient b from (38), then the parameter c from (35).
The ellipsoidal latitude 0 of the preserved parallelcan be calculated for example by Newton’s method after substitution (20) instead of N0 into the condition for its scale distortion (33):
sin 1 1
sin 1 45 2
cos 2
sin 1
0 0 2 0
0 2 2
0
e
e e a
e m c
(39)3.3 Conformal Cylindrical Projection of the Reference Ellipsoid with Minimal RMS Value of Scale Distortion
A conformal cylindrical projection of a sphere designed by Mercator is one of the most common map projections. Cylindrical projections are appropriate for oblong territories along the equator or an orthodrome (e.g. geographic meridian). In this chapter, we derive the formulas to calculate parameters of the conformal cylindrical projection of the reference ellipsoid with the requirement of minimal RMS value of scale distortion in the projected area.
The map equations for the conformal cylindrical projection of the ellipsoid are:
y n
e n e
x
e
,
sin 1
sin 1 45 2
tan
ln
(40)where n is the constant of the cylindrical projection (geometric characteristic – radius of the cylinder), its value affects the accuracy of the projection.
The scale distortion of conformal cylindrical projection is calculated by:
cos N
m n
(41)We have realized the process of minimization of the RMS value of scale distortion factor throughout the territory, as before, by minimizing the value of I of Airy- Kavraiskii’s variational criterion (7) after dividing the projected territory by ellipsoidal latitude to j segments pi.
We express hi = ln mi from mi of conformal cylindrical projection of the ellipsoid for the determined area pi from equation (41):
i i
i
i
m n N
h ln ln ln ln cos
(42)where i is the ellipsoidal latitude of the medial parallel of the i th band and Ni is its radius of curvature in the prime vertical. After the following substitutions:
i i
i
N
n
b ln , ln ln cos
(43)we can evaluate the coefficients i for each of the area segments and formulate j equations, whereby equation for i th band of the projected territory is (36).
The characteristic I is a function of the parameter b; I 2 = f (b). Its minimal value is obtained, if the condition (37) is satisfied. Therefore we evaluate the coefficient b from the normal equation (38) and obtain the radius of the cylinder n from (43).
The ellipsoidal latitude 0 of the preserved parallelcan be calculated for example by Newton’s method after substitution (20) instead of N0 into equation (41), therefore the condition for its scale distortion is:
cos 1 sin 1
0 0 2 2
0
a
e
m n
(44)4 Applications of the Optimized Conformal Cartographic Projections
4.1 Conformal Projections of Slovakia
The problem of a new map projection in Slovakia is very real. The currently used cartographic projection in Slovakia is the Křovák’s projection, which was designed in 1922 solely for Czechoslovakia. It is an oblique case of a conformal conic projection based on two preserved parallels. Bessel’s reference ellipsoid is transformed into a sphere (17), which is transformed to a secant cone in oblique position. The scale distortion of the projection is from –10 to +11 cm/km, the RMS value of scale distortion in Slovakia according to Airy-Kavraiskii’s variational criterion (7) is 7.1 cm/km.
After the dissolution of the former Czechoslovak Republic the shape of Slovak country is not optimal for the mentioned Křovák’s projection anymore. This calls for a new design of cartographic projection based on the requirements of the Geodesy, Cartography and Cadaster Authority of Slovakia. In 2010 a new cartographic projection was proposed: Lambert’s conformal conic projection in normal position with scale distortion from –6.7 to +6.7 cm/km [14] and RMS value of scale distortion in Slovakia according to Airy-Kavraiskii’s variational criterion (7) equal to 5.0 cm/km.
The parameters of the aforementioned conic projections (Křovák, Lambert) 0 and n were calculated by criteria of scale distortion of selected parallels. Alternative method is to calculate the parameters of a conformal conic projection with the requirement of a minimal RMS value of scale distortion for the whole projected territory described in chapter 3.1.
Within the latter method Slovakia is projected onto the reference ellipsoid GRS80 between parallels with latitudes S = 47 43 09.6235 and N = 49 36 04.6826.
The parameters n and k of a conformal conic projection optimized by minimal RMS value of scale distortion after dividing the territory of Slovakia to 20 segments are:
n = 0.750 955 513 8 k = 11 642 467.97 m
Ellipsoidal latitudes 1 and 2 of the standard parallels calculated by (30) are:
1 = 48 07 45.6717
2 = 49 12 54.3553
Then the scale distortion of the projection is from –4.4 to +9.0 cm/km and the RMS value of scale distortion in Slovakia according to Airy-Kavraiskii’s variational criterion (7) is 3.4 cm/km.
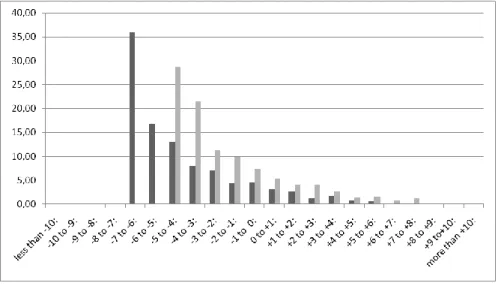
Figure 1 illustrates the percentage distribution of scale distortions of conformal conic projections in Slovakia. The dark bar represents Lambert’s conformal conic projection (for example, 45 % of the territory has scale distortion from –5 to +5 cm/km), the light bar represents the optimized conformal conic projection (96 % of the territory has scale distortion from the same interval, by comparison with Lambert’s projection, it is more than double). Although the maximal scale distortion of the optimized conic projection (+9.0 cm/km) is bigger than the maximal scale distortion of the non-optimized conic projection (+6.7 cm/km), this value is exceeded only on 1.4 % of the projected area. On the other side the optimized conic projection has smaller distortion over a larger area.
Figure 1
Percentage distribution of scale distortions of conformal conic projections in Slovakia
Table 1
Comparison of conformal projections of Slovakia
Cartographic projection Scale distortion [cm/km] RMS value of scale distortion [cm/km]
from to
Křovák –10.0 +11.0 7.1
Minimax –4.9 +4.9 2.6
Variational –2.6 +7.0 1.8
Conformal conic – Lambert –6.7 +6.7 5.0
Optimized conformal conic –4.4 +9.0 3.4
Minimax projection for the territory of Slovakia was designed in [12]. The scale distortion of the projection is from –4.9 cm/km to +4.9 cm/km. The RMS value of scale distortion in Slovakia according to Airy-Kavraiskii’s variational criterion (7) is 2.6 cm/km.
Variational projection for Slovakia was designed in [11]. The scale distortion of the projection is from –2.6 cm/km to +7.0 cm/km. The RMS value of scale distortion in Slovakia according to Airy-Kavraiskii’s variational criterion (7) is 1.8 cm/km.
The comparison of the aforementioned conformal projections of the territory of Slovakia is shown in Table 1.
4.2 Conformal Projections of the Netherlands
The currently used cartographic projection in the Netherlands is a conformal azimuthal projection in oblique position called Stereographic projection. Bessel’s reference ellipsoid is transformed into a sphere (17), which is transformed to a secant plane in oblique position. Ellipsoidal coordinates of the cartographic pole situated in a town of Amersfoort are:
= 52 09 22.178
λ = 5 23 15.500
The scale distortion of the projection is from –9 to +10 cm/km, the RMS value of scale distortion according to Airy-Kavraiskii’s variational criterion (7) is 5.6 cm/km.
The Netherlands are situated on the reference sphere between the cartographic parallel with latitude SS = 88 25 26.6818 and the cartographic pole S = 90. We have designed a conformal azimuthal projection optimized by minimal RMS value of scale distortion using the method derived in chapter 3.2. The parameter c of this projection after dividing the country’s territory to 20 segments is:
c = 12 734 816.084 m.
Spherical cartographic latitude S0 of a standard parallel calculated by (39) if e = 0:
1 45 2
cos
2 2 0
0
S
R
m c (45)
is S0 = 89 03 10.824. (Spherical cartographic latitude of the cartographic pole is S = 90.)
Then the scale distortion of the projection is from –6.8 to +12.1 cm/km and the RMS value of scale distortion of the optimized azimuthal projection according to Airy-Kavraiskii’s variational criterion (7) is 4.5 cm/km.
Figure 2 illustrates the percentage distribution of scale distortions of conformal azimuthal projections in the Netherlands. The dark bar represents the currently used conformal azimuthal projection (e.g. 73% of the territory has scale distortion from –7 to +7 cm/km), the light bar represents the optimized conformal azimuthal projection (e.g. 95% of the territory has scale distortion from the same interval).
Although the maximal scale distortion of the optimized azimuthal projection (+12.1 cm/km) is bigger than the maximal scale distortion of the non-optimized azimuthal projection (+10 cm/km), on the other side the optimized azimuthal projection designed by us in this chapter has smaller distortion over a larger area.
Figure 2
Percentage distribution of scale distortions of conformal azimuthal projections in the Netherlands
The scale distortion of the minimax projection (for the process of calculation see chapter 2.1) is from –5.1 cm/km to +5.1 cm/km. The RMS value of scale distortion according to Airy-Kavraiskii’s variational criterion (7) is 2.9 cm/km.
The scale distortion of the variational projection (for the process of calculation see chapter 2.2) is from –2.8 cm/km to +7.4 cm/km. The RMS value of scale distortion in the Netherlands according to Airy-Kavraiskii’s variational criterion (7) is 2.0 cm/km.
The comparison of the aforementioned conformal projections of the territory of the Netherlands is shown in Table 2.
Table 2
Comparison of conformal projections of the Netherlands
Cartographic projection Scale distortion [cm/km] RMS value of scale distortion [cm/km]
from to
Minimax –5.1 +5.1 2.9
Variational –2.8 +7.4 2.0
Conformal azimuthal –9.0 +10.0 5.6
Optimized conformal
azimuthal –6.8 +12.1 4.5
4.3 Conformal Projections of Hungary
For the Hungarian civilian base maps the Uniform National Projection system (EOV) is currently used which is a conformal cylindrical projection in oblique position. The GRS 1967 reference ellipsoid is transformed into a sphere (17), which is transformed to a secant cylinder in oblique position. The scale distortion of the projection is from –7 to +26 cm/km [16] and the RMS value of scale distortion according to Airy-Kavraiskii’s variational criterion (7) is 6.8 cm/km.
Hungary is situated on the reference sphere between cartographic parallels with latitudes SS = –1 23 47.6528 and SN = 1 27 46.2515. We have designed a conformal cylindrical projection optimized by minimal RMS value of scale distortion using the method derived in chapter 3.3. The parameter n of this projection after dividing the country’s territory to 20 segments is:
n = 6 379 314.331 m
Spherical cartographic latitude S0 of a preserved parallelcan be calculated by (44) if e = 0:
cos
01
0
S R
m n
(46)Then the scale distortion of the optimized projection is from –6.8 to +25.1 cm/km and the RMS value of scale distortion of the optimized cylindrical projection according to Airy-Kavraiskii’s variational criterion (15) is 6.7 cm/km.
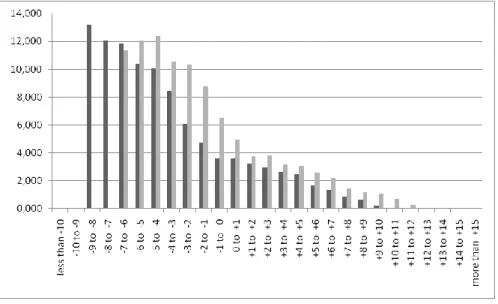
Figure 3 illustrates the percentage distribution of scale distortions of conformal cylindrical projections in Hungary. The dark bar represents the currently used conformal cylindrical projection (EOV), the light bar represents the optimized conformal cylindrical projection. The comparison showed that map projection used in Hungary (EOV) is the only currently used map projection with distortions nearby optimal.
The scale distortion of the minimax projection (for the process of calculation see chapter 2.1) is from –10.3 cm/km to +10.3 cm/km. The RMS value of scale distortion according to Airy-Kavraiskii’s variational criterion (7) is 5.4 cm/km.
The scale distortion of the variational projection (for the process of calculation see chapter 2.2) is from –6.2 cm/km to +16.5 cm/km. The RMS value of scale distortion in Hungary according to Airy-Kavraiskii’s variational criterion (7) is 4.1 cm/km.
The comparison of the aforementioned conformal projections of the territory of Hungary is shown in Table 3.
Figure 3
Percentage distribution of scale distortions of conformal cylindrical projections in Hungary
Table 3
Comparison of conformal projections of Hungary
Cartographic projection Scale distortion [cm/km] RMS value of scale distortion [cm/km]
from to
Minimax –10.3 +10.3 5.4
Variational –6.2 +16.5 4.1
Conformal cylindrical (EOV) –7.0 +26.0 6.8
Optimized conformal
cylindrical –6.8 +25.1 6.7
Conclusions
The final statement, which is the optimal map projection, significantly depends on the given criteria. In terms of extremal distortions the application of the most appropriate group of projections (conic, azimuthal, cylindrical) according the geometrical characteristics of the territory is suitable. A non-standard approach, that minimizes the RMS distortion throughout the territory, optimizes the distribution of distortions of the projected territory. These claims were confirmed by the results demonstrated in tables 1-3. Using the RMS minimization is a good alternative especially for conic, azimuthal and cylindrical projections because these projections are more understandable for cartographic practice and the projections with optimized RMS distortion have smaller distortions over a larger area.
Acknowledgement
This work was supported by the grant VEGA 1/0682/16.
References
[1] AIRY, G. B. Explanation of a projection by balance of errors for maps applying to a very large extent of the Earth’s surface and comparison with other projections. Philosophical Magazine and Journal of Science, Vol. 22, pp. 409-421, 1861
[2] CHEBYSHEV, P. L. Sur la construction des cartes géographiques. Oeuvres de P.L. Chebyshev. Chelsea, 1962
[3] FIALA, F. Mathematical Cartography. ČSAV, Praha, 1955
[4] GRAFAREND, W. E. – KRUMM W. F. Map Projections. Cartographic Information systems. Springer – Verlag Berlin Heidelberg. ISBN 978-36- 420-7178-2, 2006
[5] HOJOVEC, V. – ŠMEHIL, J. Criterion for the valuation of cartographic projections in terms of distortion. Geodetic and Cartographic Review, Vol. 14(56), No. 1, pp. 9-12 [in Czech] 1968
[6] HOJOVEC, V. – KLÁŠTERKA, J. – RENDLOVÁ, H. Using of the Chebyshev’s and variational criteria in conformal projections. Geodetic and Cartographic Review, Vol. 21(63), No. 1, pp. 3-6 [in Czech] 1975
[7] HOJOVEC, V. Application of optimization criteria in conformal projections. Geodetic and Cartographic Review, ISSN 0016-7096. Vol.
42/84, No. 7, pp. 133-138 [in Czech] 1996
[8] HOJOVEC, V. – BOŘÍK, M. – MIKUTA, V. – MINÁŘ, P. Results of optimization of the conform cartographic projection for the Czech Republic. Geodetic and Cartographic Review, ISSN 0016-7096. Vol.
43(85), No. 12, pp. 253-256 [in Czech] 1997
[9] KAVRAJSKIJ, V. V. Collected works 2. Moscow, 1959
[10] PRESSLEY, A. Elementary Differential Geometry. Springer – Verlag London, ISBN 1-85233-152-6, 2001
[11] SZATMÁRI, D. Optimization of the conformal cartographic projection. In:
Advances in Architectural, Civil and Environmental Engineering: 24th Annual PhD Student Conference. Bratislava, pp. 54-60. ISBN 978-80-227- 4301-3 [in Slovak] 2014
[12] SZATMÁRI, D. Optimization of conformal cartographic projections for the Slovak Republic according to Chebyshev’s theorem. Slovak Journal of Civil Engineering, ISSN 1210-3896, Vol. 23, No. 4, pp. 19-24, 2015 [13] URMAJEV, N. A. Methods for finding new cartographic projections.
Moscow, 1947
[14] VAJSÁBLOVÁ, M. Proposal of the New Cartographic Projection of the Slovak Republic Territory. Geodetic and Cartographic Review. ISSN 0016- 7096. Vol. 57 (99), No. 8, pp. 185-190 [in Slovak] 2011
[15] VAJSÁBLOVÁ, M. Aspects of the design of a cartographic projection for the territory of Slovakia. Edition of scientific works. Slovak University of Technology, Bratislava, ISBN 978-80-227-4393-8. [in Slovak] 2015 [16] www.geod.bme.hu/staff_h/varga/vetulet.html