VALIDATION AND EXAMINATION OF THE INDUSTRIAL APPLICABILITY OF A REDOX-POTENTIAL BASED RAPID MICROBIOLOGICAL TESTING
METHOD
DR. KATALIN NÁDASKI-SZAKMÁR
PhD THESES
Budapest 2009.
1. PRIOR ART AND SCIENTIFIC OBJECTS
The last decades’ significant increase in the tasks related to microbiological quality control set up a claim to replace the classical microbiological testing methods with much faster and automatable new techniques
In case of drinking-water examinations, especially important is the rapidness of the results, because microbiological contamination identified too late means serious sanitary risk. In the quality control of mineral water the late recognized microbiological contamination causes financial losses (the whole manufacturing batch may inevitably be destroyed).
With classical microbiological methods the time needed for detection of a microbe is at least 24 hours, but usually it is much longer: 48-72 (in special cases even 168) hours. The claim to the quicker assessment of food risks, the reduction of the time needed for temporary storage, the efficient operation of the HACCP systems necessarily require the hastening of the microbiological evaluation and automation as far as possible with simultaneous decrease of costs.
The need for rapid methods for determining the microbial content in the dairy industry has led to the introduction of dye reduction probes. The theoretical background of these methods is that the microbes as a consequence of their oxidative metabolism reduce the redox-potential of the environment and this effect could be simply indicated by redox indicators such as methylene-blue, rezazurin, TTC.
The possibility of the redox potential measurement has been known since the end of the 19th century, but for the enumeration of the viable microorganisms in the practice has been not used.
The new measuring system (MICROTESTER) developed by the workers of Szent István University, Faculty of Veterinary Science, Department of Food Hygiene and Corvinus University, Faculty of Food Science, Department of Physics and Automation is based on redox-potential measurement. As one of the developers of the new method I performed the microbiological research work needed for the development of the measuring system. In my dissertation I deal with the microbiological developing achievements and the validation of the new method for microbiological testing of water.
With the application of the MICROTESTER the enumeration of viable microbes becomes shortened comparing to the classical nutrient methods.
One of the most important advantage of the redox potential method that the time of the measuring is depend on the cell count of the sample so with increase of the sample volume (e.g. with membrane filtering) the time of the measuring decreases.
The objects of my works are as follows:
• Examination of the change of redox potential during the growth of microorganisms and the specification of the redox curves of the various microbes.
• Verification that the redox potential measuring is a suitable rapid method for the microbiological examination of foods and especially water.
• Validation of the redox potential method for the microbiological examination of drinking- and mineral water regarding to the next microorganisms:
o Total viable bacterial count with growth of 22 °C and 37 °C o Detection and enumeration of the Coliform bacteria
o Detection and enumeration of Escherichia coli o Detection and enumeration of Enterococcus
o Detection and enumeration of Pseudomonas aeruginosa
2. MATERIALS AND METHODS
2.1. Culture media
We used standard culture media. All of them were MERCK productions. To make dilution series we used salted peptone (1 g/l peptone and 8.5 g/l NaCl) pH =7.2±0.2.
2.2. Test microorganisms
The test microorganisms originated from the culture collections of the National Collection of Agricultural and Industrial Microorganisms. They were stored in lyophilised form and were cultivated in standard culture media.
2.3. Measuring of the redox potential
2.3.1. Redox potential measuring system
The apparatus and the software were made by the research fellow of the Corvinus University Department of Physics and Automation.
For the measurement of the redox-potential commercial combined redox electrodes are used. The modular system can be extended according to the measuring demands. The minimum channel number is 16, the maximum is 64 channels in one equipment, but they can be linked if needed, so even 256 channels can be achieved.
The system works with IBM compatible PCs with RS232C interface (COM port), or with USB port with convert-cable. The configuration of the PC from the point of view of hardware control is not critical.
For optimal control and data management, special software has been developed for MICROTESTER.
The data collection is continuous, all channels are monitored. The measured data are saved when it is required according to the channel settings.
The software has an advanced noise reduction for supporting measurements in electronically noisy environments.
The collected data are stored in tables, which can be easily loaded without conversion to statistical and spreadsheet managing software. The channels can be adjusted individually, making the monitoring and evaluation of different measurements (different type or started at different time) possible.
The threshold value for first derivative of data (required for TTD – time to detection – calculation), the number of positive identifications, where the threshold value is exceeded, start value of the evaluation and the critical number of microbes can be set in the channels configuration.
The start value adjusted can delay calculation of TTD. The given amount of time is skipped at the beginning; therefore the uncertainties of the beginning of the measurement can be eliminated. Substituting the measured time to detection to the previously determined calibration equation the original living cell concentration of the sample can be calculated.
Comparing the measured cell number to the critical number previously adjusted, decision between PASSED and FAILED results is made by the software.
The software possesses advanced graphical display with three different display options:
o Common chart: every active channel is presented on one common chart.
o Tile charts: every active channel is presented individually. The time to detection, the calculated cell number and the evaluation of the sample are presented for every single channel. At this type of layout the channels are marked with different bacground colours for better arrangement: with blue the running, with red the failed, with green the passed and with grey the finished measurements.
o Grouped curves: the grouped channels are presented on one graph (maximum of 4 groups can be set).
2.3.2. The method of measuring
The connection of the growth and the redox potential curves
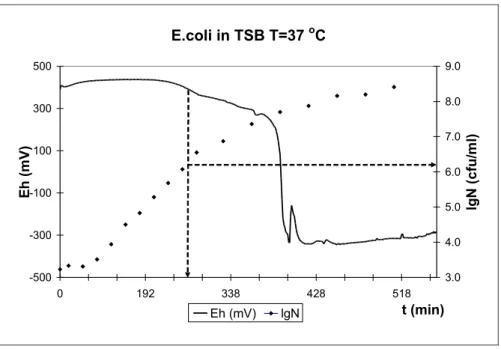
The principle of the measurement is that due to the energy producing biological oxidative processes of the multiplicating bacteria, the redox potential of the medium is well- detectably reduced at a certain microbe concentration. The detection time (TTD) is that moment when the absolute value of the rate of redox potential change in the measuring-cell overcomes a value which is significantly differing from the random changes (e.g. |dE/dt| ≥ 0.5 mV/min). This value is the detection criterion. As the critical rate of the redox potential decrease needs a determined cell count the detection time depends on the initial microbial count.
The growth and redox curves of Escherichia coli are shown in figure 1.
E.coli in TSB T=37 oC
-500 -300 -100 100 300 500
0 192 338 428 518
t (min)
Eh (mV)
3.0 4.0 5.0 6.0 7.0 8.0 9.0
lgN (cfu/ml)
Eh (mV) lgN
Figure 1. Growth and redox curves of Escherichia coli The arrows mark the TTD and the belonging lgN.
Determination of the calibration curve
At the determination of calibration curves, from the suspension of the test microorganism tenfold dilution series were prepared and the test flasks were inoculated with 1.0 ml of the
members of dilution series. In case of membrane filtering, the filters containing the microorganisms were put into the test flasks. The redox potential measurements were run at 37 °C temperature, according to the optimum of the microorganisms tested. The measuring system constructed the redox curve and determined the detection time. At the same time the number of living cells was counted by plate count method.
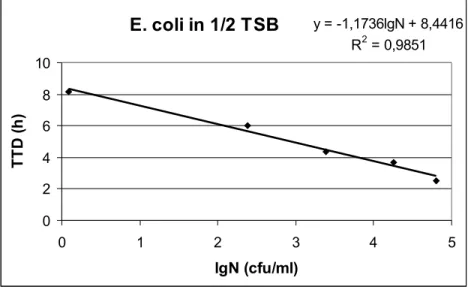
It can be proved that there is a close linear correlation between TTD and the logarithm (log N) of the initial viable count that is represented by the calibration curve. The microbe count can be calculated from the TTD value by the calibration curve.
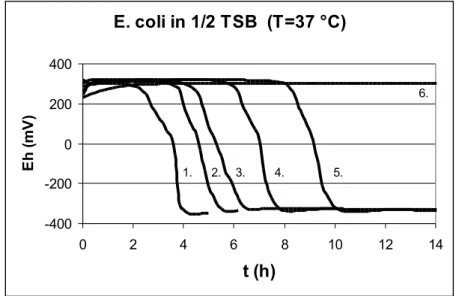
Figure 2. demonstrates the redox curves of Escherichia coli with different initial cell counts.
E. coli in 1/2 TSB (T=37 °C)
-400 -200 0 200 400
0 2 4 6 8 10 12 14
t (h)
Eh (mV)
1. 2. 3. 4. 5.
6.
Figure 2. Redox potential changing of Escherichia coli The initial cell counts marked by serial numbers
1: lgN=4.80; 2: lgN=4.25; 3: lgN=3.39; 4: lgN=2.38; 5: lgN=0.09; 6: sterile.
The equation of the calibration curve is calculated by linear regression from the log N (determined by classical cultivation) and the TTD (determined instrumentally). The calibration curve of Escherichia coli is demonstrated in the figure3.
E. coli in 1/2 TSB y = -1,1736lgN + 8,4416 R2 = 0,9851
0 2 4 6 8 10
0 1 2 3 4 5
lgN (cfu/ml)
TTD (h)
Figure 3. Calibration curve of Escherichia coli in 1/2 TSB (T=37 °C)
When we would like to use the MICROTESTER firstly we calculate the equation of the calibration curve of the current microbe in form of
TTD = a∙lgN + b
During the measurement the MICROTESTER determines the TTD values and calculates the lgN values by the next equation:
lgN = A∙TTD + B, where A = 1/a B = b/a
The sign of a and A are negative; unit of measurement depends on the TTD unit (minute or hour).
Determination the viable count of a sample
For determination of the original viable cell concentration of a sample – after conventional microbiological sample preparation (homogenizing, diluting) – a known amount is placed in the test cell and the measurement is carried out. As a negative control sterile medium, as a positive control a test cell inoculated with an approximately known concentration of the tested microbe is used. The redox curve is registered, the TTD is determined and with the calibration equation the original cell concentration is calculated by the equipment. With the knowledge of the cell concentration, if the critical number of microbes was set, the system makes a decision on the approval of the sample.
3. SUMMARY OF THE SCIENTIFIC RESULTS
3.1. Reasons for selection of the redox potential as the measuring parameter
The redox potential, according to the Nernst equation is not independent of the pH of the culture media. As a result of the multiplication the pH of the medium could be change as well, in order to come to a decision on the effect of pH on the redox potential, the two parameters of the growing populations were made simultaneously and the rH representing the combined effect was calculated. Evaluating the effect of the multiplication on the pH, Eh and rH of the medium the following conclusions could be drawn.
• In case of pH and rH the relative changing of both parameters during the growth were low, sometimes not significant, and not characteristic of the microorganisms.
• In case of Eh the relative changing during the growth were always significant, well measurable (150-800 mV) and characteristic of the microorganisms.
On the base of my experiments it could be established that the redox potential is a useful tool for detection of bacterial growth. In cases of microbes of food hygiene concern the TTD value is measurable. The range of the values of detection criteria (dE/dt) are between -0,4 and -1 mV/min and are characteristic of the microbial groups.
3.2. Relationship between the growth and redox potential
3.2.1. Effect of the selective nutrient on the shape of the redox curves
On the base of experiments I established that the shape of curves is independent of the selective nutrient.
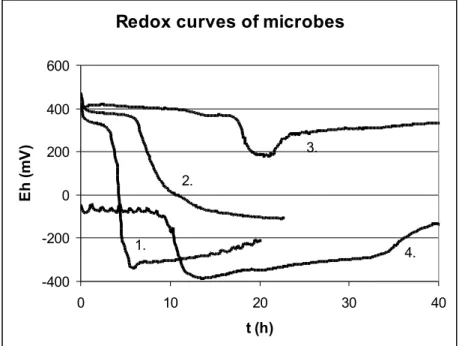
In all cases of our experiments the redox potential decreased during the bacterial growth, the measure of the rate and the range of decrease proved to be significantly different at the several bacterial groups.
The different shape of the curves makes it possible owing to the characteristic pattern of the redox curves; it opens possibility for identifying the composition of the microflora.
Some bacterial growth redox curves are demonstrated in figure 4.
Redox curves of microbes
-400 -200 0 200 400 600
0 10 20 30 40
t (h)
Eh (mV)
1. 4.
2.
3.
Figure 4. Redox curves of bacteria
1: E. coli; 2: Ps. aeruginosa; 3: L. plantarum; 4: Cl. perfringens
3.2.2. Fine structure of redox curves of some bacteria
We examined the fine structure of redox curves of microbes of food hygiene concern. The redox potential was measured in every two minutes. For the growth curves the bacterial count was determined by plate counting in every half hour.
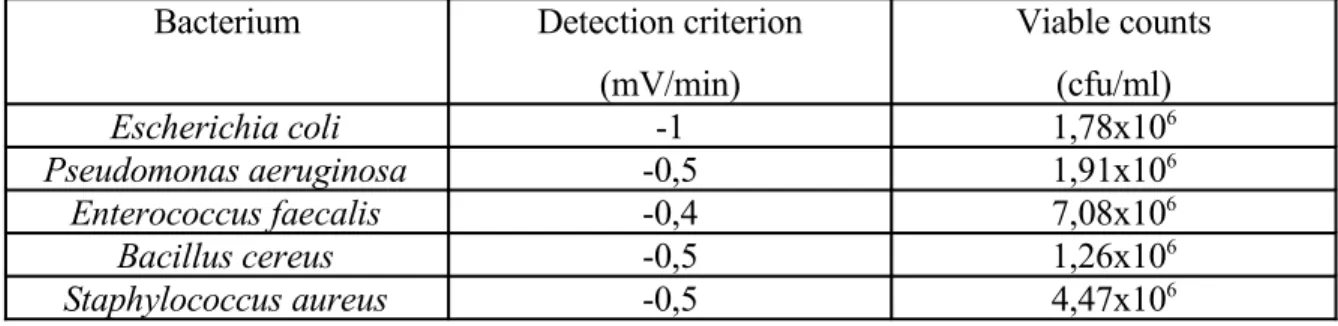
The determined bacterial counts belonging to the detection criteria are summarized in the table 1.
Table 1. Viable counts belonging to the detection criteria of some bacteria
Bacterium Detection criterion
(mV/min)
Viable counts (cfu/ml)
Escherichia coli -1 1,78x10⁶
Pseudomonas aeruginosa -0,5 1,91x10⁶
Enterococcus faecalis -0,4 7,08x10⁶
Bacillus cereus -0,5 1,26x10⁶
Staphylococcus aureus -0,5 4,47x10⁶
3.2.2. Measurement based on internal calibration curve
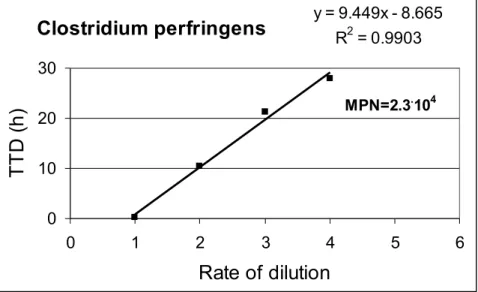
This method is applied when the composition of the microflora is not known and previously constructed calibration curve cannot be taken. In this case, the redox potential measurement is combined with the MPN method. From the sample the usual dilution range is prepared up dilution that already is without microbe. Each member of the dilution range is put into a measuring cell and the redox curves are constructed. Based on the last dilution levels still showing multiplication, the initial viable count is calculated using the MPN- table. The MPN can be calculated also at one parallel inoculation. In this case, the number of positive tubes belonging to the three sequential dilutions levels is 1.0.0, or 1.1.0 and the belonging MPN value is 2.3 or 23, respectively. Based on the obtained microbe count and TTD values, the internal calibration curve can be constructed.
As an example I show the internal calibration curve of Clostridium perfringens on the figure 5.
Clostridium perfringens
y = 9.449x - 8.665 R2 = 0.99030 10 20 30
0 1 2 3 4 5 6
Rate of dilution
T T D ( h )
MPN=2.3.104Figure 5. TTD values of Clostridium perfringens as a function of the dilution level
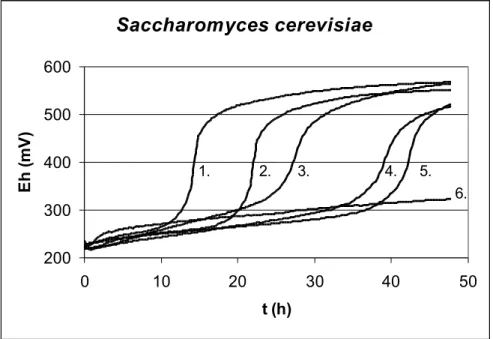
3.2.4. Enumeration of yeasts and moulds by indirect measuring
The change of redox potential during the growth of yeasts and moulds is too small to detect the growth. To solve this problem, indirect technique is used. With the indirect technique, microbial metabolism is monitored through CO2 production. The produced CO2 is absorbed by potassium hydroxide leading to an increased redox potential.
The detection criterion was T E/ t ≥ 0.2 mV/min. The figure 6. shows the redox potential curves of Saccharomyces cerevisiae.
Saccharomyces cerevisiae
200 300 400 500 600
0 10 20 30 40 50
t (h)
Eh (mV)
1. 2. 3. 4. 5.
6.
Figure 6. Indirect redox curves of Saccharomyces cerevisiae in malt broth (T=25 °C, KOH=0,002M)
1: lgN=4,1; 2: lgN=3,1; 3: lgN=2,1; 4: lgN=1,1; 5: lgN=0,1; 6: sterile.
3.3. Validation of the method
The typical validation characteristics, which should be considered, are as fallows:
selectivity, linearity, detection limit, quantitation limit, range, precision parameters and robustness. As the determination of living cell concentration is based on the calibration curves, sensitivity, detection limit, range and precision parameters were calculated from the mathematical-statistical parameters of the TTD = f(lg N) function.
3.3.1. Selectivity
For the selective enumeration of Coliforms, Enterococci, Pseudomonas aeruginosa BBL- broth, Azide-broth and Cetrimide-broth were used. At every experiment we added to the broth not only the target microbe but the most frequently disturbing microorganisms as
well. The results of the selectivity tests have showed that the usual disturbing flora of the classical nutrient methods did not disturb the typical redox-curve of the target microorganism, so there is a possibility of a selective detection of the target microbe without false positivity.
3.3.2. Linearity
The linear relationship between the logarithm of the cell concentration and TTD values is demonstrated by the calibration curves. From the concentrated suspensions of the test microorganisms tenfold dilution series were prepared in physiological salt solution. From the members of the dilution series the redox-potential test flasks were inoculated with 1.0 ml suspension and the TTD values were determined.
During the linearity tests a very strict linear correlation between the logarithm of the initial cell concentration (lgN) and the time needed to detection (TTD) was proven in a wide range (101-107 cfu/test cell).
3.3.3. Sensitivity
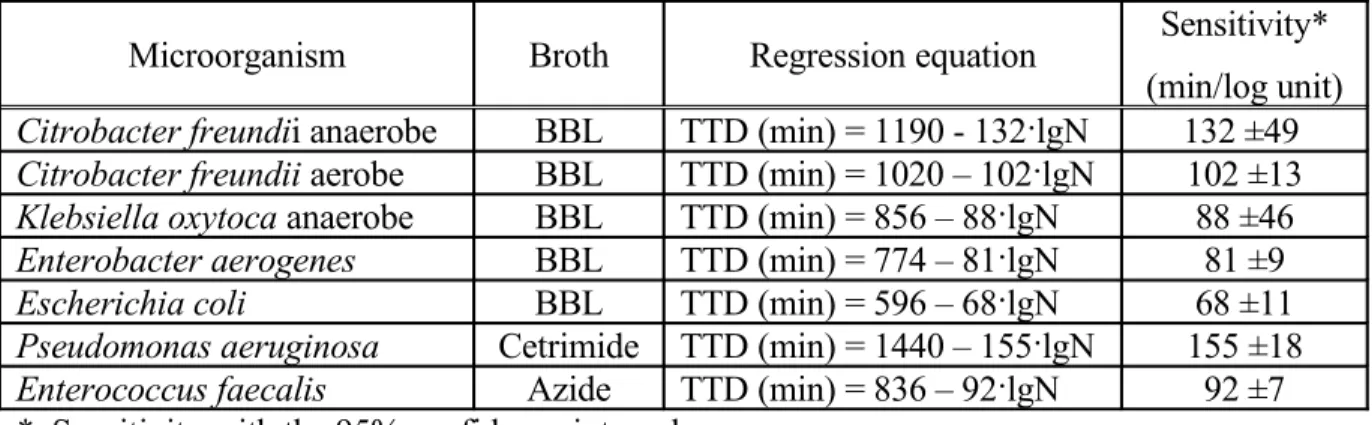
The sensitivity of the measuring method was determined as the slope of the calibration curves. Results are summarized in Table 2.
Table 2. Sensitivity of the redox-potential method
Microorganism Broth Regression equation Sensitivity*
(min/log unit) Citrobacter freundii anaerobe BBL TTD (min) = 1190 - 132·lgN 132 ±49 Citrobacter freundii aerobe BBL TTD (min) = 1020 – 102·lgN 102 ±13 Klebsiella oxytoca anaerobe BBL TTD (min) = 856 – 88·lgN 88 ±46 Enterobacter aerogenes BBL TTD (min) = 774 – 81·lgN 81 ±9
Escherichia coli BBL TTD (min) = 596 – 68·lgN 68 ±11
Pseudomonas aeruginosa Cetrimide TTD (min) = 1440 – 155·lgN 155 ±18 Enterococcus faecalis Azide TTD (min) = 836 – 92·lgN 92 ±7
* Sensitivity with the 95% confidence interval
From the table 2. it can be established that 1 logarithm unit increase in the initial cell concentration decreases the TTD values with 68-132 minutes, depending on the micro- organisms tested.
3.3.4. Detection limit
Detection limit means the lowest cell number in the sample which can be detected but not necessarily quantitated as an exact value.
From the intercept of the calibration curves the TTD values belonging to the lgN=0, which means 1 cell, can be obtained. These values lasted from 600 to 1200 minutes, depending on the microorganisms. As the sterile probes do not reduce the redox-potential, the TTD values always represent microbial growth. The detection limit is 1 cell/test flask. The method is suitable for absence/presence control of the microbes in the sample.
3.3.5. Quantitation limit
Quantitation limit means the lowest number of microorganisms in a sample which can be quantitatively determined with suitable precision and accuracy.
In case of low cell concentration the microorganisms are expected to have a Poisson distribution in the sample volume. Over a mean value of 10-15 the Poisson distribution could be approximate with a normal distribution and from these values the mathematical- statistical conditions meet with requirements. The theoretical quantitation limit is 10 cell/
inoculum (1 log unit), which is in agreement with the obtained calibration curves
3.3.6. Range of determination
The range of determination means the interval between the upper and lower cell concentration in the sample for which it has been demonstrated that the analytical procedure has a suitable level of precision, accuracy and linearity. On the base of the calibration curves this range lasted from 1 to 7 log unit. Below 10 cells the Poisson- distribution causes problems, over 107 cells the TTD is too short comparing to the transient processes (temperature-, redox-equilibrium, lag-period of the growth).
3.3.7. Accuracy/Trueness
Accuracy expresses the closeness of a result to a true value and is often termed trueness. As the redox-potential measuring method is based on the regression equation representing the connection between the logarithm of the real cell concentration and Detection Time, the
accuracy of the method depends on the reliability of the calibration curves. Each combination of microorganisms and culture broth require special calibration curve.
3.3.8. Precision
The precision expresses the closeness of agreement (degree of scatter) between a series of measurements obtained from multiple sampling of the same homogeneous sample under prescribed conditions.
Precision of an analytical method has two main characteristics: repeatability and reproducibility.
• Repeatability (random error) expresses the precision under the same operating conditions over a short interval of time. Repeatability aims to ensure that contributing factors to the variability of results, such as the operator, equipment, calibration and environmental considerations, remain constant and have a little or no contribution to the final results. Repeatability consists of 2 factors:
o Intra-laboratory assay: repeated analysis of an independently prepared sample on the same day by the same operator in the same laboratory.
o Intermediate precision: repeated of an independently prepared sample by different operators on different days in the same laboratory. The intra- laboratory assays of the test microorganisms resulted in well-fitting calibration curves with determination coefficients of higher than 0.995. The results are summarized in the table 3.
• Reproducibility expresses the precision between laboratories (collaborative studies).
For the evaluation of the redox measurements the original calibration curves were transformed into the following form:
lg N = a - b·TTD
As the measuring system determines the TTDs automatically from the time-course of the redox-potential values, the cell number of the samples could be calculated with the equation introduced above. Inputting the equation into the software, the equipment gives the cell count of the sample automatically.
The precision of the procedure depends on the uncertainty of the calibration curves, which could be determined from the mathematical-statistical analysis of the regression. The intra-laboratory assays of the test microorganisms resulted in well-fitting calibration curves with determination coefficients of higher than 0.995. The results are summarized in the table 3.
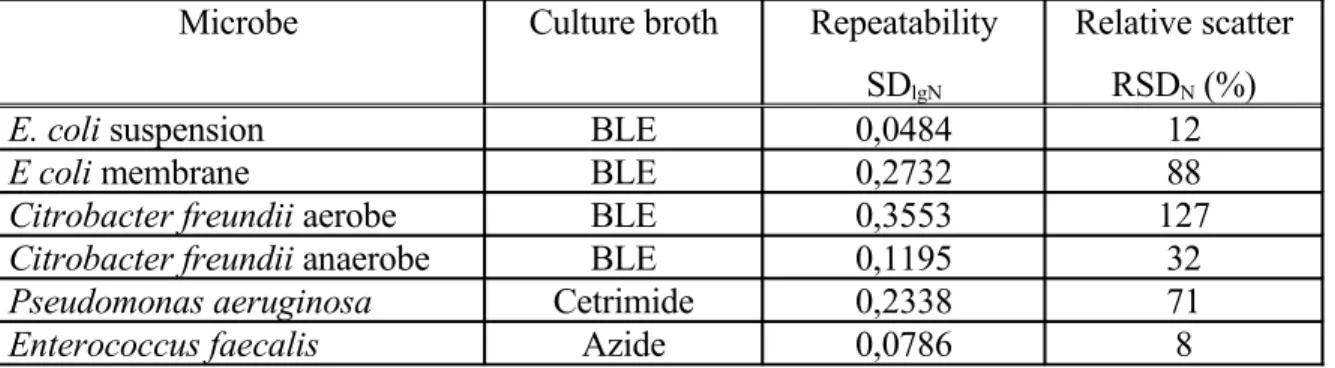
Table 3. Repeatability of the redox potential method in the case of single cultures
Microbe Culture broth Repeatability
SDlgN
Relative scatter RSDN (%)
E. coli suspension BLE 0,0484 12
E coli membrane BLE 0,2732 88
Citrobacter freundii aerobe BLE 0,3553 127
Citrobacter freundii anaerobe BLE 0,1195 32
Pseudomonas aeruginosa Cetrimide 0,2338 71
Enterococcus faecalis Azide 0,0786 8
The values summarized in table 3 have only informative meaning. The real values of the repeatability require the measurements with the characteristic microorganisms isolated from industrial samples.
Determination of random error with industrial investigations
Instrumental testing, aimed to determine the microbial contamination of water were performed in the Waste water Laboratory of Fejérvíz ZRt., Székesfehérvár. The viable counts of the same samples were determined by classical methods in the Drink water Laboratory of Fejérvíz ZRt., Székesfehérvár.
We calculated the calibration curves from the combined results of the Waste water Laboratory (TTD values) and Drink water Laboratory (lgN values).
Determination of random error of nutrient methods
In order to determine the distribution and relative standard deviation of colony forming units the Drink water Laboratory tested 50-50 parallel samples for Total count, E.
coli, Coliforms and Pseudomonas aeruginosa by membrane filtering and cultivating on standard nutrient broths.
Determination of random error of MicroTester methods
For the determinations several volumes of samples were filtered on membranes of 0.45 μm pore size in 3-3 parallels. We put the membranes into the test cells containing selective broth, recorded the redox-curves and constructed the calibration curves belonging to the microorganisms tested.
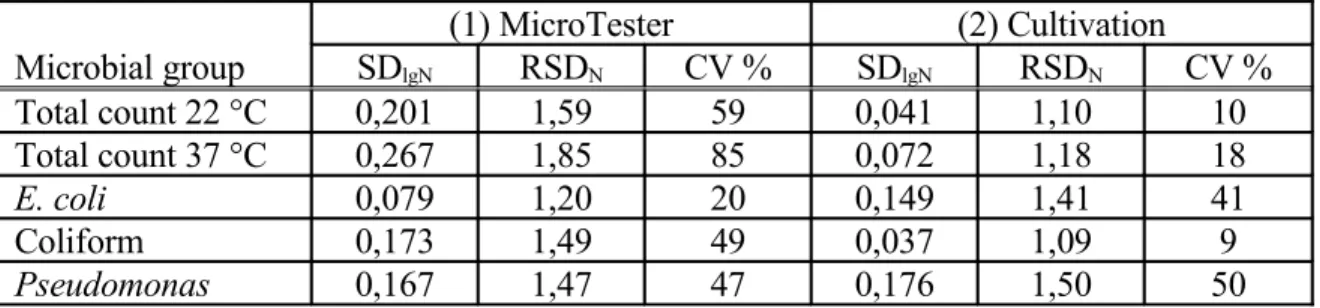
Comparison of the results of MicroTester and classical methods
The repeatability values (estimated by random errors) are summarized in table 4. In the table beside the relative standard deviations (RSD), in order to the mathematical- statistical probes in case of the classical nutrient procedures I have computed the SDlgN
values as well: SDlgN = lg RSDN.
The SDlgN values are independent of the range of cell-counts, so the paired t-test could be applied to judge the significance of the difference between the cell-counts obtained by the different methods.
Table 4. Repeatability of the cell counts determined by MicroTester and by classical culturing methods.
(1) MicroTester (2) Cultivation
Microbial group SDlgN RSDN CV % SDlgN RSDN CV %
Total count 22 °C 0,201 1,59 59 0,041 1,10 10
Total count 37 °C 0,267 1,85 85 0,072 1,18 18
E. coli 0,079 1,20 20 0,149 1,41 41
Coliform 0,173 1,49 49 0,037 1,09 9
Pseudomonas 0,167 1,47 47 0,176 1,50 50
Average difference between the methods: SDlgN(1) - SDlgN(2) = 0.0824
The difference means that the random error of the instrumental methods is higher than that of the classical method with an average of 21% (100.0824=1.21), but this difference according to the paired t-test is not significant at 95% level.
3.3.9. Robustness
The robustness of an analytical procedure is a measure of its capacity to remain unaffected by small, but deliberate variation in method parameters and provides an indication of its reliability during normal usage.
In case of the applied redox-potential based method the most important environmental parameter is the temperature, which has two effects on the results:
• The growth rate of the microorganisms is highly affected by the temperature.
• The measure value of redox-potential according to the Nernst equation is a function of the temperature.
Performing the measurements at the optimum temperature of the microbial growth, within a range of ±0.5 °C the growth rate does not change significantly. (In suboptimal range, off course, the growth rate is temperature-depending.)
The effect of the temperature on the redox-potential of the nutrient broths is summarized in table 5.
Table 5. Effect of the temperature on the redox-potential of the nutrient broths
Medium Temperature (°C) ΔE/ΔT (mV/°C)
Cetrimide broth 28 -45 -1.30
Azide broth 28 -45 -1.23
BLE broth 28 -45 -0.40
As the detection criterion in the usual intervals of 10 min is -10 mV/10 min, the effect of the temperature fluctuation of normal bacteriological thermostats (±0.5 °C) is negligible.
3.4. Drink water investigations
The microbial counts of water samples originated from several place were determined by MicroTester and classical culturing methods in the Waste water Laboratory of Fejérvíz ZRt., Székesfehérvár. The results are summarized in table 6.
Table 6. Microbial counts of drink water obtained by MicroTester and classical methods
(1) MicroTester (2) Cultivation
Microbial group Time * N lgN Time * N lgN
h cfu/100ml h cfu/100ml
Total count 22 °C 15 6,1∙103 3,79 72 2,0∙103 3,30
Total count 37 °C 11 1,0∙103 3,00 72 2,0∙103 3,30
E. coli 7 4,5∙101 1,65 24 4,5∙101 1,65
Coliform 9 4,9∙101 1,69 24 4,9∙101 1,69
Enterococcus 1 12 9,0∙102 2,95 48 4,0∙102 2,60
Enterococcus 2. 11 2,5∙103 3,40 48 5,9∙103 3,77
Enterococcus 3. 12 1,1∙103 3,04 48 2,0∙103 3,30
* Time means the time requirement of the determination.
The significance of the difference of microbial counts obtained by the two methods was investigated by paired t-test. The average difference: lgN(1)-lgN(2)=0.014 means that the microbial count of the instrumental methods is higher than that of the classical method with
an average of 3% (100.014=1.03), but this difference according to the paired t-test is not significant at 95% level.
3.5. Mineral water investigations
The mineral water investigations were carried out at Plant Laboratories of Coca-Cola Beverages, in Tylicz (Poland) and Zalaszentgrót. The primer aim of the tests was the rapid detection of Coliforms, Escherichia coli, Pseudomonas aeruginosa and Enterococcus faecalis from the products. All of the microbes investigated are zero-tolerant (could not be present in the sample of 250 ml.)
The problem of the redox-potential based method in case of present/absent probes is the estimation of the time requirement needed to detect even one microorganism from the sample. The determination of the running time of the tests is based on the linearity of TTD=f (lgN) function. From the equation of the curves the intercept gives the minimal time requirement of detection the N = 1 cfu/test cell microbe concentration (TTD belonging to lgN=0).
The intercepts of TTD=f(lgN) functions of the bacteria tested and their 99% confidence intervals are summarized in table 7.
Table 7. Time requirement of present/absent tests with 99% confidence interval
Bacteria Intercept (tlgN0, h) 99% conf. interval (h)
Escherichia coli 10.0 9.72 -10.38
Citrobacter freundii 19.8 17.16 – 22.50
Pseudomonas aeruginosa 21.6 20.45 – 22.79
Enterococcus faecalis 13.5 12.98 – 14.07
3.5.1. Quality control tests in Tylicz (2005) 72 bottles tested for Coliform
Testing method of Laboratory
Membrane filtering of 3x250 ml mineral water with 1 filter. Cultivation Tergitol agar at 37 °C for 48 h. One Petri dish represents 3 bottles of mineral water.
Redox-potential measurement method
Membrane filtering of 3x250 ml mineral water with 1 filter, placing 4 membranes into 1 test flask containing BBL broth. Temperature: 37 °C. One test flask represents 12 bottles of mineral water.
Positive control: 1 ml of Citrobacter freundii suspension (logN = 3.66) All of the results were negative
66 bottles tested for Coliform Testing method of Laboratory
Membrane filtering of 3x250 ml mineral water with 1 filter. Cultivation Tergitol agar at 37 °C for 48 h. One Petri dish represents 3 bottles of mineral water.
Redox-potential measurement method
Membrane filtering of 3x250 ml mineral water with 1 filter, placing 3 membranes into 1 test flask containing BBL broth. Temperature: 37 °C. One test flask represents 9 bottles of mineral water.
Besides the mineral water two technological water samples were tested for Coliforms
Positive control: 1 ml of Escherichia coli suspension (logN = 6.66) All of the results were negative
3.5.2. Quality control tests in Zalaszentgrót (2008)
As a part of the quality control procedure the investigations were performed by the staff of the Microbiological Laboratory of Mineral water Plant of Coca-Cola Beverages, in Zalaszentgrót. The data summarized in table 8 represents the quality control results of a year. The content of 500 ml mineral water flasks was divided in two parts and membrane- filtered. One part was tested by MicroTester, the second one by classical methods for E.
coli, Coliforms, Pseudomonas aeruginosa and Enterococcus faecalis.
Table 8. MicroTester results in Zalaszentgrót (Hoffmanné and Tar-Géri, 2008.)
Microorganism Total number of
tests
Agreement with
classical method (%) False positive
(%) False negative (%)
Escherichia coli 942 99.89 0.11 0.00
Coliform 4674 99.87 0.00 0.13
Enterococcus 3000 99.93 0.00 0.07
Pseudomonas
aeruginosa 3372 99.82 0.06 0.12
3.6. New scientific result
As one of the developers of the new method I performed the microbiological research work needed for the development of the measuring system. In my dissertation I deal with the microbiological developing achievements and the validation of the new method for microbiological testing of water. During my work
- I determined the redox-potential curves characterizing the growing microorganisms of hygienic concern.
- I have established that in all cases of microorganisms tested from the redox curves detection criterion could be declared. On the base of detection criteria the presence of the microbes is detectable and the time to detection could be calculated.
- I have established a close linear relationship between the detection time and the logarithm of the initial viable cell concentration. This relationship serves as calibration curve to the application of the new measuring system for microbial testing. The calibration curves determined during my research work has been used in the industrial experiments and in the quality control application.
- Combining the redox-potential measurement with MPN-like evaluation I have established that the new method is suitable for the estimation of the most probable number of unknown microflora without any previously determined calibration curve.
(Coliform number and total count of treated waste water, Enterobacterial and total count of hygienic samples.)
- During the validation for microbial testing of water I determined the performance characteristics of the new method.
- I have verified the applicability of the new testing method with the results of measurements in mineral water plants and waterworks plant.
4. CONCLUSIONS
The new method and apparatus based on redox-potential measurement proved to be very effective tool for the rapid determination of the viable count of microorganisms. On the base of my research work the following conclusion could bee drawn
• During the bacterial growth the redox-potential of the medium in all cases, independently of the metabolism type (aerobe, facultative anaerobe, aerotolerant anaerobe, and obligate anaerobe) decreases. The reduction of the redox-potential with the MicroTester is well detectable.
• The shape of the redox-curve is characteristic of the microbial group and is not affected by the nutrient broth, the volume and shape of the testing cell, the adhesion of the microbe to the filter-membrane.
• The selectivity of the method depends on the selectivity of nutrient broths, and is a special advantage that the shape of the redox curve helps in the identification of the growing microorganism.
• For every microorganisms could be determined a detection criterion. The value of the detection criterion is typical of the microbial group.
• The detection time is in close linear correlation with the logarithm of the initial cell- count so calibration curve (lgN – TTD) could be determined for every microorganism. On the base of the calibration curve the initial viable cell concentration in the test cell could be calculated from TTD.
• As the detection time depends on the initial viable cell count a massive microbial contamination (e.g. contamination of drink water with waste water) is detectable very quickly (within some hours). The time requirement of the detection could be shortened by membrane filtering. Application of the new method is especially useful for detection of an unexpected rapid contamination of drink water system.
• The validation of the new method for water examination makes its using possible for the quality control of food products (e.g. raw and heat treated milk).
• In case of determination of zero-tolerant microorganisms the time requirement necessary to detect only 1 microorganism in the test cell is about 12 – 24 hours in
contrast to 48 hours of the classical cultivation methods. For the rapid detection of contaminating microorganisms the new method and equipment – on the base of high number industrial tests – proved to be suitable.
• The new, redox-potential based method is substantially quicker than the classical nutrient methods, and due to the shortened time requirement the results could be fed back in the technology (e.g. bottled mineral water production) which results in the reduction of the risk caused by the contaminated lots.
5. PUBLICATIONS
English publications in contributed periodicals
Reichart O., Nagy B., Jozwiak Á., Szakmár K. (2007): Rapid method for selective
enumeration of ’Bifidus essensis’ in Activia yogurts. Acta Alimentaria. 36. (2) 173-183.
Reichart O., Szakmár K., Jozwiak Á., Felföldi J., Baranyai L. (2007): Redox potential measurement as a rapid method for microbiological testing and its validation for coliform determination. International Journal of Food Microbiology 114, 143-148.
English reported Hungarian publications
Reichart O., Szakmár K. (1988): A redoxpotenciál hatása mikroorganizmusok hőpusztulására I. Élelmezési Ipar XLII. (5) 168-172.
Szakmár, K., Reichart O.,Vincze I. (1988): A redoxpotenciál hatása mikroorganizmusok hőpusztulására II. Penészgombák hőpusztulása a közeg rH-jának függvényében.
Élelmezési Ipar XLII. (8) 281-285.
Szakmár K., Reichart O., Balogh I. (1988): A redoxpotenciál hatása mikroorganizmusok hőpusztulására III. Élelmezési Ipar XLII. (11) 416-419.
Reichart O., Szakmár K. (1988): A redoxpotenciál hatása mikroorganizmusok
hőpusztulására IV. Baktériumok hőpusztulása a közeg rH-jának függvényében.
Élelmezési Ipar XLIII. (4) 142-146.
Szakmár K., Reichart O., Erdősi O., Fekete Z. (2009): Redox-potenciál mérésen alapuló gyorsmódszer nyerstej mikrobaszámának meghatározására. Magyar Állatorvosok Lapja 131. 365-372.
Hungarian publications
Szakmár, K., Reichart O. (1985): Az rH hatása néhány hőrezisztens penészgomba szaporodására. Konzerv és Paprikaipar 1. 15-17.
Abstracts of conference proceedings
Szakmár K., Reichart O. (2008.) Redoxpotenciál mérésen alapuló gyors mikrobiológiai módszer alkalmazása élelmiszeripari minták vizsgálatára. XVI. Élelmiszer Minőségellenőrzési Tudományos Konferencia. Április 24-25, 2008. Tihany.
290-298.
Reichart, O., Farkas, J., Szakmár, K., Beczner, J., Andrássy, É., Bata-Vidács I. (2007) Automatic monitoring the redox potential for growth/death modeling and data gathering on bacterial contamination with low cell numbers. Proceeding of 5th international conference predictive modelling in foods. September 16-19, 2007.
Athens-Greece. 393-396.
Jozwiak Á., Reichart, O., Szakmár K. (2005) Redox potential measurement as a rapid method for heat destruction experiments of Camppylobacter jejuni. (Abstract). 1st Central European Forum for Microbiology. October 26-28, 2005. Keszthely, Hungary. Acta Microbiologica et Immunologica Hungarica 52, 2005, Supplement.
p. 62-63.
Szakmár K., Reichart, O., Jozwiak Á. (2005) Microbiological inspection of mineral
water by redox-potential measurement. (Abstract). 1st Central European Forum for Microbiology. October 26-28, 2005. Keszthely, Hungary. Acta Microbiologica et Immunologica Hungarica 52, 2005, Supplement. p. 149-150.
Jozwiak Á., Reichart, O., Szakmár K. (2006) The effect of water activity on the
survival of Campylobacter jejuni. (Abstract). Annual Meeting of the Hungarian Society for Microbiology. October 18-20, 2006. Keszthely, Hungary. Acta Microbiologica et Immunologica Hungarica 53, 2006, Supplement. p. 282.
Szakmár K., Reichart, O., Jozwiak Á. (2006) Microbiological quality control of food industrial samples by redox-potential measurement. (Abstract). Annual Meeting of the Hungarian Society for Microbiology. October 18-20, 2006. Keszthely, Hungary.
Acta Microbiologica et Immunologica Hungarica 53, 2006, Supplement. p. 342.
Patent
Reichart O., Szakmár K., Felfödi L., Baranyai L., Jozwiák Á. (2005): Eljárás
mikroorganizmusok szilárd, folyékony és légnemű anyagokban való jelenlétének kimutatására és számszerű meghatározására.