Cost-Benefit Analysis of Different Photovoltaic Systems in Croatia, Hungary, Serbia and Slovenia
Denis Pelin1,*, Sándor Zsolt Kovács2, Andrea Suvák2, Damir Šljivac1, Danijel Topić1
Josip Juraj Strossmayer University, Faculty of Electrical Engineering Osijek, Osijek, Croatia
2 Institute for Regional Studies, CERS HAS , Pécs, Hungary
E-Mails: pelin@etfos.hr; skovacs@rkk.hu; suvak@rkk.hu; sljivac@etfos.hr; dtopic@etfos.hr
*Corresponding Author
Abstract: The aim of paper is evaluation of different categories and different solar cell technologies of photovoltaic systems. Therefore, two types of user categories are considered:
solar home system users (i.e. small scale system) and energy producer investors (i.e. large- scale system) as well as five modules technologies, more specifically: monocrystalline, polycrystalline, CIS, amorphous and high-efficiency monocrystalline. In order to perform cost- effectiveness calculations for four countries in Danube region (Croatia, Hungary, Serbia and Slovenia) the technical data and relevant prices were based on measurements, regulations as well as available web-database.
Keywords: cost-benefit analysis, PV systems, net present value, investment, specific profit
1. Introduction
In the past 10 years, photovoltaic systems (PV systems) have experienced significant growth, due to the intensive growing of the global PV industry and important decreasing of the PV module cost. By the end of 2012, the cumulative-installed PV capacity overtook more than 100-gigawatt installed power, reducing more than 53 million tons of CO2 per year (Masson et al. 2013). The penetrations of PV-systems in power system generally are developing in two directions (de Brito et al. 2011). The first direction is related to small-scale PV systems installed on the roof of houses and buildings. The second direction is belonged to large-scale grid-connected PV systems.
Researchers have been conducted on the economic evaluation of different scale PV systems to understand the impact of different parameters to investment (Meisi 1993, Liyanage–Rajakaruna 2011, Mao–Jin–Xu 2014). The most of these papers are mainly concentrated on the cost-benefit analysis of different PV system regarding scale size which is determined by national legislative (Muneer–Bhattacgarya–
Canizares 2011, Suh–Kim–Kwon 2012, Šljivac et al. 2014).
The paper introduces the study of two research teams of different research profile. In the paper it is tried to research regional impact of different PV system in Drava region related to different module technology. Therefore the authors of the paper working together on the bilateral project of cross-border Hungary-Croatia program in the field of renewable energy sources obtained detailed cost-benefit analysis of chosen PV systems in order to develop an optimal photovoltaic system for cross-border region (Pelin et al. 2014). The small-scale PV system was installed in Osijek, Croatia and regional impact is studied for Pécs, Hungary. The calculation is extended for Novi Sad, Serbia and Maribor, Slovenia in this paper. It can be noticed that Osijek, Pécs and Novi Sad have the similar intensity of solar radiation, whereas Maribor, Slovenia have better conditions regarding solar radiation.
2. Model and evaluation methodology
In the aspect of set up reliable model, one of main factors in determining of the average solar radiation data at specific location is usage solar database (REGPHOSYS 2014). Although, PVGIS evaluation of solar radiation is very precise, the average annual energy production is verified on installed PV system at location in Osijek by measurements for two months and all measurement data are recorded in database (PVGIS 2012). The annual sum of global irradiation in Pannonian part of Croatia, Serbia and Hungary is about 1300 kWh/m2 and for Slovenia this value is approxi- mately 1500 kWh/m2 (PVGIS 2012).
The next specificity regarding installed PV system was choice of the particular PV modules of different types of semiconductor materials (i.e. different technologies).
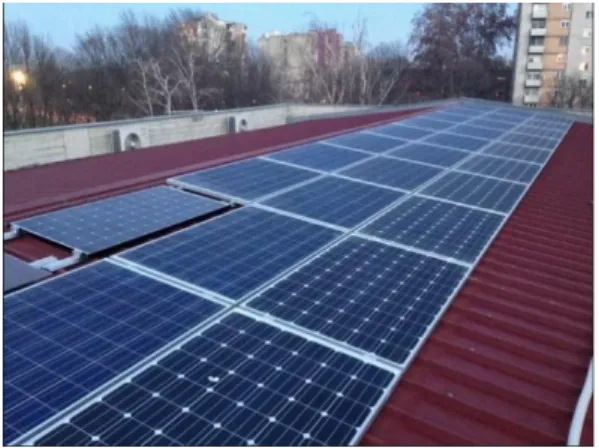
The following photovoltaic modules were installed at the roof of Faculty of Electrical Engineering building in Osijek, Figure 1.
1. monocrystalline technology; BISOL, BMO250, 250W, 2. pokycrystalline technology BISOL, BMU250, 250W, 3. CIS technology; SOLAR FRONTIER, SF-150, 150W, 4. amorphous technology; MASDAR MPV100-S, 100W,
5. high-efficiency monocrystalline technology PANASONIC, VBHN2450SE10, 245W.
For the purpose of the technical evaluation of the PV system, the choice of particular scale of photovoltaic system is done. Two types of PV systems are chosen regarding researching feed-in tariffs in the Croatian and Hungarian legislation and then the study is extended for Serbia and Slovenia:
solar home system users: It is small scale PV system. In this case, solar panels are installed on the roof structure of houses (mini home power plants), by which the complete photovoltaic system attains capacity of the order of 4 kW.
In this category of users, regulations set forth the stipulation that only surplus generated over energy demand can be fed into the central network in Hungary.
For Serbia, Croatia and Slovenia the situation where the PV users must by own consumption from central network after the selling of own energy production was analysed.
energy investors: This category involves big business enterprises which establish large-scale PV parks and feed electric energy produced by them into the central mains system which very well is corresponded to large-scale PV system. Power plants operated by such enterprises have an output of several hundred kilowatts, whereas, Hungarian regulations set forth 500 kW as maximum installed capacity. Since in Croatia the upper limit to solar power plant capacity is 300 kW, calculations for both countries were performed with 300 kW (Kovács and Suvák 2014).
Figure 1. Installed PV modules on the roof in Osijek
A research is based on a two-dimensional model, which, on one hand operates by the application of PV modules of varying sizes and types and, on the other hand, also researches a range of diverse application techniques. Our objective is to enable the economically most appropriate technology to be selected from among possible alternatives along the two dimensions. In order to perform cost-effectiveness calculations a considerable number of data is needed, Table 1. The model data are listed into two categories: technical data and technical parameters as well as the relevant prices for chosen equipment of PV system. The calculations were partly based on the measurement results and experience obtained on the PV-system installed in the Osijek (capacity, life-cycle), and on the other, on the data (costs) provided by the business undertakings executing the construction of photovoltaic systems, as well as on the set of data supplied by energy authorities.
Table 1. Dataset of the Model
Denomination of data Applied Source:
Technical data, parameters
Average annual energy production Measurement results by the University of Osijek, ETFOS
PV panel capacity Technical specifications
PV panel unit price Price offers
Inverter unit price Based on the Photon GmbH dataset (Photon GmbH 2014)
Panel life-cycle, capacity reduction Based on the study by Jordan and Kurtz (2013) Inverter lifetime Based on technical parameters 12.5 years System installation costs Practical experience
Cost charged for central network
connection Price fixed in Croatia (223 EUR/kW) and Slovenia (130 EUR/kW) while no such cost exists in Hungary and Serbia
Internal system, cost of system
construction Experience-based determination (by business undertakings executing construction) of 20% of the cost incurred for the complete system Annual maintenance costs Experience-based determination (by business
undertakings executing construction) of 15% of annual revenue
Price-type data
Retail price of electricity Electricity price trends, regulations
Electricity transmission rates National legal regulations, directives (HR Official Gazette 63/2012; Vlada Republike Srbije, 99/2009; MEKH 2014; Borsen 2014) Other data
Annual inflation rate Long-term forecasts of Eurostat, OECD and national banks
(HR: 0.5%; HU: 0.4%; SLO: 0.5%; SRB: 1.6%) Real interest rate Long-term forecasts of Eurostat, OECD and
national banks
(HR: 5%; HU: 5%; SLO: 2.5%; SRB: 6.5%) Whole investigation period According to long-term vision 25 years Source: Kovács and Suvák 2014.
2.1. Evaluation Methodology
In the interpretation of the described set of data, our model allows for the perfor- mance of several economic calculations, out of which hereby we use four indicators to enable us to evaluate the panel-choice alternatives for electricity producers (Kovács and Suvák 2014).
Eliminating the shortcomings of the real profit indicator (it assumes zero inflation) we used the inflation-adjusted or deflated profit: it eliminates the drawback implied by the above indicator, more specifically, it is suitable for long-term investigations and its calculation allows for the comparison of not only specific years but also a period of several years.
𝛱𝑡𝐷 = 𝛱𝑡
(1 + 𝑖)𝑡 (1)
𝑇𝛱𝐷= ∑ 𝛱𝑡𝐷
𝑛
𝑡=1
(cummulated form) (2)
where:
Πt – total profit
TRt – Total income for the year TCt –Total expenditure for the year p – Acceptance price
Qt– Generated electrical energy surplus, amount fed in the mains network ct – Annual energy demand
P – Consumer electricity price t – Number of years (1–25)
i – inflation rate (Kovács and Suvák 2014)
The net present values (NPV): It indicates the value of a given investment in year
“t”. It is defined as sum of the present values (PVs) of incoming and outgoing cash flows over a period of time. Incoming and outgoing cash flows can also be described as benefit and cost cash flows, respectively. We can talk about return on investment if it results in 0 NPV. This indicator extends the previous indicator by the mathematical operation of deducting the sum invested in year 0 from the inflation- adjusted profit (Talavera et al. 2011; Kovács and Suvák 2014).
𝑁𝑃𝑉 = 𝑃𝑉 0− 𝐶0 (3)
𝑁𝑃𝑉 = ∑ 𝛱𝑡
(1 + 𝑟)𝑡− 𝐶0 𝑛
𝑡=1
(4)
where:
PV0 – Present Value C0 – Investment value r- Real interest rate
Levelized cost of electricity (LCOE): The another modified formulate of LCOE1 is used. In this case, it indicates the ratio of total expenses and income/savings in a longer time period. Therefore, it can be interpreted as a type of cost-effectiveness, cost-benefit indicator (IRENA 2012, Pawel 2014).
𝐿𝐶𝑂𝐸𝑚= ∑ 𝐼𝑡+ 𝑀𝑡+ 𝑂𝑡
(1 + 𝑟)𝑡
𝑛𝑡=1
∑ 𝐸𝑡+ 𝑆𝑡
(1 + 𝑟)𝑡
𝑛𝑡=1
(5)
where:
LCOE – Levelised Cost of Electricity Generation It – Investment cost
Mt – maintenance cost Ot – Other costs
Et – income from feed into network
St – Cost benefits generating from self-supply (IRENA 2012; Kovács and Suvák 2014).
3. Technical and economical evaluation of a 4 kW solar home system users Regarding annual capacities, for an average family house, self-consumption from the energy generated is defined in 4.430 kWh (PORTFOLIO.HU). The incentive price which is taken into calculation for Croatia is 0.25 EUR/kWh, 0.21 EUR/kWh for Serbia, 0.42 EUR/kWh for Slovenia and 0.11 EUR/kWh for Hungary (HR Official Gazette 63/2012, Vlada Republike Srbije, 99/2009, MEKH 2014, Borsen 2014). This is the point where there is a sharp boundary between the Croatian, Serbian and Slovenian and the Hungarian relations. For all three countries the solar electricity transmission prices are considerably higher than electricity consumer prices, consequently, it is more profitable to sell as much solar electricity as possible at the incentive prices (i.e. there is a possibility to sell all the produced energy). As opposed to this, in Hungary feed-in-tariff, which is lower than consumer price (85% of the latter), discourage investments, also legal regulations stipulate that only surplus remaining after the use of own consumption can be fed into the system.
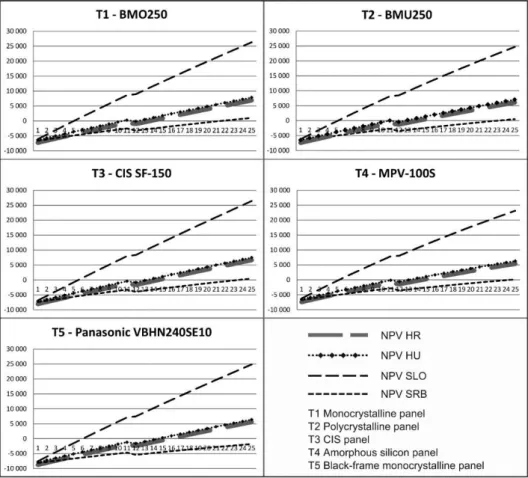
Results of the cost-benefit analysis and simulation for period of 25 years are given in Figure 2. analysed countries.
1 In the basic formulate of LCOE, the net present value of investment and other costs is the numerator and the yearly electricity production is the indicator’s denominator, and the LCOE shows the unit cost of PV system in EUR/kWh [20]. In our modified formulate of the LCOE, the denominator is a net present value of all incomes of PV-system.
Figure 2. The net-present value regarding five technologies for Croatia, Hungary, Slovenia and Serbia
Source: Calculations based on Kovács and Suvák 2014.
The shortest payback time can be attributed to monocrystalline panels, Figure 2.
In this context the best choice for solar home system user is the monocrystalline module (T1). In terms of the unit cost indicator, it is also the monocrystalline technology that is considered to be the most appropriate investment in all countries.
On the Croatian side, in a timeframe of 25 years, all the cost factors related to this technology account for 68.7% of the income, while, due to lower-level revenue opportunities, this percentage value reaches 65.7% in Hungary. In contrast, black- frame panels (T5) amount to as much as 77.2% of revenues and have cost factors constituting 78.0% of the income as shawn in Table 2. In relation to polycrystalline and amorphous silicon panels, the order of priorities also shows a discrepancy
between the two countries. By comparing all four countries, the long payback is calculated for Serbia, then for Hungary, Croatia and the best result are calculated for Slovenia due to the highest incentive price.
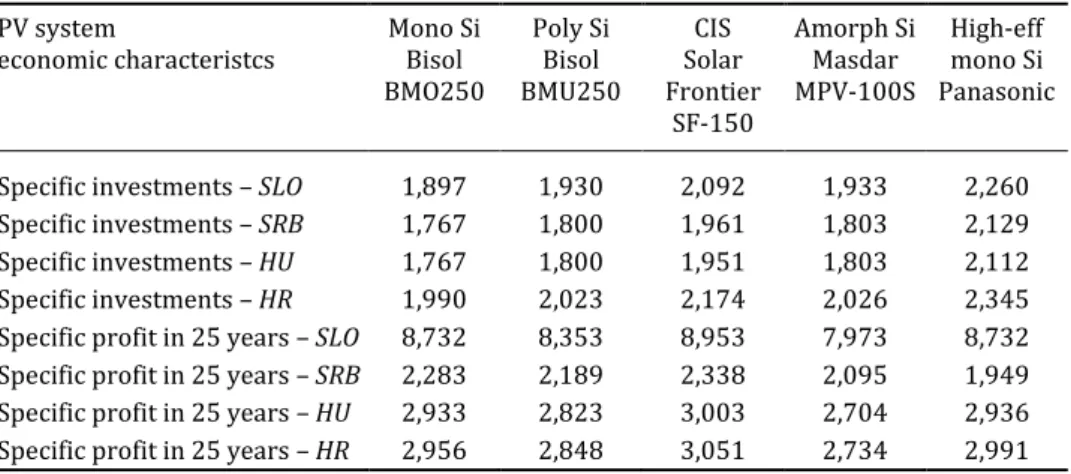
The specific investment cost and profit for all 5 module technologies are shown in Table 3. According to the results, the most expensive investment is calculated for Panasonic modules (2345 EUR/kW) in Croatia. The low specific investment is obtained for monocrystalline technology (1767 EUR/kW) in Serbia and Hungary.
The most profitable technology is CIS technology (8953 EUR/kW) for Slovenia.
In context of profitability, the countries are very different, but the investment costs for different technologies are similar. The Hungarian and Serbian specific investment data are similar, and the Slovenian values are better than Croatian. The specific profit’s country ranking is the following: Slovenia, Croatia, Hungary and Serbia.
Table 2. The unit price indicators regarding solar home system users for all countries
LCOE T1, HR 0.687 1. LCOE T1, HU 0.657 1. LCOE T1, SLO 0.290 1. LCOE T1, SRB 0.780 1.
LCOE T2, HR 0.696 2. LCOE T2, HU 0.668 2. LCOE T2, SLO 0.295 2. LCOE T2, SRB 0.828 2.
LCOE T3, HR 0.737 4. LCOE T3, HU 0.718 4. LCOE T3, SLO 0.317 4. LCOE T3, SRB 0.840 3.
LCOE T4, HR 0.697 3. LCOE T4, HU 0.669 3. LCOE T4, SLO 0.295 3. LCOE T4, SRB 0.867 4.
LCOE T5, HR 0.780 5. LCOE T5, HU 0.772 5. LCOE T5, SLO 0.340 5. LCOE T5, SRB 1.089 5.
Source: Calculations based on Kovács and Suvák 2014.
Table 3. The specific investment cost and profit for five different PV modules (EUR/kW) PV system
economic characteristcs Mono Si Bisol BMO250
Poly Si Bisol BMU250
CIS Solar Frontier
SF-150
Amorph Si Masdar MPV-100S
High-eff mono Si Panasonic
Specific investments – SLO 1,897 1,930 2,092 1,933 2,260 Specific investments – SRB 1,767 1,800 1,961 1,803 2,129 Specific investments – HU 1,767 1,800 1,951 1,803 2,112 Specific investments – HR 1,990 2,023 2,174 2,026 2,345 Specific profit in 25 years – SLO 8,732 8,353 8,953 7,973 8,732 Specific profit in 25 years – SRB 2,283 2,189 2,338 2,095 1,949 Specific profit in 25 years – HU 2,933 2,823 3,003 2,704 2,936 Specific profit in 25 years – HR 2,956 2,848 3,051 2,734 2,991 Source: Calculations based on Kovács and Suvák 2014.
4. Technical and economical evaluation of a 300 kW PV system for energy investors
The incentive price which is taken into calculation for Croatia is 0.20 EUR/ (kWh), 0.16 EUR/ (kWh) for Serbia, 0.42 EUR/ (kWh) for Slovenia and 0.11 EUR/ (kWh) for Hungary HR Official Gazette 63/2012, Vlada Republike Srbije, 99/2009, MEKH 2014, Borsen 2014).
In the case of energy producer investors profit indicators – although with signifi- cant differences – show the same ranking, namely CIS panels with the highest costs and with the lowest amortisation are the most favourable and the amorphous one is the least profitable.
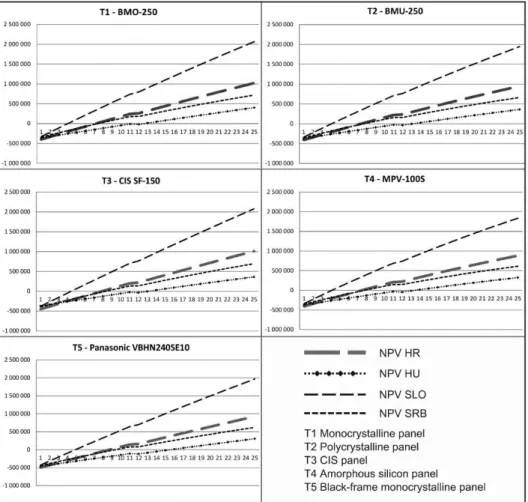
Considering net present values, no significant difference between user dimen- sions can be demonstrated, Figure 3. Similarly, for solar energy production-based power stations, the shortest payback time and the highest net present value are ascribed to monocrystalline modules technology. However, in view of this indicator, rankings are exactly the same in all countries; which appears in the sequence of T1, T2, T4, T3, T5.
Unit cost calculations produced relatively more interesting results since the order of rankings show, Table 4. The differences both in terms of countries and in user dimensions are recognised. In Croatia, Slovenia and Serbia, regarding energy generating and investment-focused installations, the smallest unit cost is ascribed to monocrystalline panels, whereas in Hungary the smallest unit cost is attached to amorphous silicon panels. However, in Hungary the order of rankings is blurred inasmuch as the difference between the best and the worst values does not reach 0.5%. Therefore, for energy investors in Croatia, Serbia and Slovenia, the installation of monocrystalline modules it provided to be the best alternative, as a contrast, in this respect such unambiguous statement cannot be made in Hungary.
The shortest payback time can be attributed to monocrystalline panels, Figure 3.
and Table 4. So, the lowest payback time is obtained for Slovenia, 3.9 years, then for Croatia 7.2 years, then goes Serbia with 7.35 years and Hungary at last with 12.6 years.
The specific investment cost and profit for all 5 module technologies are shown in Table 5. According to the results, the most expensive investment is calculated for Panasonic modules (1883 EUR/kW) in Croatia. The low specific investment is obtained for amorphous technology (1897 EUR/kW) in Hungary. The most profitable technology is CIS technology (8701 EUR/kW) for Slovenia.
Figure 3. The net-present value regarding five technologies for Croatia, Hungary, Slovenia and Serbia
Source: Calculations based on Kovács and Suvák 2014.
Table 4. The unit price indicators regarding PV system for energy investors for all countries
LCOE T1, HR 0.568 1. LCOE T1, HU 0.7592 5. LCOE T1, SLO 0,340 1. LCOE T1, SRB 0,574 1.
LCOE T2, HR 0.574 2. LCOE T2, HU 0.7542 2. LCOE T2, SLO 0,344 2. LCOE T2, SRB 0,587 2.
LCOE T3, HR 0.599 4. LCOE T3, HU 0.7542 3. LCOE T3, SLO 0,361 4. LCOE T3, SRB 0,641 4.
LCOE T4, HR 0.574 3. LCOE T4, HU 0.7541 1. LCOE T4, SLO 0,344 3. LCOE T4, SRB 0,588 3.
LCOE T5, HR 0.627 5. LCOE T5, HU 0.7543 4. LCOE T5, SLO 0,380 5. LCOE T5, SRB 0,700 5.
Source: Calculations based on Kovács and Suvák 2014.
Table 5. The specific investment cost and profit for five different PV modules (EUR/kW) PV system
economic characteristcs Mono Si Bisol BMO250
Poly Si Bisol BMU250
Solar CIS Frontier
SF-150
Amorph Si Masdar MPV-100S
High-eff mono Si Panasonic
Specific investments – SLO 1,460 1,494 1,636 1,496 1,790 Specific investments – SRB 1,330 1,364 1,506 1,366 1,660 Specific investments – HU 1,330 1,364 1,506 1,366 1,660 Specific investments – HR 1,553 1,587 1,729 1,589 1,883 Specific profit in 25 years – SLO 8,486 8,118 8,701 7,749 8,486 Specific profit in 25 years – SRB 3,871 3,711 3,964 3,551 3,871 Specific profit in 25 years – HU 2,059 1,981 2,108 1,897 2,061 Specific profit in 25 years – HR 4,109 3,955 4,201 3,798 4,103 Source: Calculations based on Kovács and Suvák 2014.
5. Conclusions
The photovoltaic system with technically the best high efficiency mono-crystalline modules is indeed the one with the highest and therefore least favourable specific investments, regardless of the system size.
The system with the multilayer Copper-Indium-Selenium (CIS) modules, which has moderate specific investments and medium efficiency with regard to the tested technologies, displays the highest expected electricity production as a result of the use of different materials and better usage of the sun radiation spectrum (confirmed additionally by measurement), as well as by far the lowest expected annual capacity loss results, along with the highest expected long-term specific profit during the 25- year (duration of module warranty) lifecycle of the photovoltaic system. Thus, based on the techno-economic cost-benefit analysis, this technology would be the one to recommend among the five tested technologies.
Additionally, amorphous silicon is the technology that, due to its lower efficiency, should result in lower specific investments, but its lower market availability results in similar specific investments as for the crystalline silicon technologies. Because of the significantly higher expected capacity loss during its lifecycle, it results in the smallest expected deflated profit.
The cost-benefit analysis also resulted in a lower expected investment cost for larger systems (up to 300 kW), but due to the respective lower incentives compared to the small systems (up to 10 kW) it still results in lower expected specific deflated profit.
The model uses a large variety of economic and technical data, Table 1, so the outcomes are relevant for a specific time when these data were valid. However, the
technology is in constant change, as well as the renewable energy policy all over the world and in the chosen countries. To make estimations for hypothetical situations caused by the change of the circumstances, a sensitivity analysis was carried out for the most important input data. An array of possibilities for reasonable economic and efficiency modifications has been investigated. The increase in the consumer prices of energy, the decrease in transmission prices and the impact of technological development were examined ceteris paribus. According to the results the model is sensitive to each of the three changes investigated. The pay-back time depends on these data-changes as follows: technological development and the increase in consumer prices exert positive influence by decreasing payback time since technological progress results in the reduction of annual costs and the increase in consumer prices entails savings generated from self- consumption. As opposed to this, the decline in transmission prices induces lower levels of annual revenues, i.e.
it results in prolonged payback time.
Acknowledgments
This research has been founded by the REGPHOSYS project of the Hungary-Croatia IPA Cross-border Co-operation Programme 2007–2013 (HUHR/1101/2.1.3./0002), co-financed by the European Union in the framework of the aforementioned programme. A part of this work has been supported under OTKA - Hungarian Scientific Research Fund grant #NK 104985 (New driving forces of spatial restructuring and regional development paths in Eastern Europe at the beginning of 21st century).
References and Notes
de Brito, M. A. G., Sampaio, L. P., Junior, L. G., Canesin, A. (2011): Research on photovoltaics:
Review, trends and perspectives, Proc. Power Electron. Conf. (COBEP), Praiamar, Portugal, September 11–15. pp. 531–537.
http://www.portfolio.hu/vallalatok/fenntarthatovilag/hodit_a_napenergia_nalunk_is_johet_
a_fordulat.204021.html
Incentive price of PV system for Slovenia:
https://www.borzen.si/sl/Domov/menu1/Informacije/Dokumenti/Dokumenti-CP IRENA (2012): Renewable Energy Technologies: Cost Analysis Series: Solar Photovoltaics.
IRENA Working Paper Series, 1 (4/5.) 45 p. http://www.irena.org/DocumentDownloads/
Publications/RE_Technologies_Cost_Analysis-SOLAR_PV.pdf
Joint Research Center, Institute for Energy and Transport (2012): PVGIS PhotoVoltaic Geographical Information System. http://re.jrc.ec.europa,eu/pvgis/.
Jordan, D. C., Kurtz, S. R. (2013): Photovoltaic Degradation Rates – an Analytical Review.
Progress in Photovoltaics, 21 (1), pp. 12–29.
Kovács, S. Zs., Suvák, A. (2014): Model and evaluation of the panels. In: Pelin, D., Šljivac, D., Topić, D., Varjú, V. (Eds.): Regional impacts of different photovoltaic systems, IDReasearch kft./ Publikon Kiadó Pecs, pp. 59–70.
Liyanage, D., Rajakaruna, S. (2011): Performance evaluation and cost-benefit analysis of a large solar PV installation at a mine site in Western Australia, Proc. IEEE PES Conference, Innovative Smart Grid Technologies Asia 2011, Perth, Australia, Nov. 13–16. 2011. p. 9.
Mao, M., Jin, P., Chang, L. Xu, H. (2014): Economic Analysis and Optimal Design on Microgrids with SS-PVs for Industries, IEEE transaction on Sustainable energy, 5 (4) pp. 1328–1336.
Masson, G., Latour, M., Rekinger, M., Theologitis, L-T, Papoutsi, M. (2013): Global market Outlook for Photovoltaics 2013–2017, EPIA (European Photovoltaic Industrial Association), p. 5.
Meisi, C. J. (1993): Parametric cost model for solar space power and DIPS systems, IEEE Aerospace and Electronic Systems Magazine, 8 (12) pp.24–29.
Muneer, W., Bhattacharya, K, Canizares, C. A. (2011): Large-scale solar PV investments modes, tools, and analysis: The Ontario case, IEEE Trans.Power Syst., 26 (4) pp. 2547–2555.
Pawel, I. (2014): The cost of storage – how to calculate the levelized cost of stored energy (LCOE) and applications to renewable energy production. Energy Procedia, 46 (1) pp. 68–
77.
Pelin, D., Šljivac, D., Topić, D., Varju, V. (2014): Regional impacts of different photovoltaic systems. IDReasearch kft./ Publikon Kiado Pecs.
Photon GmbH database:
http://www.photon.info/photon_site_db_ wechselrichteren.photon?ActiveID=1241 Photovoltaic System as Actuators of Regional Development, Database of v-i characteristics,
http://regphosys.eu./en/filebrowser/down-load/1812, 2014.
Šljivac, D., Nakomčić-Smaragdakis, B., Vukobratović, M., Topić, D., Čepić, Z. (2014): Cost-benefit comparison on-grid photovoltaic system in Pannonian parts of Croatia and Serbia.
Technical Gazette, 21 (5) pp.1149–1157.
Suh, M-h, Kim, K-H, Kwon, Y. I. (2012): Economic analysis of Korean photovoltaic power generation project, Proc. 8th. Int.Conf. Inf, Sci.Digit.Content Technol. (ICIDT), Jeju Island, Korea, June, pp. 340–343.
Talavera, D. L., Munoz-Cerón, E., de la Casa, J., Ortega, M. J., Almonacid, G. (2011): Energy and economic analysis for large-scale integration of small photovoltaic systems in buildings:
The case of a public location in Southern Spain. Renewable and Sustainable Energy Reviews 15 (9) pp. 4310–4319.
Tariff System of Hungary-reference: http://www.mekh.hu/hatosagi-arak-2/villamos-energia /kotelezo-atvetel.html
The Government of the Republic of Croatia: Tariff System for the production of electricity from renewable energy sources and cogeneration, Official Gazette 63/12, 2012.
Vlada Republike Srbije: Uredba o merama podsticaja za proizvodnju električne energije korišćenjem obnovljivih izvora energije i kombinovanom proizvodnjom električne i toplotne energije, “službeni glasnik RS”, broj 99/2009