The importance of electrophysiological and imaging methods in the diagnostics of inherited retinal degenerations:
Genotype-phenotype correlations
PhD thesis
Annamária Ditta Zobor MD
Doctoral School of Clinical Medicine Semmelweis University
Consultant: Dr. Eberhart Zrenner MD, D.Sc Official reviewers:
Dr. János Hargitai MD, Ph.D Dr. Illés Kovács MD, Ph.D
Head of the Final Examination Committee:
Dr. János Németh MD, D.Sc
Members of the Final Examination Committee:
Dr. Miklós Resch MD, Ph.D Dr. Mária Ferencz MD, Ph.D
Tübingen, 2014
Table of content
1. Abbreviations 4
2. Introduction 6
3. Aims 8
4. Methods: Good clinical practice (GCP) or how to manage clinical phenotyping 9
4.1. Methods of Electrophysiology 11
4.1.1. Ganzfeld Electroretinogram (ERG) 11
4.1.2. Multifocal Electroretinogram (mfERG) 13
4.2. Methods of Retinal Imaging 15
4.2.1. Fundus Autofluorescence (FAF) 15
4.2.2. Optical Coherence Tomography (OCT) 16
5. Results 18
5.1. Electrophysiological Methods and Their Clinical Relevance 18
5.1.1. Methodology of the multifocal ERG 18
5.1.2. Multifocal ERG in Retinitis Pigmentosa 24
5.2. Autosomal Dominant Cone- and Cone-Rod Dystrophies 29 5.2.1. GUCY2D- or GUCA1A-related Autosomal Dominant Cone-Rod Dystrophy:
Is There a Phenotypic Difference? 29
5.2.2. Cone and Cone-Rod Dystrophy Segregating in the Same Pedigree Due to the
Same Novel CRX Gene Mutation 34
5.3. „Some Very Rare Conditions“ 38
5.3.1. KCNV2-Retinopathy 38
5.3.2. Jalili Syndrome 44
6. Discussion and Conclusions 48
7. Summary 51
Összefoglaló 52
8. References 53
9. Own publications 66
9.1. Publications relevant to the PhD thesis 66
9.2. Other publications 67
10. Reprints of relevant publications 69
11. Acknowledgements 140
1. Abbreviations
ABCA4 ATP-binding cassette, subfamily A, member 4 (gene)
ACHM achromatopsia
AD autosomal dominant
AR autosomal recessive
CD cone dystrophy
CDSRR cone dystrophy with supernormal rod responses CNNM4 cyclin M4, metal transporter (gene)
CRD cone-rod dystrophy
CRT cathode ray tube
CRX cone-rod homeobox
cSLO confocal scanning laser ophthalmoscope CSNB congenital stationary night blindness DTL Dawson-Trick-Litzkow electrode ELM external limiting membrane
EOG electrooculography or electrooculogram ERG electroretinography or electroretinogram ETDRS early treatment diabetic retinopathy study FAF fundus autofluorescence
FD-OCT Fourier Domain optical coherence tomography FOK first order kernel
GCAP1 guanylyl cyclase activating protein 1 GCAP2 guanylyl cyclase activating protein 2 GCL ganglion cell layer
GCP good clinical practice
GUCA1A guanylate cyclase activator 1A (gene) GUCY2D guanylate cyclase 2D (gene)
HCN hyperpolarization-activated cyclic nucleotide-gated channel ILM internal limiting membrane
INL inner nuclear layer
IPL inner plexiform layer
ISCEV International Society for Clinical Electrophysiology of Vision IS/OS inner segment/outer segment
LCA Leber congenital amaurosis LED light emitting diode
KCNV2 potassium channel, subfamily V, member 2 (gene) MRI magnetic resonance imaging
NF1 neurofibromatosis type 1
NFL nerve fibre layer
OCT optical coherence tomography
ONL outer nuclear layer
OPs oscillatory potentials
OPG optic pathway glioma
OPL outer plexiform layer
PTC premature termination codon
SD-OCT spectral domain optical coherence tomography
RP retinitis pigmentosa
RPE retinal pigment epithelium
STGD Stargardt disease
TCDS total colour discrimination score VEP visually evoked potential
VERIS visual evoked response imaging system
2. Introduction
Inherited retinal dystrophies are a heterogeneous group of rare diseases affecting the posterior segment of the eye, including photoreceptors and retinal pigment epithelium (RPE). They all belong to the group of „rare dieases“ or „orphan diseases“, however, their prevalence is highly variable1,2. The most common form of retinal degenerations, retinitis pigmentosa (RP) is reported in 1 case for each 3000-5000 individuals2,3, while some rare conditions are described only in very few cases in the literature (i.e. Jalili syndrome)4. The diseases can be classified based on whether they predominantly affect the rods (i.e. RP) or the cones (i.e. cone- dystrophies), cause a rather localized defect (i.e. macular dystrophies) or even a more generalized retinal degeneration2,5,6. The clinical patterns are also variable: some conditions are progressive, while others are rather stationary; they can become manifest at birth or show first symptoms only in later decades of life; and the course of disease is highly individual1-3,5. The distinction between retinal dystrophies can further become challenging, as the clinical features of some diseases can be overlapping in early or late stages (Figure 1)1,2. Most retinal dystrophies are associated with a progressive deterioration over time and – in some cases – can lead to blindness1-3,5.
Figure 1: Phenotypic overlap between autosomal recessive retinal diseases. ACHM: achromatopsia; CD: cone-dystrophy; CRD:
cone-rod dystrophy; CSNB: congenital stationary noght blindness; LCA: Leber`s congenital amaurosis; RP: retinitis pigmentosa;
STGD: Stargardt`s disease. (illustration from Neveling et al. 1)
A particular hallmark of retinal dystrophies is the impressing genetic heterogeneity. More than 200 genes have been associated with inherited retinal degenerations so far, whose defects cause a stationary or progressive loss of photoreceptors or affect the RPE (Figure 2)7. Consequently, the underlying pathomechanisms are manifold and can affect phototransduction, synaptic signal transduction, specific metabolic features of photoreceptors or structural elements required in the visual cycle or in intracellular ion balance1-3. Some genetic mutations lead to different clinical phenotypes (i.e. mutations in the ABCA4 gene), on the other hand, certain forms of retinal degenerations (i.e. retinitis pigmentosa) can be associated with various genotypes2,3,7,8. This high degree of clinical an genetic heterogeneity poses challenges in making the correct clinical diagnosis and in identifying the underlying defects in known genes or detecting novel retinal disease genes.
Figure 2: The growing number of identified genes and loci causing inherited retinal diseases (current status at https://sph.uth.edu/retnet/ 7).
Up to date no established therapy is available for inherited retinal disorders, therefore, social and professional consequences are essential tasks to deal with.
Inherited retinal disorders a major cause of visual disability and legal blindness in the working population and thus have a considerable socioeconomic impact1-3.
In recent years, enormous efforts have been made in research and the new therapeutic approaches are promising9-11. Furthermore, with the help of improved molecular genetic and functional diagnostic tools an early recognition and differentiation has become possible.
3. Aims
In my research studies, I was focusing on two essential diagnostic tools:
1. on electrophysiological measurements, especially on the usefulness of the Ganzfeld and multifocal electroretinography
2. on retinal imaging techniques, especially on fundus autofluorescence (FAF) and optical coherence tomography (OCT) imaging.
The aim was to achieve a better clinical characterization of retinal dystrophies and to provide a better understanding of the nature of these disorders. The modern ophthalmological functional diagnostic tools enable a precise characterisation and early recognition of inherited retinal diseases. The detailed results can help to extend our understanding of the pathological mechanisms involved in these diseases.
This work summarises novel clinical findings, the usefulness of functional and morphological diagnostic tools and also describes some very unique retinal conditions.
The results provide valuable information for clinicians and can help to improve early and correct recognition and proper follow-up of various inherited retinal disorders. The better understanding of genotype-phenotype correlations reveals important information with respect to the likelihood of disease development and choices of therapy.
4. Methods: Good clinical practice (GCP) or how to manage clinical phenotyping
Despite the relatively high rate of occurrence of this heterogeneous pathologic category, the various forms of inherited retinal degenerations belong to the group of rare diseases2. Such uncommon, chronically debilitating diseases are of such low prevalence that special combined efforts and expert knowledge are needed to address them1,2.
The phenotyping of isolated or syndromic forms of retinal disorders can be a very challenging task, that should be preferentially carried out in a specialized center, where possibilities of extensive clinical examination and interdisciplinary collaboration are present1,12. „A good patient history is a half of a diagnosis“, therefore, detailed interviewing of the patient is essential, including following aspects of the disease:
− age of onset, that considers four possibilities for the beginning of specific symptoms and/or signs, detectable in children (or even at birth), adolescents, young adults or adults;
− course of disease, whether it is a stationary condition or progression can be noticed
− symptoms regarding central visual acuity, visual field defects, color vision disturbances, night vision, daily vision, adaptation time and photophobia
− information on pedigree, mode of inheritance that includes autosomal dominant (AD), autosomal recessive (AR), X-linked or in some very rare conditions digenic and mitochondrial inheritance patterns.
Furthermore, affection of other organs (i.e. central nervous system, hearing, metabolic disorders, etc.) and careful medical/toxicological history can provide useful information for the differential diagnosis1-3,5,6. This clinical starting point is necessary to obtain an effectual interdisciplinary collaboration among ophthalmologists, geneticists and other specialties12.
During the routine clinical practice of each specialized center, a standardized patient’s phenotyping and monitoring should be realized to maximize the chance of
successful characterization of inherited retinal degenerations1,12. Considering the extraordinary variability of retinal phenotypes, an extensive and standardized functional and morphological diagnostic protocol is required. These protocols for patients with ascertained or suspected retinal dystrophies can be schematized in12:
1) Functional characterization a) Psychophysical measurements
i) central visual acuity (mainly ETDRS chart, in low vision patients special tests like grating acuity might be desirable9)
ii) visual field testing (kinetic and/or static perimetry depending on symptoms) iii) microperimetry
iv) color vision tests (Panel D-15, Roth 28 Hue test, anomaloscopy) v) measurement of dark adaptation thresholds
b) Objective measurements - electrophysiology i) Ganzfeld electroretinography (ERG) ii) multifocal ERG (mfERG)
iii) electrooculography (EOG) iv) visually evoked potentials (VEP) c) Objective measurements - pupillography
2) Morphological characterization
a) biomicroscopy of the ocular anterior segment and ophthalmoscopy of the posterior segment
b) fundus color photography
c) optical coherence tomography (OCT) of the macular area and peri-papillary retinal nerve fiber layer
d) fundus autofluorescence imaging (FAF) e) retino-choroidal angiography
3) Genetic counseling
Considering the extraordinary variability of clinical phenotypes, genes responsible
for retinal degenerations, as well as of their modifiers, the applicability of these approaches will likely require the planning of several local, nationally or internationally coordinated clinico-genetic studies1,2,12.
4.1. Methods of Electrophysiology 4.1.1. Ganzfeld Electroretinogram (ERG)
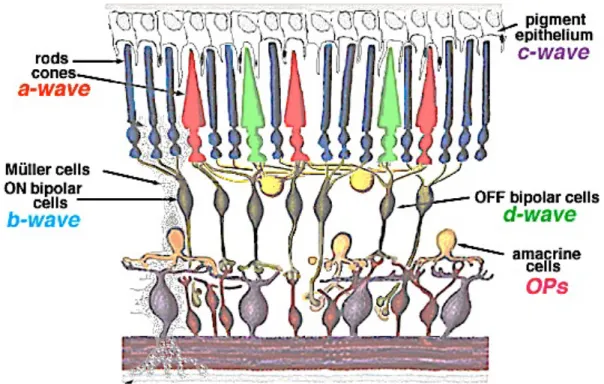
The Ganzfeld electroretinogram (ERG) is the record of diffuse electrical response to light stimuli generated by neural and nonneural cells in the retina6,13. The response occurs as the result of light-induced changes in the transretinal movements of ions, principally sodium and potassium, in the extracellular space. The two components, that are most often measured are the a- and b-waves. The first negative deflection, designated as the a-wave, is the result of the light-induced hyperpolarization of photoreceptor outer segments, therefore provides valuable information on the phototransduction cascade. This is followed by a subsequent positive component, the b- wave, mainly a consequence of ON-bipolar cell depolarization. The superimposed wavelets on the the ascending limb of the b-wave were termed oscillatory potentials (OPs). Their cellular origin is somewhat uncertain, although it is likely they are generated by the amacrine or possibly interplexiform cells in the inner retina. The change in ion concentration (i.e. decrease in extracellular potassium) around photoreceptor outer segments following light absorption also alters the standing electrical potential that exists between the basal and apical surfaces of the RPE cells.
This transient hyperpolarization of the RPE and the hyperpolarization of the Müller cells combine to form a monophasic positive deflection following the b-wave and is desginated as the c-wave. The traditionally very brief flash stimuli used for ERG recordings preclude isolation of the response of OFF-bopolar cells. However, with prolonged flashes photopic b-wave can be demonstrated to contain substantial OFF- response, the d-wave indicates activity of the OFF bipolar cells.
Depending on recording conditions (i.e. scotopic or photopic), stimulus intensity, wavelenght, frequency or stimulus duration, the function of various retinal
cells can be isolated6,13.
Figure 3: Schematic drawing of the retinal showing the origin of ERG components. (illustration from Webvision: The Organization of the Retina and Visual System)
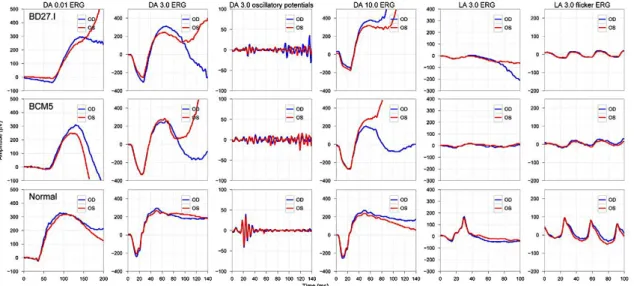
In 1989 a basic protocol was standardized by the International Society for Clinical Electrophysiology of Vision (ISCEV) and is being regulary updated (last update 2008)14, so that comparable ERGs can be recorded throughout the world. An ISCEV standard ERG should include the following responses (Figure 4), named according to conditions of adaptation and the stimulus (flash strength in cd*s*m-2):
(1) Dark-adapted 0.01 ERG (formerly ‘‘rod response’’)
(2) Dark-adapted 3.0 ERG (formerly ‘‘maximal or standard combined rod–
cone response’’)
(3) Dark-adapted 3.0 oscillatory potentials (formerly ‘‘oscillatory potentials’’)
(4) Light-adapted 3.0 ERG (formerly ‘‘single-flash cone response’’) (5) Light-adapted 3.0 flicker ERG (formerly ‘‘30 Hz flicker’’).
Recommended additional response: either Dark-adapted 10.0 ERG or Dark-adapted 30.0 ERG.
Figure 4: ISCEV Standard ERG recording in a normal subject. The blue colour indicated the results of the right eye, the red colour the left eye.
The five basic ERGs represent the minimum ERG evaluation for clinical diagnosis. It is intended that ISCEV Standard ERG protocols be used widely, but not to the exclusion of other tests or protocols that are not covered by this standard. Thus electrophysiologists are encouraged to extend test protocols to maximize the diagnostic value of the ERG for their patients and for clinical trials14.
4.1.2. Multifocal Electroretinogram (mfERG)
The conventional Ganzfeld ERG is a mass response to diffuse illumination of the retina and shows alterations only, when large areas of the retina are functionally impaired. Although the retinal cone system in humans is spatially heterogenous and the density of cone photoreceptors is highest in the fovea, their total number in the retina represents only less than 10% oft he total cone population. Therefore, diseases limited to the macular area typically do not produce Ganzfeld ERG abnormalities6,13-17.
The innovative technique of the multifocal ERG (mfERG) allows determining a topographic measure of electrical activity of the central retina based on a technique introduced by Sutter (1992)16,17. Although electrical responses from the retina are recorded with a similar corneal electrode as the Ganzfeld ERG, the nature of the
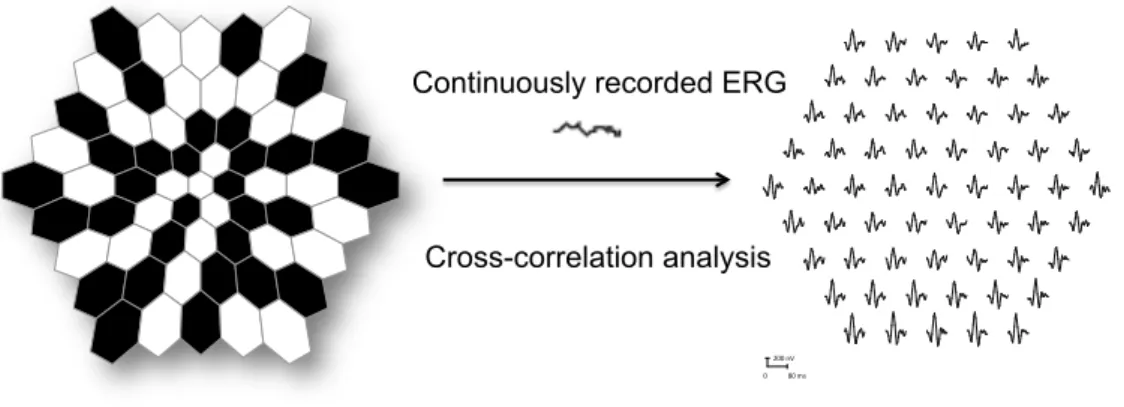
stimulus and the form of the analysis differ. These differences allow a topographic map of local ERG activity to be measured. For the basic mfERG described here, the retina is stimulated with an array of hexagonal elements, each of which has a 50% chance of being illuminated every time the frame changes. Although the pattern appears to flicker randomly, each element follows the same pseudo-random sequence of illumination with the starting point displaced in time relative to other elements. By correlating the continuous ERG signal with the sequence of on- and off-phases of each element, each local ERG signal is calculated. Although these local ERG signals are referred to as mfERG responses, it is important to keep in mind that they are not direct electrical potentials from local regions of retina, but rather they are a mathematical extraction of the signal (Figure 5)6,13-17.
Figure 5: The mERGs are elicited by an array of black and white hexagons (left). The hexagons go through a pseudo-random sequence of black and white as the frame changes. Then a cross-correlation technique produces multiple ERGs (right).
The typical waveform of the basic mfERG response (also called the first-order response or first-order kernel) is a biphasic wave with an initial negative deflection followed by a positive peak. There is usually a second negative deflection after the positive peak. These three peaks are called N1, P1, and N2, respectively. There is evidence that N1 includes contributions from the same cells that contribute to the a- wave of the light-adapted Ganzfeld ERG and that P1 and N2 include contributions from the cells contributing to the light-adapted b-wave and oscillatory potentials. Although there are homologies between the mfERG waveform and the conventional ERG, the stimulation rates are higher for the mfERG and, as noted above, the mfERG responses are mathematical extractions15.
200#nV
0 80#ms
Continuously recorded ERG
Cross-correlation analysis
Although evaluations of the macula of the retina by electrophysiological methods have been available for less than a quarter-of-a-century, their uses in clinical and research studies have been expanding with great enthusiasm. MfERG has become a standard and essential electrophysiological tool18-22. The technique continues to advance for the diagnosis of macular diseases, and in determining the underlying pathology of macular diseases. Coupled with the development of imaging technology mfERG will certainly produce much more advances in ophthalmology23.
4.2. Methods of Retinal Imaging 4.2.1. Fundus Autofluorescence (FAF)
Fundus autofluorescence (FAF) imaging is a novel imaging method that allows topographic mapping of lipofuscin distribution in the RPE cells as well as of other fluorophores that may occur with disease in the outer retina and the subneurosensory space24,25. Lipofuscin is an autofluorescent pigment that accumulates in the lysosomes of most aging eukaryotic cells. Excessive accumulation of lipofuscin granules in the lysosomal compartment of RPE represents a common downstream pathogenetic pathway in various hereditary and complex retinal diseases. Therefore, it can be used as a „visible“ biomarker for cellular aging and oxidative damage24-26.
The autofluoresence signal from RPE cells is very much correlated with lipofuscin content and accumulation27. FAF is increased with RPE dysfunction due to impaired processing and clearing of lipofuscin. Conversely, the FAF signal may be decreased in the setting of RPE or photoreceptor loss — if there are no photoreceptor outer segments, the source for lipofuscin formation may be lost25,26.
Lipofuscin is not a single compound but is actually composed of a number of molecules, not all of which have been fully characterized. The best-described component of lipofuscin is A2E, a bis-retinoid composed of two vitamin A molecules bound together. A2E is not recognized by lysosomal enzymes, so it may accumulate in lysosomes, and it possesses toxic properties that could result in RPE cell apoptosis.
There are many other components of lipofuscin, however, including peroxidation products of proteins and lipids and possibly over 10 different fluorophores28,29. Because of its diverse composition, lipofuscin has a broad spectrum of excitation (300-600 nm) and emission (480-800). Thus it can be excited by many wavelengths of visible light in the blue and green portion of spectrum. The intensity of the FAF emission signal returning from the RPE, however, is quite weak27-29.
Only with the advent of confocal scanning laser ophthalmoscopic technology could FAF approaches become clinically relevant. Confocal SLO (cSLO) uses a focused, low-power laser that is swept across the fundus in a raster pattern30. The confocal nature ensures that reflectance and fluoresence are from same optical plane and allows suppression and rejection of FAF originating from sources anterior to the retina, eg, the crystalline lens. Another advantage of cSLO imaging is that multiple frames may be acquired rapidly. This permits several single FAF images to be averaged to reduce background noise and increase image contrast. This allows FAF imaging to be performed at relatively low intensities, which is critical given that high-intensity blue light is uncomfortable and potentially harmful. With further development of the software, a semi-automated atrophy detection and quantification has become possible enabling an accurate identification and measurement of atrophic areas30.
FAF imaging has been shown to be useful with regard to understanding of pathophysiologic mechanisms, diagnostics, genotype-phenotype correlation, identification of predictive markers for disease progression, and monitoring of novel therapies. FAF imaging gives information above and beyond that obtained by conventional imaging methods, such as fundus photography, fluorescein angiography, and optical coherence tomography. Its clinical value coupled with its simple, efficient, and noninvasive nature is increasingly appreciated31-37.
4.2.2. Optical Coherence Tomography (OCT)
Optical Coherence Tomography (OCT) is one of the most valuable advances in retinal diagnostic imaging since the introduction of fluorescein angiography in 1959.
OCT is a non-invasive imaging technique relying on low coherence interferometry to generate in vivo, cross-sectional images of ocular tissues38-40. Originally developed in 1991 as a tool for imaging the retina41, OCT technology has continually evolved and expanded within ophthalmology as well as other medical specialties. With the introduction of Spectral (Fourier) Domain OCT (SD-OCT, FD-OCT) technology, it now provides greater tissue resolving power, significantly higher scan density, and faster data acquisition than original Time Domain OCT42-44.
Cross-sectional visualization is an extremely powerful tool in the identification and assessment of retina abnormalities. The high resolving power (10um - Time Domain, 5um – Spectral Domain) provides excellent details for evaluating the vitreo- retinal interface, neurosensory retinal morphology, and the RPE-choroid complex in the macular area (Figure 6). The ability to perform volumetric and retinal thickness analysis also provides a quantitative and repeatable methods to evaluate retinal abnormalities, surgical and pharmacological interventions40-44.
Figure 6: Retinal layers observed with SD-OCT (ILM: internal limiting membrane, NFL: nerve fiber layer, GCL: ganglion cell layer, IPL: inner plexiform layer, INL: inner nuclear layer, OPL: outer plexiform layer, ONL: outer nuclear layer, ELM: external
limiting membrane, IS/OS: photoreceptor inner- and outer segments, RPE: retinal pigment epithelium)
Inherited retinal disorders exhibit a huge variability of retinal changes, mainly affecting the outer retina and RPE cells. With the help of high resolution imaging, the integrity or abnormality of RPE cells, photoreceptor inner/outer segments and external limiting membrane can be analyzed even during early stages of disease, when the fundus appears normal. Furthermore, OCT has become one of the most important tools in clinical testing of experimental therapeutic strategies (surgical procedures, gene therapy trials)45-50.
ILM NFL GCL IPL INL OPL ONL ELM IS/OS RPE
5. Results
5.1. Electrophysiological Methods and Their Clinical Relevance 5.1.1. Methodology of the multifocal ERG
D. Nagy, E. Zrenner, H. Jägle (2007). Direct fundus-controlled multifocal ERG: first evaluation of a novel technique. ARVO Abstract
H. Jägle, D. Nagy, E. Zrenner (2007). ERG with a fundus imaging system: technique and a comparison with other stimulation methods. Meeting abstract Zhengzhou, China
D. Nagy, E. Zrenner, H. Jägle (2008). Three types of multifocal ERG: classical CRT, LED, and a CRT fundus imaging system ARVO Abstract
The multifocal electroretinogram (mfERG) was introduced into clinical application about 20 years ago and has been established as a useful diagnostic tool in retinal diseases15-17. Still, there are limitations of its use due to - among others - technical problems like incorrect electrode placement, low stimulation luminance, eye movement artefacts, opacity of ocular media, refractive errors, unstable or eccentric fixation. Furthermore, the available mfERG systems differ from each other in several aspects including both hardware and software51-53.
In our first study, we introduced a novel technique, which combined a fundus camera with a stimulation display allowing for compensation of eccentric fixation and direct fundus control. The purpose of this study was to evaluate the new method of fixation-controlled measurements in healthy subjects and to compare the reliability of the mfERG response amplitudes and implicit times of stimulation patterns with different number of hexagons. In a second study, we described the similarities and differences and the clinical relevance between three multifocal ERG systems – including the fundus-controlled mfERG system. Therefore, measurements in healthy subjects have been carried out using three different stimulation and recording systems.
First order kernel (FOK) responses were measured in ten healthy subjects (5 female and 5 male, mean age: 30, range: 14 to 46 years) using the direct fundus- controlled multifocal ERG (Roland Consult GmbH, Germany). The stimulating monitor (VM225, Lucius & Baer GmbH) was integrated into a fundus camera (VISUCAM Pro
NM, Carl Zeiss Meditec AG) and connected to a RetiPort system (Figure 7)54. Stimuli were presented at a resolution of 800x600 pixels with a maximum luminance of approx.
500 cd/m2. MfERGs were recorded twice from the right eye of every subject using a scaled stimulus array consisting of 7, 19, 37 hexagons and were recorded once with a stimulus consisting of 61 hexagons covering a visual field of approx. 40x40 deg.
Responses were amplified (low pass: 10 Hz, high pass: 100 Hz) and analyzed according to ring averages of the first order kernel responses. Amplitude and implicit time were analyzed for each setting. Finally, fundus photographs were taken from each subject for direct overlay with the response topography.
Figure 7: Direct fundus-controlled mfERG measurement. The fundus camera allows the correction of spherical refractive errors, which helps to provide a focused stimulus to the subject's retina during measurement. Furthermore, the infrared fundus camera
provides a real-time fundus image for accurate fixation monitoring during testing.
For comparison, the same healthy volunteers were measured by using a RETIscan system with LED-stimulation (Roland Consult GmbH, Germany)54 and the VERIS system (Electro-Diagnostic Imaging, Inc.)55. MfERGs were carried out twice with each device using DTL fibre electrodes, and a scaled stimulus array consisting of 61 hexagons according to ISCEV Standards15. Responses were amplified (200 000x) and band pass filtered (10-100 Hz) using a Grass amplifier (model 12, Quincy, USA) for the VERIS system (sampling rate 1024 Hz), and a built-in amplifier for the RETIscan systems (band pass: 5-100 Hz, sampling rate 1020 Hz). Parameters of the
different multifocal systems are listed in Table 1. Additionally, recordings with a light- triggered waveform generator were performed to compare response waveforms and timing differences.
Table 1: Parameters of the three multifocal ERG devices.
VISUCAM-RETIscan fundus-controlled multifocal ERG (Roland Consult GmbH, Germany)
RETIscan system with LED-
stimulator (Roland Consult GmbH, Germany):
VERIS system (Electro-Diagnostic Imaging, Inc.):
Monitor
CRT monitor (VM225, Lucius&Baer GmbH, luminance up to 500 cd/m2)
LED (light emitting diodes) stimulating device (luminance up to 700 cd/m2)
19” color CRT-monitor (luminance approx.
100 cd/m2)
Field
diameter 40x40° 60x60° 55x55°
Amplifier built-in amplifier of the RETIscan systems
built-in amplifier of the RETIscan systems
2 channel model 12 Grass amplifier (Quincy, USA)
Filter band pass filter (5-100 Hz) band pass filter (5-100
Hz) band pass filter (10-
100 Hz)
Sampling rate 1020 Hz 1020 Hz 1024 Hz
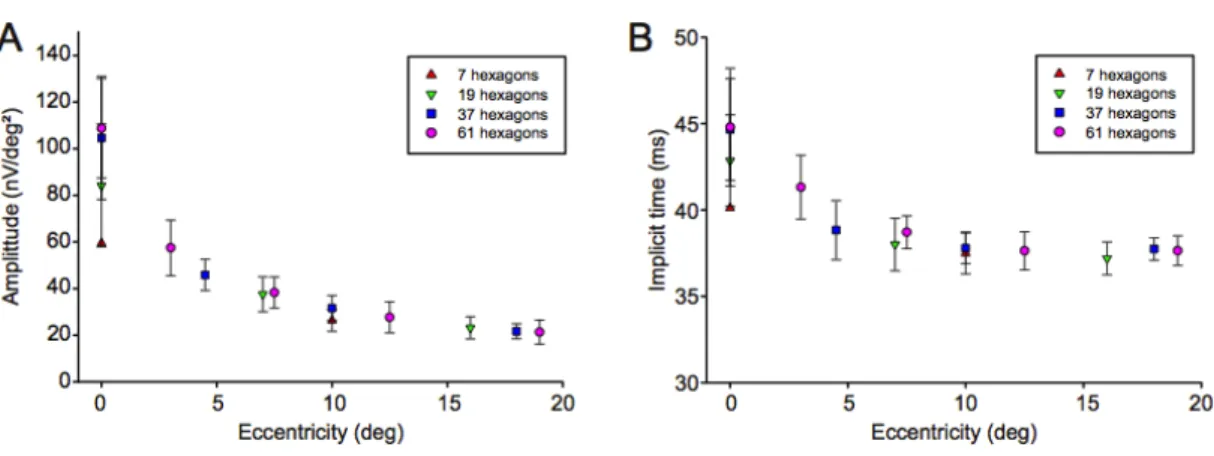
In the fundus-controlled mfERG measurements, typical mfERG response topographies were obtained for all conditions. The P1 amplitude varied between 42.1 and 165.0nV/deg2 in the central hexagon depending on the total number of hexagons in the stimulus and between 15.0 and 32.5 nV/deg2 in the outermost ring. The P1 implicit time changed from ca. 43.0 ms in the center to 37.4 ms in the outer ring and was similar for all recording conditions. We found significant variability in the response amplitude of the central hexagon between consecutive runs (difference between runs up to 64% of mean amplitude) but a good reproducibility for the outer rings. Smallest variability between subjects was found for 61 hexagons (Figure 8).
Figure 8: Mean amplitude and standard deviation of the mfERG analysis of all recordings according to concentric rings for stimuli consisting of 7, 19, 37 or 61 hexagons (A). The higher variability of the central hexagon is consistent with fixation instability during
the recordings. The lower amplitude for recordings with 7 and 19 hexagons is due to the lower average cone density within the larger central hexagons. The implicit time also decreases with eccentricity (B).
Our study showed that the fundus-controlled multifocal ERG is a convenient and precise technique for monitoring fixation during measurement. Although we found a great variability of response amplitudes in the central hexagon, this may be improved in the future by head stabilization and automatic fixation detection. One major advantage of the system is the continuous fundus imaging while mfERGs are recorded and fundus controlled compensation for eccentric fixation, which makes it an ideal device for mfERGs in patients with macular disease. Additionally, it allows for accurate overlay of functional data on fundus images. However, to achieve best results the head has to be kept in precise position relative to the device’s ocular lense. Further, an automatic analysis of fixation combined with ERG response waveform rejection may significantly improve recording quality.
When compared to other mfERG devices, response amplitudes showed a strong correlation between all three systems, being the largest with LED stimulation, due to the highest stimulus luminance (700 cd/m2). Response amplitude and implicit time of the central hexagon strongly depends on stimulus scaling and varies by 25 to 50% even though the stimulated field size is similar; we found significant variability in the P1 implicit times between the different techniques, even between the two RETIscan systems (Figure 9). Variability was greatest for the central hexagon (38 ms to 49.5 ms).
Figure 9: Comparison of response amplitudes between the RETIscan system with LED-stimulator and the VERIS System (A), the VISUCAM-RETIscan and the VERIS System (B) and between the VISUCAM-RETIscan and the RETIscan system with LED- stimulator (C). Response amplitudes show a good correlation between the systems. The largest amplitudes were obtained with LED
stimulation due to highest luminance (700 cd/m2). For all systems, we found high variability for the central hexagon. In contrast, implicit time varied signficantly, beeing much shorter for the VERIS system (D-F).
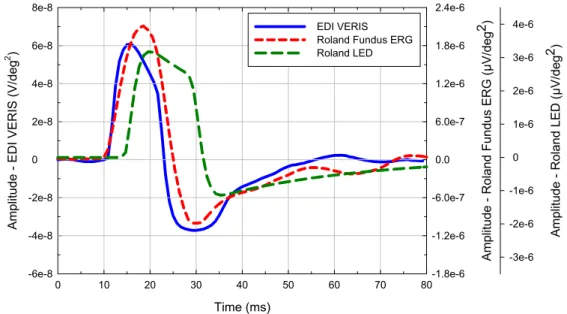
The test recordings showed different waveforms for each system, same latency for response onset (10 ms), but a peak implicit time difference of approx. 2 ms between the LED and the fundus ERG system (Figure 10). Compared to the variability estimated from repeat measurements aliasing effects on implicit time determination are negligible.
Figure 10: Test recordings performed with all three systems using a human subject simulation device (Roland Consult, Germany).
The response waveform depends on the actual amplifier input characteristics. We found simliar latencies (time to response onset) for the VERIS and Fundus ERG system, but longer latency for the LED system. Due to differences in response waveform, the peak
implicit time is similar for the two Roland RetiScan systems but shorter for the VERIS system.
Even though the stimulation, response recording and filtering follows ISCEV recommendations15, hardware differences (especially those of the amplifiers and stimulating monitor) lead to significant waveform and response parameter variability.
Therefore, a comparison of clinical data obtained with either system is restricted to larger effects with the central hexagon showing the largest variations51-53.
Time (ms)
0 10 20 30 40 50 60 70 80
Amplitude - EDI VERIS (V/deg2 )
-6e-8 -4e-8 -2e-8
0 2e-8 4e-8 6e-8 8e-8
Amplitude - Roland Fundus ERG (µV/deg
2 )
-1.8e-6 -1.2e-6 -6.0e-7
0.0 6.0e-7 1.2e-6 1.8e-6 2.4e-6
Amplitude - Roland LED (µV/deg2)
-3e-6 -2e-6 -1e-6
0 1e-6 2e-6 3e-6 EDI VERIS 4e-6
Roland Fundus ERG Roland LED
5.1.2. Multifocal ERG in Retinitis Pigmentosa
Nagy D, Schönfisch B, Zrenner E, Jägle H (2008). Long-term follow-up in retinitis pigmentosa using the multifocal ERG. IOVS 49(10): 4664-71
Zobor D, Zrenner E (2012). [Retinitis pigmentosa - a review. Pathogenesis, guidelines for diagnostics and perspectives]. Ophthalmologe. 109(5):501-14;quiz 515.
Retinitis pigmentosa (RP) is a heterogenous group of degenerative retinal diseases, which is associated with night-blindness, progressive loss of the peripheral visual field and a slow reduction in central vision and Ganzfeld-ERG abnormalities. RP diffusely and primarily affects the photoreceptors, predominantly the rod system, and as the disease progresses, the function of the cone system also declines. The age of onset, rate of progression, and the presence or absence of associated ocular features are frequently related to the mode of inheritance, but the clinical appearance may vary even among family members with the disease2,5,6.
Characterization and understanding of the visual loss is important for monitoring patients with RP. A detailed differential diagnosis and long-term follow-up are advisable for adequate patient counselling, for predicting visual outcome and for monitoring the efficacy and safety of new therapeutic options18,56,57.
Clinical psychophysical and electrophysiological measurements have been used to provide objective information regarding changes of the retinal function. While examinations, like visual acuity testing, perimetry, etc., rely on subjective criteria, electrophysiological methods are used to quantify retinal function in a more objective way. The Ganzfeld-ERG allows recording of electrical responses originating from the entire retina when stimulating with a Ganzfeld globe6,13,14. In contrast, the multifocal ERG (mfERG) allows assessment of a “map” of electrical activity15-18. With disease progression in the Ganzfeld-ERG the waveforms may no longer be detected while still some residual visual field could be measured. In such cases localized responses may still be obtained using the mfERG6,13.
The aim of our study therefore was to investigate the usefulness of the mfERG among other clinical psychophysical and electrophysiological techniques. Furthermore, we also provided a review of the characteristics and natural course of retinitis
pigmentosa. Emphasis was placed on determining the yearly progression of the mfERG responses. Our study also aimed at comparing multifocal ERGs and other parameters of disease development.
Twenty-three patients (9 male and 14 female, age between 12 and 66 years, mean: 36 years) with clinically defined RP were included in the study. Disease progression was monitored during a period of up to 10 years using psychophysical techniques, Ganzfeld ERG and multifocal ERGs recordings. Data were analyzed using the programs JMP 5.0.1 (SAS Institute Inc., Cary, NC, USA) and R 2.2.1 (R foundation for statistical computing, Vienna, Austria).
To describe disease progression we formulated linear regression models of the response variables visual field and mfERG values. The response variables were transformed by taking the logarithm to describe exponential decay of retinal function. In these models disease duration was included as fixed factor. Hence we fit the following equation:
) _
( Disease duration
response
= e
α+β⋅where response is visual field or one of the multifocal ERG values and α and β are intercept and slope.
For modelling repeated measurements, individuals were included as random factors on slope and intercept. The latter was included since disease onset data seemed not to be reliable (some patients could not remember correctly, when they first noticed changes in their visual function). Including the factor ‘eye’ (left/right) as a random effect nested in the factor ‘individual’ did not increase model fit significantly (ANOVA of the two model versions for all responses with p-value > 0.99). Therefore we omitted this factor, modelling for every individual the mean value of both eyes. In the plots data of both eyes are shown separately. Residuals' normality and homoscedasticity were assessed by quantile-quantile plots (QQ plot) and residuals by predicted plots, respectively. To identify outliers with high leverage Cook`s distance was calculated and the distribution of random parameters estimates was inspected by histograms. Quality of fits is recorded as adjusted coefficient of determination (adj R2).
To estimate correlations between the different examination methods describing macular function (multifocal ERG, visual acuity and color vision) Spearman`s rS was calculated and also scatterplots are shown. Correlations and scatterplots were also
produced for mid peripheral retinal function variables (perimetry, dark adaptation thresholds, Ganzfeld- and multifocal ERG).
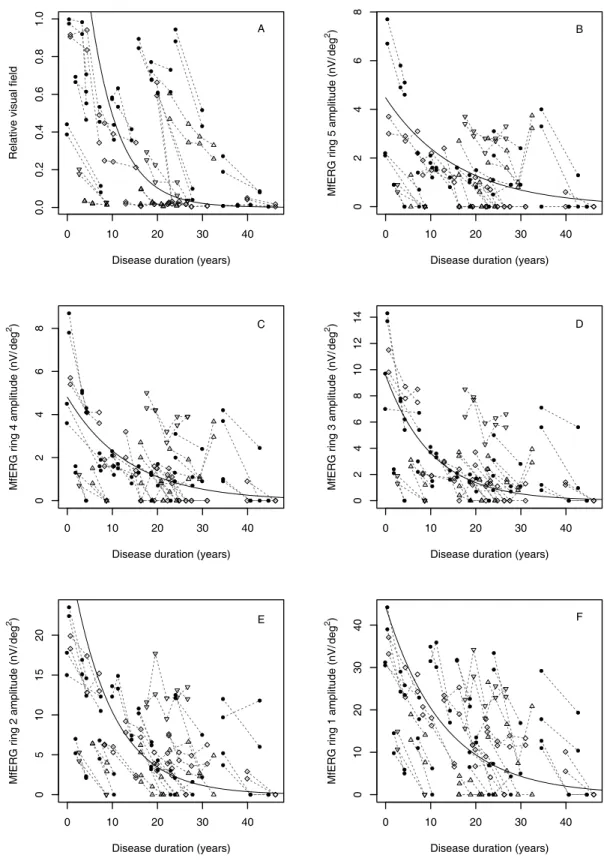
In our results, the progression of visual field loss is fairly described by an exponential decay, which is similar to the description by Iannaccone et al.58, a yearly progression of approximately 14.5 % can be calculated in patients affected with RP every year (Table 2). We were using the same type of regression model to define the natural progression of rod and cone functional loss measured by electrophysiological methods. We calculated the yearly progression according to the multifocal ERG values.
Approximately 6-10 % of the amplitude is lost every year in the outer three rings (Figure 11).
Table 2: Parameter estimates and statistics (fixed effects) for disease duration according to visual field changes from the literature and in the present study.
Study Target R2
95% confidence intervals
Estimate SE lower upper p
Iannaccone et al.58 (n=19)
I4e Intercept (α) 7.765 0.508 6.768 8.761 <0.0001 Slope (β) -0.172 0.023 -0.216 -0.127 <0.0001 V4e Intercept (α) 10.296 0.193 9.917 10.675 <0.0001 Slope (β) -0.136 0.010 -0.155 -0.117 <0.0001 Berson
et al. 61 (n=90)
V4e Slope (β) -0.046 N/A N/A N/A N/A
Massof et al.59 (n=172)
II4e Slope (β) -0.170 N/A N/A N/A N/A
V4e Slope (β) -0.145 N/A N/A N/A N/A
Holopigian et al.60 (n=23)
V4e Slope (β) -0.112 N/A -0.032 -0.192 N/A
Grover et al.62 (n=71)
II4e Slope (β) -0.102 N/A -0.078 -0.116 N/A
V4e Slope (β) -0.095 N/A -0.073 -0.144 N/A
Present study (n=23)
III4e 0.95 Intercept (α) 10.100 0.679 8.752 11.447 0.214 Slope (β) -0.156 0.030 -0.216 -0.096 <0.0001
Figure 11: Changes of residual visual field (A) and multifocal ERG of the outermost ring 5 (B), rings 4 to 2 (C – E) and the centre hexagon (F) during disease progression. The progression of visual field loss and changes of the mfERG amplitudes are fairly described by an exponential decay Symbols indicate heredity of the disease (ad = filled circles, ar = triangles, simplex = diamond
and Usher syndrome = upside down triangle).
0 10 20 30 40
0.00.20.40.60.81.0
Disease duration (years)
Relative visual field
●
●
●
●
●
●
● ●
●
● ●
●
● ● ● ●
● ● ● ●
●
●
●
●
●
●
●
●
●
●
●
●
●
●
●
●
●
●
● ●
●
●
●
●
●
●
●
●
●
●
●
●
A
0 10 20 30 40
02468
Disease duration (years) MfERG ring 5 amplitude (nV/deg2)
●
●
●
●
● ●
●
● ●
●
●
● ●● ●● ●●
●
●
●
●
●
●
●
●
●
●
●
●
●
●
●
●
●
●
●
●
●
●
●
●
●
●
●
●
●
●
●
●
●
●
B
0 10 20 30 40
02468
Disease duration (years) MfERG ring 4 amplitude (nV/deg2 )
●
●
●
●
● ●
●
● ●
●
●
●
●
● ●
●
● ●
●
●
●
●
●
●
●
●
●
●
●
●
●
●
●
●
●
●
●
●
●
●
●
●
●
●
●
●
● ●
●
●
●
●
C
0 10 20 30 40
02468101214
Disease duration (years) MfERG ring 3 amplitude (nV/deg2)
●
●
●
●
●
●
●
● ●
●
●
●
●
● ●
●
● ●
●
●
● ●
●
● ●
●
●
●
●
● ●
●
● ●
●
●
●
●
●
●
●
●
●
●
●
●
● ● ●
● ●
●
D
0 10 20 30 40
05101520
Disease duration (years) MfERG ring 2 amplitude (nV/deg2 )
●
●
●
●
●
●
●
●
● ●
●
●
●
● ●
●
● ●
●
●
●
●
●
●
●
●
●
●
●
●●
●
●
●
●
●
●
●
●
●
●
●
●
●
●
●
●
●
●
●
●
●
E
0 10 20 30 40
010203040
Disease duration (years) MfERG ring 1 amplitude (nV/deg2)
●
●
●
●
●
●
●
●
●
● ●
●
●
● ●
●
● ●
●
●
●
●
●
●
●
●
●
●
●
●
●
●
●
●
●
●
●
●●
●
●
●
●
●
●
●
●
●
●
●
●
●
F
We further compared parameters of disease development with the multifocal ERG values. We categorized the different examination methods according to macular and mid peripheral retinal function. We found a strong correlation between central visual acuity and multifocal ERG response amplitude of the central hexagon (rS = 0.75).
In contrast, there was no correlation between the multifocal ERG response amplitude of the central hexagon (rS = -0.40) and color vision performance (TCDS value). Regarding mid peripheral retinal function, mfERG ring 5 amplitude correlated strongly with the maximum response amplitude (rS = 0.87) and with the cone response amplitude (rS = 0.85) of the Ganzfeld ERG.
In advanced cases no reproducible Ganzfeld-ERG scotopic response was recorded, but with the multifocal ERG significant responses could still be recorded and dark adaptation thresholds could be measured.
In conclusion, the progression of visual field loss followed an exponential decay, which was similar to the changes described by other authors58,60. Other studies where more patients were included found either a somewhat higher59 or lower61,62 loss of visual field per year. On the other hand, he multifocal ERG provides a useful measure of the retinal function; it does not replace, but complement psychophysical methods including visual field and color vision testing. The response amplitude follows a similar exponential decay as the visual field and may provide reproducible responses even if the Ganzfeld-ERG is diminished. This issue is becoming more important, now that essential steps towards possible therapies for retinal degenerations are made and reliable and objective testing methods are required. The mfERG is well-suited for observation and long-term follow-up in disease development and – besides other psychophysical methods - it could be used as an objective outcome measure in upcoming treatment studies involving patients with advanced retinal diseases.
5.2. Autosomal Dominant Cone- and Cone-Rod Dystrophies
5.2.1. GUCY2D- or GUCA1A-related Autosomal Dominant Cone-Rod Dystrophy: Is There a Phenotypic Difference?
Zobor D, Zrenner E, Wissinger B, Kohl S, Jägle H (2014). GUCY2D- or GUCA1A-related autosomal dominant cone-rod dystrophy: is there a phenotypic difference? Retina. [Epub ahead of print]
Inherited cone and cone–rod dystrophies (CD and CRD) are characterized by progressive loss of photoreceptor function accompanied by retinal degeneration. All modes of inheritance have been observed, and the extensive genetic heterogeneity is typical for these dystrophies. Heterozygous mutations of the GUCY2D and GUCA1A genes have been shown to cause autosomal dominant CD and CRD63-71.Both genes are expressed in cone and rod photoreceptors and are essential for their functional integ- rity72-74.GUCY2D encodes the retinal guanylate cyclase (retGC-1), which is responsible for the cyclic guanosine monophosphate synthesis in the recovery of the dark state after light activation within these cells75. GUCA1A encodes the activating protein guanylyl cyclase activating protein (GCAP1), which regulates GC1 function in a Ca2+–sensitive manner (Figure 1)72,75,76. Mutations in GUCA1A or GUCY2D, in conclusion, result in an altered activity of retGC-1 in the dark. The thereby increased cyclic guanosine monophosphate levels keep cyclic nucleotide–gated channels open, allowing an increased Ca2+ influx into the photoreceptors causing cell death, which explains the progressive dysfunction in the phenotype. Indeed, this is one of the best-explained disease mechanisms for CRD or CD known in the literature65,76.
We conducted a study to investigate whether the 2 different genotypes—
mutations either in retGC-1 or its activating protein, GCAP1—make a difference in the phenotype, although they both act at the same step of the visual signal transduction cascade. Our aim was to compare the retinal function and morphology in patients affected by autosomal dominant CD or CRD carrying either a mutation in GUCY2D or GUCA1A using the same psychophysical, electrophysiological, and morphologic methods.
Five patients from a large family with known GUCA1A mutation (3 women and
2 men; mean age, 44 years; range, 32–57 years) and 9 patients from 4 families with GUCY2D mutation (6 women and 3 men; mean age, 49 years; range, 26–79 years) were included in this study. Psychophysical and electrophysiological examinations were performed to study retinal function. Fundus autofluorescence imaging and spectral domain optical coherence tomography were performed for morphologic characterization.
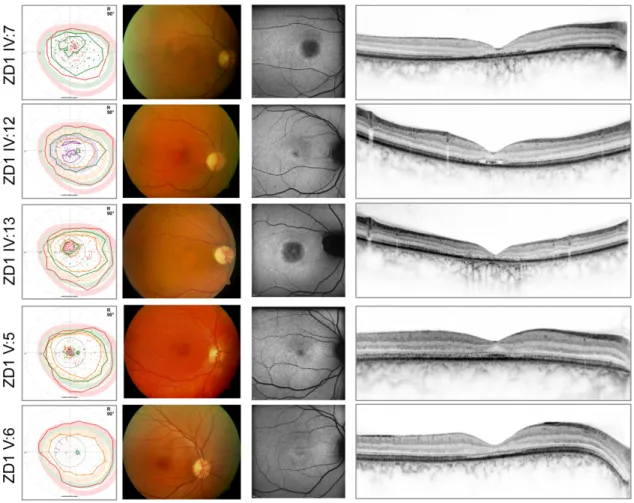
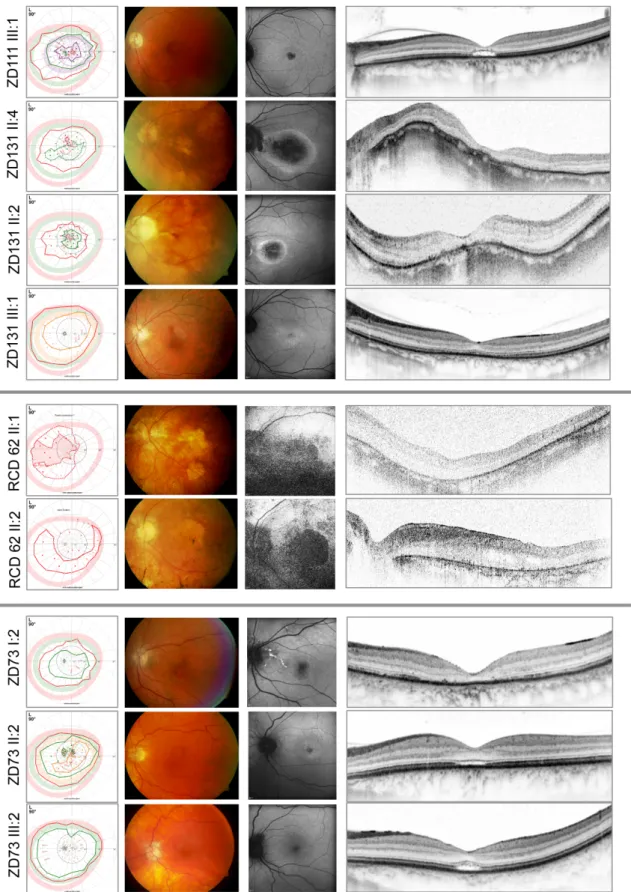
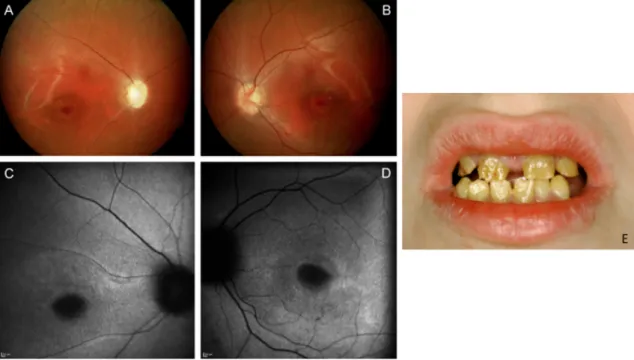
The typical phenotype in both of our patient groups was an autosomal dominant cone-dominated retinal dystrophy with disease onset in early adolescence, characterized by increased glare sensitivity, severe color vision disturbances, central defects in the visual field, but nearly normal outer boundaries. Retinal morphologic changes were relatively limited to the macular region, however, a great variability - from RPE mottling to large RPE defects - was detected even among families. The fundus autofluorescence (FAF) and optical coherence tomography (OCT) images also demonstrated the diversity of macular changes. In comparison, patients with GUCY2D mutations seemed to show more severe morphologic changes. Clinical findings of the GUCA1A patients are shown in Figure 12, findings of the GUCY2D group are presented in Figure 13.
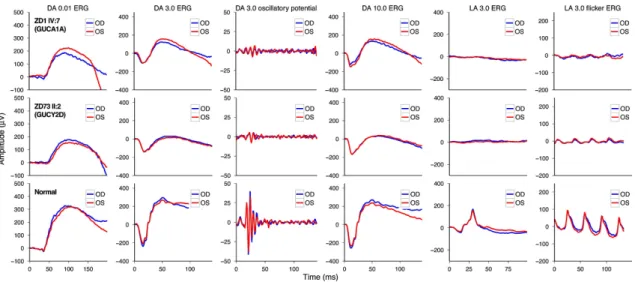
Functional results also suggested a cone-dominated dystrophy in both groups with a rather more severe phenotype in GUCY2D. In patients with GUCA1A mutation, the diagnosis of CD was more likely, although a slight alteration of rod function in the extended scotopic ERG protocol did show up. Patients with GUCY2D mutation revealed even more pronounced scotopic changes, so the final diagnosis was mainly CRD—with a negative ERG in three cases, suggesting an early involvement of inner retinal neurons (Figure 14)66. This difference also showed up in the dark adaptation thresholds. Patients with GUCA1A mutations retained more preserved rod function, whereas patients of the GUCY2D groups showed elevated dark adaptation thresholds, especially in the elder generation. The more preserved central visual acuity and visual field findings further suggested milder disease characteristics in GUCA1A cases.
Figure 12: From left to right: Kinetic perimetry results, fundus photography, fundus autofluorescence, and optical coherence tomography images of the patients of the family with GUCA1A mutations. In the perimetric results, central defects were detected,
whereas outer boundaries with target III4e (red) were nearly normal.
Our results suggest that the defects in GCAP1 (GUCA1A) signaling result in a less severe retinal dystrophy. What could be the explanation? GCAP1 and GCAP2 are both essential for normal phototransduction, but their expression in rods and cones shows differences with GCAP1 being predominantly expressed in cones77,78. The presence of GCAP1 and GCAP2 in mammalian rods is suggested to be almost equimolar; furthermore, their contribution to the biochemical pathway behind the GC regulation seems to differ. By participating in the activation of retGC-1 even at Ca2+
levels at which GCAP1 regulation is expected to predominate, GCAP2 quickens the recovery of the single-photon response and the responses to brighter flashes in rods.
This suggests an equally important role for GCAP2 and GCAP1 in rods. Furthermore, GCAP2 has been shown to act with lower activity on retGC-1 (GUCY2D), which might explain the more preserved rod function in altered GCAP1 signaling78,79.
Figure 13: From left to right: Kinetic perimetry results, fundus photography, fundus autofluorescence, and optical coherence tomography images of the patients of the family with GUCY2D mutations. The upper 4 patients are from 2 nonrelated families carrying the same p.R838C mutations in the GUCY2D gene. The members of the RCD62 family carrying the p.R838G mutation show a more severe phenotype (fifth and sixth panels). The lower 3 patients are from family ZD73 with p.R838H mutation in the GUCY2D gene. The perimetric results show central defects and variable attenuation of the outer boundaries with target III4e (red).