A Maximin-minimax Approach for Identifying Drought Tolerant Genotypes Based on Yield Potential and
Loss in Durum Wheat
R. MohaMaMdi*
Dryland Agricultural Research Institute, Sararood branch, Agricultural Research, Education and Extension Organization (AREEO), Kermanshah, Iran
(Received 17 February 2017; Accepted 4 April 2018;
Communicated by A. Mohan)
Drought is the major cause of durum wheat yield losses in the Mediterranean and many other regions where the crop is not normally irrigated. Over three years (2010–13), 24 durum wheat genotypes representing diverse genetic materials were tested under drought and irri- gated conditions. The main objectives were to assess the degree of genotypic variation for drought tolerance, characterize genotypic differences in response to drought, and identify sources of germplasm with greater drought tolerance than old and new cultivars. The percent reduction in average grain yield under drought conditions as compared to irrigated condi- tions was maximum (69%) during 2012–13, followed by 2010–2011 (33%) and 2011–2012 (15%). The average yields of genotypes under drought conditions differed significantly, which ranged from 1174 (correspond to old variety) to 2086 kg/ha (correspond to breeding line G2). The maximin-minimax approach, yield tolerance index (YTI) and three-dimension- al (3-D) plot were used to classify genotypes for drought tolerance and yield productivity.
Based on the results, two genotypes were identified as resistant and high yielding (G3 and G20), and eight genotypes (G2, G22, G8, G11, G15, G1, G9 and G5) were found to be high yielding and tolerant to drought conditions. Among the methods, the maximin–minimax approach appears to be more useful in identifying high yielding and drought tolerant geno- types as it seeks to minimize percentage yield loss while maximizing yield potential. In conclusion, considerable variability in yield and drought tolerance was observed for the durum wheat genotypes, which could be exploited at improving drought tolerance in durum wheat breeding program.
Keywords: durum wheat, drought stress, maximin-minimax approach, yield tolerance index
Introduction
Durum wheat (Triticum turgidum L. var. durum Desf.) is grown on 10% of the world’s wheat area. It occupies about 11 million ha in the Mediterranean basin, while its cultiva- tion suffers from variable yields due to climate changes. In agriculture, however, drought is the major constraint to productivity, causing yield instability in rain-fed areas and thus
*Corresponding author; E-mail: r.mohammadi@areeo.ac.ir
significantly affecting world agricultural productions (Blum 2011). More than 40% of the world is classified as dry land of which 8% is sub-humid and 16% is semiarid (Pretty et al.
2005; Middleton et al. 2011). Global studies indicate that climate change may signifi- cantly affect yield of different crop species in the world (Long et al. 2005; Wassmann et al. 2009). In the Mediterranean conditions, rainfall and temperature show large and un- predictable fluctuations within and among cropping seasons. The improvement of a crop’s productivity under drought conditions requires genotypes with drought tolerance and yield stability (Mohammadi et al. 2011). Grain yield performance in these environmental conditions, where stress is more frequent, still remains the best criterion for characteriz- ing cultivar adaptation to stress conditions (Fernandez 1992; Yadav and Bhatnagar 2001;
Sio-Se Mardeh et al. 2006; Nouri et al. 2011). The ability of cultivars to perform reason- ably well under drought is paramount for stability of production. However, the relative yield performance of genotypes under drought and irrigated environments can be used as an indicator to identify drought resistant varieties to breed for drought-prone environ- ments. From farmer’s point of view, a drought-resistant cultivar is one that yields better than any other available cultivar particularly under water-limited conditions (Moham- madi 2016).
Yield under water-limiting conditions, such those of the rain-fed Mediterranean envi- ronments, has also increased during the past decades (Sánchez-García et al. 2013). Many efforts have been made to improve crop productivity under water-limiting conditions.
The development of drought tolerant durum wheat genotypes is one of the best ways to make durum production more stable and sustainable, and therefore, drought tolerance has been identified as a major target area for crop improvement (Mohammadi 2016). Genetic diversity among national/international wheat germplasm for yield under drought has been reported (Cattivelli et al. 2008; Nouri et al. 2011; Dodig et al. 2012; del Pozo et al. 2016).
Plant breeding programs mainly focus on selecting genotypes that have high yield firstly under yield potential conditions (non-stress) and secondly under stress conditions. To reach this aim, the classical postulate, widely accepted by breeders for selection, is that a genotype with high yield potential will perform well under most environments (Blum 2005). However, in a breeding program a genotype may have relatively high percentage yield loss but still produce moderately high yield under this condition. On the other hand, a relatively low percentage yield loss genotype may yield below average. However, the genotypes are adapted to particular environments and under different environmental con- ditions or geographical regions may not perform the same. Further, losses due to yield is relative. It is quantified as the losses compared to normal or irrigated conditions. Thus, a low yielding showing minimum losses in drought may be classified as tolerant compared to high yielding showing maximum losses due to drought or vice versa. It is therefore important for selection purposes to give attention simultaneously to both yield potential under drought stress conditions and percentage yield loss due to drought stress.
Therefore, this study is aimed to (i) identify the response of different types of durum wheat genotypes to drought conditions and (ii) use a rapid graphical method of selecting or classifying genotypes based on yield potential and yield losses due to drought stress.
Materials and Methods Plant material, experimental layout and climatic data
The experiment was conducted at the Dryland Agricultural Research Institute (DARI)- Sararood station (34°19´N; 47°17´E; 1351 m.a.s.l.), Kermanshah, Iran. The station is representative for moderate winter cold rain-fed areas in durum wheat breeding program.
The research site is located in the moderate cold region in the west of Iran with minimum and maximum temperature of –20 and 45 °C, respectively, and 60–100 days of freezing temperatures annually. The average long-term annual precipitation is estimated to 425 mm. The climate data were collected from a meteorological station established at the sta- tion with 500–1000 m away from the experiments. The soil at the site was clay loam.
Twenty-four durum wheat genotypes (Table S1*) including 21 promising breeding lines (G1–G21), and three checks including one new (G22) and two old varieties (G23, G24) were evaluated under both rain-fed and supplemental irrigation conditions for three cropping seasons (2010–2013). Among the check genotypes, the Saji cultivar (G22) is an outstanding durum-wheat cultivar, recently released by the Dryland Agricultural Re- search Institute (DARI), for rain-fed and supplemental irrigation conditions in moderate cold and warm regions of Iran and is well appreciated by farmers. It is a high-yielding cultivar with stable performance, high pasta quality, and resistance to lodging, pests and diseases. Similarly, the Zardak (G23) and Gerdish (G24) genotypes are old varieties with a very limited cultivation area. These three control genotypes are ones that are usually used in DARI durum-breeding programs.
Under supplemental irrigation conditions two times irrigations with 25 mm each from flowering to initial maturity stage to cope with terminal drought stress was applied. The distance between the two experiments at each year was about 500 m. Experimental layout was a randomized complete block design with three replications. Plot size was 7.2 m2 (6 rows, 6 m long and 20-cm row spacing). Fertilizer rate was 50 kg N ha–1 and 50 kg P2O5 ha–1 applied at planting. Management practices recommended for each trial were followed in the all yield trials. For the genotypes several agronomic and physiologic traits were measured at flowering and grain harvest, but only the grain yield data were used for analyses.
Statistical analyses
A combined analysis of variance (ANOVA) of the grain yield data was performed using MSTAT-C program (Michigan State University, USA) to determine the effects of year, water-stress treatment, genotype, and all possible interactions between main effects. The effects of water-stress treatment and genotypes were considered fixed, and year and rep- lications were considered as random effects.
A maximin–minimax approach suggested by Odulaja and Nokoe (1993), was applied to classify the genotypes into different groups of drought response. The concept is to maximize the minimum expected yield (maximin) and minimize the maximum expected
*Further details about the Electronic Supplementary Material (ESM) can be found at the end of the article.
percentage yield loss (minimax). By this technique, the genotypes will be classified based on the percentage yield loss and actual yield potential. The selection of genotype is based on maximum yield and minimum yield loss under stress condition. In this technique, the maximin approach is to obtain the yield potential of each genotype relative to the resistant check, while the minimax approach is to obtain the percentage yield loss relative to the susceptible check. In this study the new durum variety (Saji) was considered as the resist- ant check and the susceptible check identified as the one giving maximum percent yield reduction in stressed conditions relative to unstressed condition. The relative yield (RY) and relative percentage yield loss (RP) for each genotype was calculated as follows (Odu- laja and Nokoe 1993):
where Yi is the yield of ith genotype and Yr is the yield of resistant check both under drought stress conditions.
where Pi is the percent yield loss of ith genotype and Ps is the percent yield loss in sus- ceptible check. The genotypes with higher value of RY and the lower value of RP were considered to have higher yield potential and minimum reduction in yield due to drought and were considered to be the most suitable genotypes under drought conditions. Using the Cate and Nelson (1965) the critical limits for RY and RP were identified; and a scatter plot of RY against RP (Maximin–minimax plot) was made and divided into four groups.
These groups were (i) drought resistant and high yielding (HR), (ii) drought tolerant and high yielding (HT), (iii) drought resistant and low yielding (LR) and ( iv) drought suscep- tible and low yielding (LS).
The yield tolerance index (YTI), which combines the relative performance of a geno- type under drought with its potential yield under irrigated conditions (Ober et al. 2004), was calculated as follow:
where YD and YI are the genotype mean yield under drought and irrigated conditions, respectively, and are the mean yield of all genotypes growing under drought and irrigated conditions, respectively.
A three-dimensional (3-D) plot based on YD, YI, and YTI to classify the genotypes, as suggested by Fernandez (1992), was applied. According to 3-D plot the genotypes classi- fied into four groups. In group A, genotypes expressing uniform superiority in both stress and non-stress conditions; in group B, genotypes expressing good performance only in non-stress conditions and not under stress conditions; while in group C, genotypes pre- senting a relatively higher yield only under stress; and in group D genotypes presenting poor yield performance in both stress and non-stress conditions.
RYi Yi
= Yr
100
RPi Pi
= Ps
100
YTI Y Y
Y Y
Y Y
Y Y Y
D D
I I
D D
D I I
=
=
2
Results Weather conditions
The patterns of monthly rainfall and average temperatures in three cropping seasons are shown in Figure S1. Rainfall distribution pattern remarkably varied among cropping sea- sons. However, rainfall was contrasting in the cropping seasons, and hence, the genotypes were exposed to drought stress, which is the most limiting factor in moderate cold rain- fed areas of Iran. All of the three seasons were characterized by lower rainfall levels (342.5, 302.9 and 394.3 mm, respectively in 2010–2011, 2011–2012 and 2012–2013 sea- sons) than the average long-term rainfall in the station (425 mm rainfall), where the crops experienced severe droughts with remarkable respective decreases in rainfall of 82.5, 122.1 and 30.7 mm relative to average long-term rainfall. 2012–2013 cropping season with rainfall amount of 394.3 mm was relatively close to average long-term of the station.
No marked variation in average temperatures was observed across cropping seasons, al- though the 2012–2013 season was warmer than other two seasons in winter.
Variance components of grain yield
The combined analysis of variance based on expected mean values for grain yield data revealed that the main effects due to year, water stress treatment, genotype, and all pos- sible interactions effects were significant (Table 1). Grain yield was affected mostly by the main effects of water stress treatment and year, which explained 32.3 and 19.7% of the total sum of squares (TSS), respectively. Genotype main effect was accounted for 8.0% of TSS. Among interaction effects, year by water stress treatment (YxS) was ac- counted for the highest variation (8.9%), followed by genotype by year interaction (GxY), genotype by water stress treatment (GxS) and GxSxY accounted for 5.0, 3.3 and 3.2% of the TSS, respectively.
Variability in year, water stress treatment and genotypes
There were large differences in grain yields, which mostly were due to differences in the response of genotypes to different water stress treatment and cropping seasons. Except for old varieties, which had low yield productivity, most of the breeding lines did not dif- fer greatly in yield. In general, those genotypes with high irrigated yields also tended to yield well under drought conditions (Figure S2). However, there were significant excep- tions to the trend. There are several examples of genotypes that showed similar irrigated yield potential but significantly different yields under drought. For example, genotypes that showed this response are G2 compared with G14, and G3 versus G20 in 2011–2012 (Figure S2). In 2012–2013, G2 had similar irrigated yield as G16, but significantly less yield under drought condition. A similar result was observed for G17 compared to G20.
The variation in yield under irrigated conditions was greater than drought conditions;
however, it was mostly due to high positive response of some breeding lines to irrigated conditions compared to old varieties.
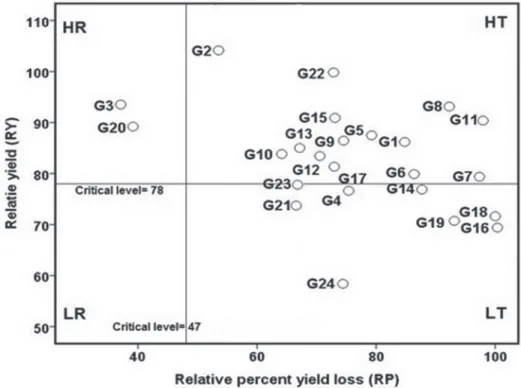
Table 1.Combined ANOVA for grain yield of 24 durum wheat genotypes grown under two water stress conditions during three cropping seasons (2010–2013) SourcedfSum of squaresMean squareExpected mean squareF-valueProbe%TSS Year (Y)26825017734125089σσ122 +rY16.70.0003419.7 Stress treatment (S)1112024815112024815σσσ1222 ++rryYSS54.70.0177932.3 YxS 23072057415360287σσ122 +rYS7.50.00778.9 Blocks/(YxS) 12245661172047176σ12 7.1 Genotype (G) 23277377971205991σσσσσ122222 ++++rryrsrsyGYSGSGYG3.20.000388 GxY 4617441680379167σσ222 +rsGYS2.40.000005 GxS 2311240152488702σσσ1222 ++rryGYSGS1.90.031863.2 GxYxS 4611582963251804σσ222 +rGYS1.60.012123.3 Error27643213434156570σ22 12.5 Total431346777710100 TSS: Total sum of squares.
A significant effect of two times irrigation on grain yield was observed (P < 0.01).
Under irrigated conditions, the average grain yields were significantly higher (2678 kg/
ha) as compared to drought condition (1659 kg/ha). However, on an average, there was 38% reduction in grain yield under drought conditions as compared to irrigated condi- tions. The average yields of genotypes under drought conditions differed significantly, which ranged from 1174 (correspond to old variety) to 2086 kg/ha (correspond to breed- ing line G2). The genotype G2 produced higher average yield than check cultivar (G22).
Under irrigated condition, the average yields ranged from 1846 (correspond to durum old variety G24) to 3507 kg/ha (correspond to breeding line G11). Under this condition, the genotypes with higher average yields than the check cultivar (G22) was the breeding line G11 followed by G8. The percent reduction in yield under drought condition as compared to irrigated condition was minimum in breeding line G3 (18.1%), followed by G20 (19.2%) and G2 (26.3%). The percent reduction in the rest of genotypes ranged from 31.2% (corresponding to breeding line G10) to as high as 49.2% (corresponding to breed- ing line G16).
The interaction effect of year and water stress treatment was found to be significant (P < 0.01) indicating that the yield under two water stress treatment differed significantly among the years (Table S2). Under drought conditions as well as irrigated conditions, the yield was significantly higher in 2011–2012 (2370 and 2802 kg/ha) followed by 2010–
2011 (1836 and 2736 kg/ha) and 2012–2013 (772 and 2495 kg/ha). However, the percent reduction in average grain yield under drought conditions as compared to irrigated condi- tions was maximum (69%) during 2012–2013 followed by 2010–2011 (33%) and 2011–
2012 (15%). The interaction of genotypes with year and water stress treatment was sig- nificant, indicating that performance of genotypes differed significantly across the envi- ronments (combinations of years and water stress treatments). However, the interaction indirectly indicates the stability in yield performance of genotypes across year. Stability analysis based on coefficient of variation (CV%, Francis and Kanenberg 1978) indicated that the breeding line G20 followed by G2, G10 and check cultivar were more consistent in yield productivity, while the breeding line G16 followed by G19, G11 and G7 were found to be unstable genotypes (Table S2).
Quantification of drought tolerance
Despite the general linear relationship between drought and irrigated yields in two out of three years (Figure S2), there is sufficient scatter to indicate that not all genotypes respond similarly to drought. This is shown by the significant interactions between genotype and water stress treatment (P < 0.05) (Table 1). Thus, there is no guarantee that a genotype selected for high irrigated yield potential will produce high yields under drought condi- tions. These interactions complicate the breeding process by introducing unknown factors that modulate the yield response depending on the availability of water. It is important, therefore, to differentiate between genotypes that have high yields under drought condi- tions simply because of high inherent yield potential and those that have greater drought tolerance per se. By combining relative yield performance under drought and irrigation
into one index value (YTI), the best genotypes for different stress conditions can be iden- tified. A genotype with high YTI must have some characteristics that prevent the loss of yield under drought but will not be desirable if its productivity is below average.
The values of yield tolerance index (YTI), and the ranks of genotypes according to this index for each year based on drought and irrigated yield plots are given in Table S3. The yield reduction for first, second and third years were 33%, 15% and 69%, respectively.
For third year, although the drought was less pronounced, the temperature was higher among the three years. Hence the yield hit might be due to combination of both drought and heat. In first year, the genotypes G5, G22 and G3 were tolerant to drought, while in second year the genotypes G11, G8 and G2; and in third year the genotypes G2, G20 and G22 were found to be high tolerant genotypes.
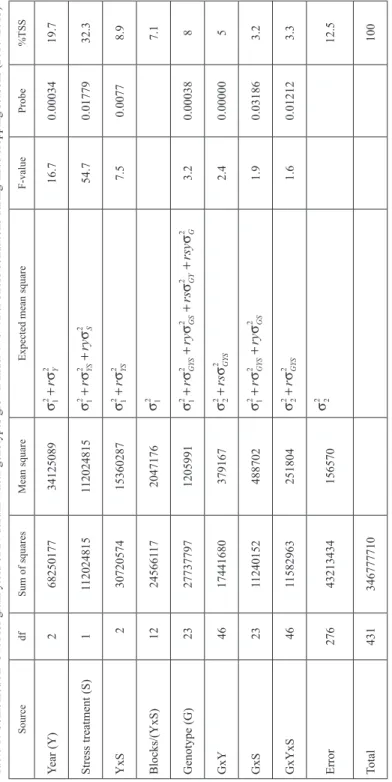
The drought (x) and irrigated (y) yields and YTI were plotted on a three-dimensional (3-D) plot to allow the division of the x-y area into four groups, marked as A, B, C and D (Figure 1). Breeding lines G2, G22, G8, G11, G15, G1, G9, G5 and G1 were classified in group A and found to be the desirable genotypes due to high yield productivity at both drought and irrigated conditions. Group B (high yield at irrigation, low in drought) con- sisted of breeding lines G6, G7, G14, G16 and G18, while group C (low yield at irriga- tion, high in drought) consisted of breeding lines G3, G10, G12, G13 and G20. The re- maining six genotypes (G4, G17, G19, G23 and G24) fell into group D (poor performance at both drought and irrigated conditions) and they are not the appropriate starting mate- rial for breeding durum wheat for drought tolerance. However, YTI was significantly correlated with grain yield at both drought (r = 0.836; P < 0.01) and irrigated (r = 0.888;
P < 0.01) conditions, indicating that the selection based on this index would be more
Figure 1. Three-dimensional (3-D) plot showing the different response groups (A, B, C, and D), defined by Fernandez (1992), according to their grain yield under drought (YD) and irrigated (YI) conditions
effective. The genotypes with highest YTI values were among group A and consisted of G11 followed by G8, G22 (Saji cultivar check), G2, G15 and G1 indicating that the selec- tion among genotypes performing well in both drought and irrigated conditions (group A) will enhance the drought tolerance in genetic materials.
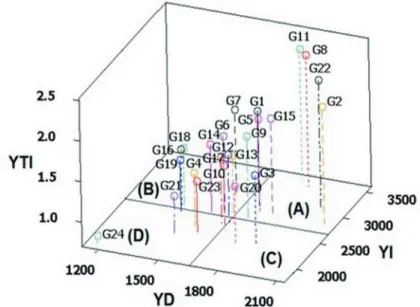
Maximin-minimax approach
Figure 2 shows the maximin-minimax plot which classifies genotypes based on yield potential and yield loss due to drought stress. Using Cate and Nelson (1965) procedure for partitioning genotypes response probability with drought, the critical limits were fixed at 78% for maximizing the minimum expected yield (maximin) and at 47% for minimizing the maximum expected percentage yield loss. Accordingly, four groups of genotypes in response to drought were identified. The first group represents drought resistant and high yielding (HR), the second group consists of drought tolerant and high yielding (HT) genotypes, the third group includes drought resistant and low yielding (LR) genotypes and the last group comprises of the drought susceptible and low yielding (LS) genotypes.
The genotypes with relative yield loss of less than 47% were considered as drought resist- ant and relative yield of more than 78% were considered as high yielding. The genotypes in group HR were considered to be high yielding and resistant, while genotypes in group
Figure 2. Maximin–minimax plot for classifying of 24 durum wheat genotypes
HT were tolerant although their relatives yield loss was more than 47%. Two genotypes were identified as resistant and high yielding (G3 and G20), eleven genotypes (G2, G22, G8, G11, G15, G1, G5, G9, G13, G12 and G10) found to be high yielding and tolerant to drought conditions, five genotypes (G24, G16, G19, G18 and G21) as low yielding and susceptible, none as low yielding and resistant, while the remaining six genotypes were around the critical levels (Figure 2).
Discussion
The year effect on grain yield was highly significant due to the high year-to-year climatic variation. However, yearly variation in climatic conditions had a large impact on the de- gree of stress experienced by crops and hence test environments (Benmahammed et al.
2010; Mohammadi 2016). There were significant differences among the years in the amount and distribution of rainfall. The yield differences under rain-fed conditions com- pared to irrigated conditions were also substantial with most genotypes being affected by severe drought stress during grain-filling. Differences observed for grain yield resulted from genetic variability among genotypes, variability in environmental conditions over the years, and interaction of genotype and year. Based on the results some breeding lines with good agronomic performance (high yield and drought tolerance) can be recommend- ed for commercial production.
However, under drought conditions, the genotypes recommended to farmers must have high yield potential along with high capacity of tolerance to drought stress. Considering these factors, various indices/parameters have been adopted to quantify drought tolerance in wheat and other crops (Fernandez 1992; Nouri et al. 2011; Sio-Se Mardeh et al. 2006;
Ober et al. 2004). The yield tolerance index (YTI) was used to categorize durum geno- types as possessing drought tolerance and high yield potential. The YTI, which is a simple field technique to detect genotypic differences in drought resistance and quantify loss in yield under water stress conditions (Ober et al. 2004). The highest value of this index was observed in breeding lines G8 followed by G11, G22, G2 and G15, while the durum old varieties (G24 and G23) showed the least value of this index (Table S3).
In this study two approaches including 3-D plot (Fernandez 1992) and maximin-mini- max plot (Odulaja and Nokoe 1993) were applied to classify the genotypes under drought and irrigated conditions. Both methods identified the breeding lines G3 and G20 (group C in 3-D plot and group HR in maximin-minimax plot) as high yielding and resistant genotypes. In addition, both of the graphical methods identified the breeding lines G11, G8, G22, G2 and G15 as high yielding and tolerant to drought (group A in 3-D plot and group HT in maximin-minimax plot). These genotypes in both groups are good genetic materials for breeding programs aimed at improving drought tolerance, suggesting that these promising lines can be good candidates for releasing in drought-prone environ- ments. Based on these results, both 3-D and maximin-minimax plots were generally same in identification of tolerant/resistant genotypes to drought. However, the maximin–mini- max approach appears to be more reliable in identifying the genotypes possessing drought
tolerance as it takes into account potential yield and yield loss due to drought stress (Bhatia and Jumrani 2016).
As mentioned above, the selection methods used by breeders are mainly based on yield production, where genotypes are firstly selected for their ability to produce more yield under both drought and irrigated conditions, compared with the performance of a check cultivar. Blum (1996) has noted that an apparently negative association between yield potential and drought resistance has been found in different studies, where genotypes with a superior adaptation to drought stress may have a lower yield in yield potential en- vironments. However, in this study, two genotypes (breeding lines G3 and G20) were found to be tolerant and high yielding genotypes. This was confirmed by both applied graphical techniques of 3-D plot (group C) and maximin–minimax plot (group HR).
However, simultaneous selection for high yield and drought tolerance is an important consideration in breeding programs (Fernandez 1992; Ober et al. 2004). Thus, the breed- ing programs should be focused on identification of potential lines with high yield and drought tolerance for subsequent varietal development for water limited areas (Ramya et al. 2016). To anticipate future needs in facing climate changes in the target region, it might be worthwhile to improve drought tolerance of new cultivars. In this study, durum wheat breeding lines G2, G22 (Saji), G8, G11, G15, G1, G9 and G5 showed high yield and better drought tolerance indicating a genetic gain for high yield and drought tolerance in durum wheat breeding program.
In conclusion, there was a high potential that breeding materials could be exploited by breeders for the improvement of the durum wheat, especially for drought-prone environ- ments. Most breeding lines from international nurseries could be considered as a genetic resource for drought adaptation, and they may enhance genetic potential for both high yield and drought tolerance in durum wheat. For durum breeding program, the yield toler- ance index (YTI) appear promising for screening genotypes in which high tolerances to drought based on grain yield in the drought and irrigated conditions are combined. In addition, the use of maximin–minimax approach appears to be more useful in identifica- tion of high yielding and drought tolerant genotypes as it seeks to minimize percentage yield loss while maximizing yield potential.
Acknowledgments
The author thanks the two anonymous reviewers for providing helpful comments and cor- rections on the manuscript.
References
Benmahammed, A., Djekoun, A., Kribaa, M., Bouzerzour, H. 2010. Assessment of stress tolerance in barley (Hordeum vulgare L.) advanced breeding lines under semi-arid conditions of the eastern high plateaus of Algeria. Euphytica 172:383–394.
Blum, A. 2011. Drought resistance – is it really a complex trait? Func. Plant Biol. 38:753–757.
Blum, A. 2005. Drought resistance, water-use efficiency, and yield potential – are they compatible, dissonant, or mutually exclusive? Aust. J. Agri. Res. 56:1159–1168.
Blum, A. 1996. Crop responses to drought and the interpretation of adaptation. Plant Growth Regulation 20:135–148.
Bhatia, V.S., Jumrani, K. 2016. A maximin–minimax approach for classifying soybean genotypes for drought tolerance based on yield potential and loss. Plant Breed. 135:691–700.
Cate, R.B., Nelson, L.A. 1965. A rapid method for correlation of soil test analyses with plant response data.
International Soil Testing Series Technical Bulletins no. 1.
Cattivelli, L., Rizza, F., Badeck, F.-W., Mazzucotelli, E., Mastrangelo, A.M., Francia, E., Marè, C., Tondelli, A., Stanca, A.M. 2008. Drought tolerance improvement in crop plants: An integrated view from breeding to genomics. Field Crops Res. 105:1–14.
del Pozo, A., Yáñez, A., Matus, I., Tapia, G., Castillo, D., Araus, J.L. (2016). Physiological traits associated with wheat yield potential and performance under water-stress in a Mediterranean environment. Front. Plant Sci. 7:987.
Dodig, D., Zoric, M., Kandic, V., Perovic, D., Momirovic, G.S. 2012. Comparison of responses to drought stress of 100 wheat accessions and landraces to identify opportunities for improving wheat drought resist- ance. Plant Breed. 131:369–379.
Fernandez, G.C. 1992. Effective selection criteria for assessing plant stress tolerance. Proceedings of the International Symposium on Adaptation of Vegetables and Other Food Crops in Temperature and Water Stress. Tainan, Taiwan: AVRDC, 257–270.
Long, S.P., Ainsworth, E.A., Leakey, A.D.B., Morgan, P.B. 2005. Global food insecurity. Treatment of major food crops with elevated CO2 or ozone under large-scale fully open-air conditions suggests recent models may have overestimated future yields. Philos. Trans. R. Soc. Lond. B Biol. Sci. 360:2011–2020.
Middleton, N., Stringer, L., Goudle, A., Thomas, D. 2011. The forgotten billion: MDG achievement in the drylands. New York: United Nations Development Programme.
Mohammadi, R. 2016. Efficiency of yield-based drought tolerance indices to identify tolerant genotypes in durum wheat. Euphytica 211:71–89.
Mohammadi, R., Sadeghzadeh, D., Armion, M., Amri, A. 2011. Evaluation of durum wheat experimental lines under different climate and water regime conditions of Iran. Crop Pas. Sci. 62:137–151.
Nouri, A., Etminan, A., Teixeira daSilva, J.A., Mohammadi, R. 2011. Assessment of yield, yield-related traits and drought tolerance of durum wheat genotypes (Triticum turgidum var. durum Desf.). Aust. J. Crop Sci.
5:8–16.
Ober, E.S., Clark, C.J.A., Le Bloa, M., Royal, A., Jaggard, K.W., Pidgeon, J.D. 2004. Assessing the genetic resources to improve drought tolerance in sugar beet: agronomic traits of diverse genotypes under drought- ed and irrigated conditions. Field Crop Res. 90:213–234.
Odulaja, A., Nokoe, S. 1993. A maximin-minimax approach for classifying crop varieties into resistant groups based on yield potential and loss. Inter.l J. Pest Manag. 39:64–67.
Pretty, J., Olsson, L., Farage, P., Warren, A., Tschakert, P., Ardö, J. 2005. Carbon sequestration in dryland soils.
World Soil Resources Reports 102. Rome, Italy: FAO Publications.
Ramya, P., Singh, G.P., Jain, N., Singh, P.K., Pandey, M.K., Sharma, K., Kumar, A., krishna, H., Prabhu, K.V.
2016. Effect of Recurrent Selection on Drought Tolerance and Related Morpho-Physiological Traits in Bread Wheat. PLoS One 14:11(6), e0156869.
Sánchez-García, M., Royo, C., Aparicio, N., Martín-Sánchez, A., Álvaro, F. 2013. Genetic improvement of bread wheat yield and associated traits in Spain during the 20th century. J. Agri. Sci. 151:105–118.
Sio-Se-Mardeh, A., Ahmadi, A., Poustini, K., Mohammadi, V. 2006. Evaluation of drought resistance indices under various environmental conditions. Field Crops Res. 98:222–229.
Wassmann, R., Jagadish, S.V.K., Sumfleth, K., Pathak, H., Howell, G., Ismail, A., Serraj, R., Redona, E., Singh, R.K., Heuer, S. 2009. Regional vulnerability of climate change: impacts on Asian rice production and scope for adaptation. Adv. Agron. 102:91–133.
Yadav, O.P., Bhatnagar, S.K. 2001. Evaluation of indices for identification of pearl millet cultivars adapted to stress and non stress conditions. Field Crops Res. 70:201–208.
Electronic Supplementary Material (ESM)
Electronic Supplementary Material (ESM) associated with this article can be found at the website of CRC at https://akademiai.com/loi/0806
Electronic Supplementary Table S1. Code and name/parentage of tested genotypes
Electronic Supplementary Table S2. The interaction effects of year and water stress treatment on grain yield of 24 durum wheat genotypes
Electronic Supplementary Table S3. Values of yield tolerance index (YTI) based on drought and irrigated yield plots and the corresponding ranks based on YDI values for 24 genotypes for each year
Electronic Supplementary Figure S1. Monthly patterns of rainfall and average temperature recorded during the course of the experiment
Electronic Supplementary Figure S2. Grain yields under drought conditions plotted against irrigated grain yields for each genotype in each cropping season