Contents lists available atScienceDirect
Thinking Skills and Creativity
journal homepage:www.elsevier.com/locate/tsc
Development of inductive reasoning in students across school grade levels
De Van Vo
a,*, Ben ő Csapó
b,caDoctoral School of Education, University of Szeged, 30-34, PetőfiS. sgt., Szeged, H-6722, Hungary
bInstitute of Education, University of Szeged, Hungary
cMTA-SZTE Research Group on the Development of Competencies, Hungary
A R T I C L E I N F O Keywords:
Inductive reasoning Rasch model Assessment Online testing Thinking skills
A B S T R A C T
Inductive reasoning is one of the main factors predicting academic success and a cognitive process offluid intelligence. The main purposes of this study are to examine the psychometric characteristics of an inductive reasoning test and to explore the development of students’in- ductive reasoning across school age groups. A random sample of 701 students was drawn from the 5th, 7th, 9th and 11th grades in six public schools in An Giang Province, Vietnam. The 32- item inductive reasoning test involves four different inductive reasoning tasks:figure series completion,figure analogies, number analogies and number series completion. The test was delivered online via the eDia assessment system. As the results of a confirmatory factor analysis show, the test is a suitable tool to measure inductive reasoning in the Vietnamese context with CFI = .902, RMSEA = .038, SRMR = .046 and Cronbach’s alpha = .88. The Rasch analysis also indicated that the test itemsfit the assessment model and formed an adequate instrument.
Students performed better on thefigural subtests than they did on the numerical subtests. The older age groups tended to earn higher scores than their younger peers on the test, indicating a modest pace of development. No significant difference was found between male and female students. Multiple regression analysis revealed that school grades predicted performance in in- ductive reasoning well, contributing 32.0 % to explaining the results of the inductive reasoning test. The current study provided evidence for students’development in inductive reasoning across school grade levels in Vietnam, where improving thinking skills is embedded in the core curri- cula.
1. Introduction
In line with contemporary frameworks for 21st-century competencies around the world, researchers as well as employers and policy makers called attention to for the need for competencies in communication, collaboration, ICT-related competencies and social skills. Creativity and problem-solving were appraised as significant competencies in the 21st century (Binkley et al., 2012;Chu, Reynolds, Tavares, Notari, & Lee, 2017;Voogt & Roblin, 2012). Reasoning plays a more important role in both educational contexts and the workplace today, and some reasoning skills are considered essential components of these 21st-century skills. Inductive reasoning (IR) has always been one of the most popular, most frequently studied constructs, and recent social changes and ex- pectations concerning the outcomes of education have further highlighted its relevance. Previous empirical studies have suggested
https://doi.org/10.1016/j.tsc.2020.100699
Received 27 March 2020; Received in revised form 3 July 2020; Accepted 22 July 2020
⁎Corresponding author.
E-mail addresses:vo.de.van@edu.u-szeged.hu(D. Van Vo),csapo@edpsy.u-szeged.hu(B. Csapó).
Available online 27 July 2020
1871-1871/ © 2020 The Author(s). Published by Elsevier Ltd. This is an open access article under the CC BY-NC-ND license (http://creativecommons.org/licenses/BY-NC-ND/4.0/).
T
that there is a close relationship between IR, on the one hand, and problem-solving and academic success, on the other (Csapó, 1997;
Molnár, Greiff, & Csapó, 2013;Schweizer, Wüstenberg, & Greiff, 2013). IR has been shown to play a dominant role in a wide range of learning activities (Hamers, De Koning, & Sijtsma, 1998). One of the most significant components of intelligence, IR assists students in decision-making and establishing causal relationships (Leighton & Sternberg, 2004).
Reliable assessment of IR is a precondition of studying its development as well as measuring the effects of intervention experi- ments; furthermore, easy-to-use tests may aid teachers in monitoring students’progress. More, broadly accessible measurement data contribute to a deeper understanding of factors in the development of students’abilities. It may be meaningful to evaluate the efficacy of current curricula in terms of supporting students’optimal cognitive development and proposing improved programs in the future.
In Vietnam, thinking skills are embedded in the core curricula at the general educational level. The national educational program prefers improving thinking proficiency through implicit discipline curricula to designing specific programs explicitly. Consequently, there are no explicit programs that focus on developing thinking skills. Though one core criterion for completing general education is for children to pass the national high school examination, there is no research to investigate students’thinking skills on this ex- amination. However, Vietnamese students achieved high scores in the Program for International Student Assessment (PISA) by the Organization for Economic Co-operation and Development (OECD), which mainly measures subject matter-related knowledge, skills and their application in practical contexts. In the 2015 PISA cycle, Vietnamese students performed better than the OECD average in two domains, reaching a mean score of 525 in science (OECD mean: 493) and 495 in mathematics, while remaining somewhat below the OECD mean (493) with a score of 487 in reading (OECD, 2016).
Vietnam did not participate in the 2012 and 2015 PISA problem-solving assessments, and relatively little is known about how schools have succeeded in developing IR in general. Although reasoning has been introduced implicitly into the curricula, no em- pirical studies have explored general reasoning skills in Vietnam. Therefore, the goals of this study are to validate instruments for assessing IR translated into Vietnamese and to explore the development of students’IR across school grade levels. The present study is expected to draw a partial picture of students’performance in IR and to provide initial empirical foundations for further research, and to support the developmental work of teachers.
2. Theoretical background
2.1. Inductive reasoning
There are several definitions of reasoning found in the research literature. The main focus is that reasoning can be broadly defined as the goal-driven process of drawing conclusions which informs problem-solving and decision-making efforts (Leighton & Sternberg, 2004).Sternberg and Sternberg (2012)explained that in reasoning“we move from what is already known to infer a new conclusion or to evaluate a proposed conclusion”(p. 507). Although an enormous number of interpretations and definitions of IR can be found in numerous disciplines from philosophy through mathematics to psychology, it is acceptable for practical educational purposes if IR is considered a cognitive process which aids in generalizing rules from individual observations, thus reaching a general conclusion from individual cases (Adey & Csapó, 2012;Sternberg & Sternberg, 2012). From an educational perspective, the IR model proposed by Karl Josef Klauer is especially beneficial, as it describes the structure of IR so that its components are clearly identifiable (Klauer, 1989, 1990,1996;Klauer & Phye, 2008). Klauer suggests that IR requires exploration of regularities and irregularities to form rules and make generalizations, as depicted inFig. 1. IR tasks, therefore, reveal regularities and irregularities, and even diversities.
Fig. 1.Definition of inductive reasoning (Klauer & Phye, 2008, p. 87).
IR provides a fundamental basis both for the understanding of regularities of knowledge and for the generation of concepts and categories in our daily life (Klauer & Phye, 2008). When unfamiliar problems occur, inductive processes tend to generate hypothetical rules which will be tested by further actions and observations. (Perret, 2015). To sum up, IR plays a dominant role in understanding science and application of knowledge in unfamiliar contexts (Csapó, 1997) and one of the seven core mental abilities that contribute to intelligent behavior (Kinshuk, Lin, & Mcnab, 2006).
2.2. Assessing inductive reasoning
Tests offluid intelligence often apply IR tasks, and their paper-based versions have been used for more than a century. Thanks to the advancements of technology-based assessment, digitized versions of previous paper-and-pencil tests are often available on computer as well, and recently, more sophisticated IR tests, using a broad range of multimedia options have also been developed.
The most popular kinds of IR problems are verbal and geometric analogies, number series completions, classifications and geometric matrices (Adey & Csapó, 2012;Klauer & Phye, 2008;Sternberg & Sternberg, 2012;Sternberg, 1986). An analogy task refers to the structure-like form A is to B as C is to D (A : B :: C : D). These types of tasks are frequently used on intelligence tests as well (Ifenthaler & Seel, 2011;Sternberg, 1986;Stevenson, Hickendorff, Resing, Heiser, & de Boeck, 2013;Tunteler, Pronk, & Resing, 2008;
Tzuriel & George, 2009;Vogelaar, Sweijen, & Resing, 2019).
Series completion tasks include requirements where participants extrapolate the next member of a given series (numbers, letters, words or geometricfigures), which are ordered by one or more relations. When students solve a series completion task, they explore the relationships between the given elements tofind the next element in the series.
Classification tasks can be composed in different forms that require test-takers to indicate which word,figure or number does not belong to the others. The mental requirements are similar to those of analogy and series completion problems.
Geometric matrices present a set offigures in a matrix format (where the rows and the columns are arranged according to certain rules) and require extrapolation tofind a missingfigure. They are often used influid intelligence test, such as Raven’s progressive matrices (see e.g.Raven, 2003).
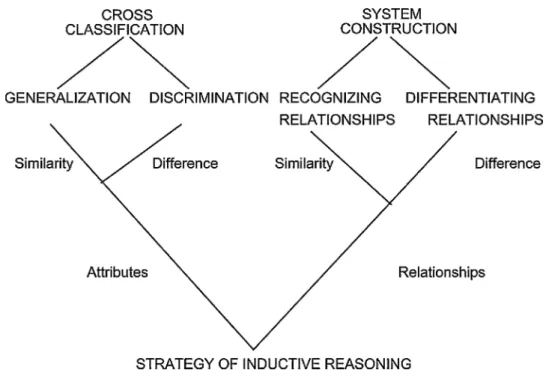
Klauer’s model of inductive reasoning also offers a system for creating IR test items.Fig. 2presents the genealogy of the re- lationships among the basic varieties of tasks in IR, deduced from Klauer’s model.
In recent years, computerized versions of IR tests have been routinely used. A number of media effect studies have indicated that if the tasks maintain their main characteristics (content as well as visual appearance) after the digitization process, the media effect is insignificant. The media effect was not found for IR (Csapó, Molnár, & Tóth, 2009) or for the Raven Progressive Matrices Test (Williams & McCord, 2006). For young children who still cannot read, tests are individually administered face to face. Computerized versions of such tests may work even better, as a pre-recorded voice and automatic scoring improve the objectivity and reliability of the testing (Csapó, Molnár, & Nagy, 2014). These results suggest that using both paper-and-pencil and online tests in the present study does not raise equivalence issues.
Fig. 2.Genealogy of tasks in inductive reasoning (Klauer & Phye, 2008, p. 89).
2.3. The role of inductive reasoning in the school context
A majority of past studies have suggested that IR is an important predictor of academic performance. Asfluid intelligence is measured with IR tasks, the impact of IR and that of intelligence are studied in similar ways (Mayer, Sodian, Koerber, & Schwippert, 2014;Strobel, Behnke, Gärtner, & Strobel, 2019). However, IR is a better defined construct than intelligence. There exist empirically tested models for its structures, and its basic components are identified. The role of IR in learning is also easier to interpret; therefore, assessing IR instead of intelligence in an educational context is more beneficial. Much research provides evidence that students scoring higher on an IR test are likely to obtain higher scores in school performance in mathematics, science, social studies and languages (Ariës, Ghysels, Groot, & Van Den Brink, 2016; Strobel, Behnke, Gärtner, & Strobel, 2019;Csapó, 1997;Díaz-Morales &
Escribano, 2013;Mehraj, 2016;Mollohan, 2015;Nikolov & Csapó, 2018;Stamovlasis, Tsitsipis, & Papageorgiou, 2010; Tekkaya &
Yenilmez, 2006;Venville & Oliver, 2015; for a comprehensive meta-analysis, seePeng, Wang, Wang, & Lin, 2019).
Exploring gender differences has been an important objective of several IR assessment studies, and as the impact of gender is routinely reported in most studies, a great deal of results is available. However,findings on gender differences have been inconsistent in different contexts. Some empirical studies have reported that a difference between males and females was found in reasoning abilities in favor of male students (Jeotee, 2012;Tekkaya & Yenilmez, 2006;Venville & Oliver, 2015). In contrast, a study byDíaz- Morales and Escribano (2013)revealed that girls performed better than boys on the IR test. More studies concluded that there was no significant difference statistically between boys and girls on reasoning tests (Jeotee, 2012;Kambeyo, 2018;Molnár, 2011;Tekkaya &
Yenilmez, 2006;Venville & Oliver, 2015). A recent meta-analysis of 98 studies based on data from 96,957 adults indicated a small effect favoring males on IR tests, with a large variability in the magnitude, and even direction, of the effect size (Waschl & Burns, 2020).
School grade levels or age groups also impact IR, as confirmed by empirical studies. The improvement of IR was significant, but growth rates were different. Across third grade (8–9-year-olds) to eleventh grade (16–17-year-olds), IR development in students tended to increase gradually, but the most rapid development was recorded in the 12–13-year-old age group (Csapó, 1997;Díaz- Morales & Escribano, 2013;Molnár & Csapó, 2011;Molnár et al., 2013). The other factors often examined in relation to inductive reasoning are motivation, learning orientation and parents’education level. Wang (2008)reported that there was a strong re- lationship between working memory and IR. Moreover, in certain social contexts, parents’education level did not significantly influence their children’s performance on an IR test (Kambeyo, 2018).
2.4. Context of the study
The national education system in Vietnam consists of four levels (Vietnam National Assembly, 2006). Educational levels and training degrees in the national education system are as follows: early childhood education with nursery and kindergarten; general education with primary education, lower secondary education and upper secondary education; professional education with pro- fessional secondary education and vocational training; and higher education with college undergraduate, master’s and doctoral courses. Within general education, primary education is compulsory for all children aged 6–10 years. Lower secondary education lasts four years (6th to 9th grades) for children aged 11–15 years, while students aged 15–18 years can enroll in upper secondary education.
Schools in Vietnam have focused on forming three major general competencies: autonomous and independent learning; com- munication and cooperation; and creativity and problem-solving (MOET, 2017). Although teachers are fully aware of the benefits of teaching to develop thinking skills, they regard it as extraneous to the requirements of testing, the criteria for teacher evaluation and the general expectations of many parents (Du, 2015). Consequently, teaching and learning in Vietnamese schools have been criticized for being exam-based such that the focus of teaching and learning aims to help students to pass the exams with high results rather than to apply knowledge in practice (Nhat et al., 2018). Assessment of IR provides more information about how teaching thinking skills can be integrated into subject-specific areas to develop general thinking skills, specifically IR, among students in Vietnamese educational contexts.
3. Research questions
The present study aims to evaluate the adapted instrument, investigate the development of IR and identify dominant factors affected by IR among individuals in school contexts. Therefore, the adapted test was employed to answer the following four research questions:
1) What is the evidence for the validity and reliability of the adapted instrument?
2) How do the IR capacities develop across school-aged groups?
3) Is there a significant difference between boys and girls on the inductive reasoning test?
4) Which factors contribute to individual inductive reasoning abilities among students?
4. Methods
4.1. Participants
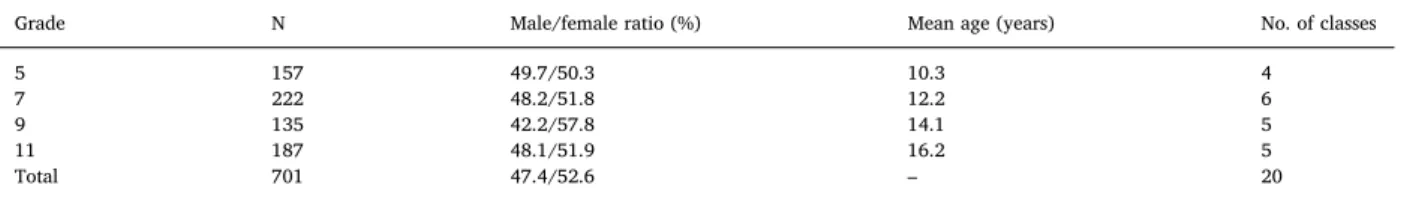
The samples were drawn from 701 students at public schools in Long Xuyen City (An Giang Province) in western Vietnam. The selected schools were representative of the level of the students in the area. We selected 20 classes randomly from six schools in total, and students in the whole class participated in this study.Table 1presents the properties of four cohorts in the research involving over 130 students for each grade group with the distribution of students by grade, including demographic characteristics. The study was conducted in August and September 2019. Students spent 45 min completing the test instrument under examination conditions.
We administered the test instrument as part of the regular school timetable. Two hundred and twenty-eight students took the online test in their school computer labs, while the rest of the students did the test in their regular classrooms in paper-and-pencil mode.
4.2. Instruments
4.2.1. Background questionnaire
The background questionnaire was composed of students’background, parents’level of education and parents’jobs. The ques- tionnaire was adapted from the student survey for PISA 2015 (OECD, 2016) and translated into Vietnamese. In this part, we added a self-report form section to collect data on students’school performance in the previous semester. The questionnaire part was em- bedded in the test in both paper-and-pencil and online formats.
4.2.2. Inductive reasoning test
Klauer and Phye (2008)pointed out that IR refers to discovering regularities byfinding similarities, dissimilarities or a combi- nation of both as regards attributes of or relations to or between objects. Based on this point, the IR tasks were composed of domain- general and non-verbal material. The item pool was developed by the Research Group on the Development of Competencies at the University of Szeged. The original items included four subtests in Hungarian translated into English and other languages. Several empirical studies were conducted with school-age populations to establish its reliability and predictive validity across cultures, such as in Hungary, Finland (Csapó, Hotulainen, Pásztor, & Molnár, 2019; Hotulainen, Pásztor, Kupiainen, Molnár, & Csapó, 2018;
Pásztor, Kupiainen, Hotulainen, Molnár, & Csapó, 2018), Namibia (Kambeyo, 2018), China (Wu & Molnár, 2018) and Indonesia (Saleh & Molnár, 2018).
The foundational criteria for selecting items were based on the structure of each item and evidence from previous studies. Firstly, we investigated the composition and the rules in each item because one item typically contains certain kinds of shapes or numbers.
We were concerned about the diversity of the items and avoided tasks which contained similar rules or constructions of the test. Then, we referenced the item difficulty from empirical studies. The test was expected to measure the appropriate abilities covering all students in the sample. Finally, the 32-item IR test was adapted and translated from English into Vietnamese, with a subtest consisting of eight items. A correct answer was assigned 1 point, and an incorrect answer was assigned 0 points for all the items.
The online test was developed within the Electronic Diagnostic Assessment System (eDia), a platform created by the Center for Research on Learning and Instruction at the University of Szeged (Csapó & Molnár, 2019). The eDia platform supports the entire item writing and test editing process as well as delivering tests and providing feedback. The eDia system is an easy-to-use diagnostic instrument containing item banks to support personalized teaching and learning in reading, mathematics and science. Students may access eDia using a standard Internet browser, such as Mozilla Firefox and Google Chrome, with the Information and communications technology infrastructure available at schools (desktop computers and mobile devices). Beyond its main function, the online platform may be used for sophisticated research tasks, such as logfile analysis (Greiff, Molnár, Martin, Zimmermann, & Csapó, 2018;Csapó &
Molnár, 2019).
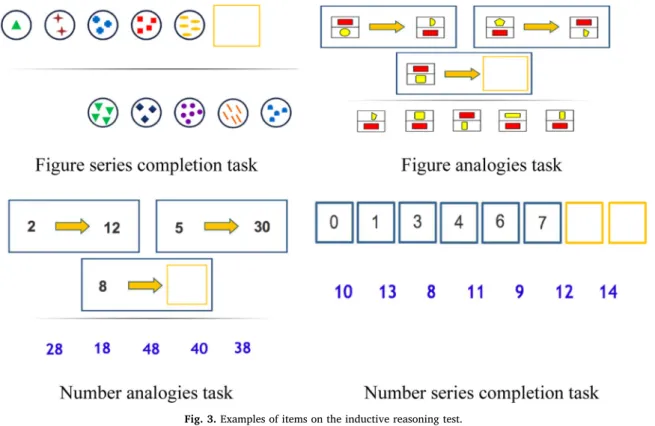
Fig. 3presents some examples of the IR tasks available on the eDia platform. The exact same layout was used in the paper-and- pencil version.
4.2.3. School performance
We considered school performance in the previous semester as an index of school achievement. The index was computed by the mean of eleven to thirteen school subjects, obtained from the elective and compulsory subjects. At the lower and upper secondary levels, it is scaled intofive levels, labeled excellent, good, fair, weak and poor. For primary students, school performance is divided into three levels: good, fair and weak. In the study, studentsfilled the self-report form for school grades as a part of the questionnaire Table 1
The study sample.
Grade N Male/female ratio (%) Mean age (years) No. of classes
5 157 49.7/50.3 10.3 4
7 222 48.2/51.8 12.2 6
9 135 42.2/57.8 14.1 5
11 187 48.1/51.9 16.2 5
Total 701 47.4/52.6 – 20
section.
The instruments were reviewed by two experts and three secondary school teachers. We implemented thefinal version of the test instrument as a pilot study with ten students in two different schools. These students had similar traits with our proposed study sample. Then, each of the items in the pilot study was discussed and modified again before the data collection for the main study took place.
4.3. Procedures
The online tests were delivered from University of Szeged servers. The participating students completed the test in their school computer labs. The paper-based tests were administered in the students’classrooms under the supervision of teachers and teaching assistants.
The analyses were performed with the ACER ConQuest program package (Adams & August, 2010) and R software version 3.5.3 (R Core Team, 2019) with common packages such as psych, yarrr and ggplot2.
5. Results
5.1. Scaling of inductive reasoning items
We analyzed data with a program based on the Rasch model in a one-parameter logistic model for dichotomous items. This is a psychometric model in which the probability that a person successfully completes an item is predicted from an additive relationship between the person’s ability level on a continuum describing a latent trait and the item’s difficulty level on the same continuum. It was applied to a“logit”scale to express item difficulty on a linear scale. In principle, this scale may widen from negative infinity to positive infinity. ACER ConQuest software was utilized to analyze the data with maximum likelihood estimation (MLE) output as values for the parameters of the Rasch model in the study.
We prepared a Wright map to evaluate the strengths and weaknesses of the test. A Wright map shows item difficulties expressed using the same linear scale and expressing a student’s performance. In the case of the test, the map supports researchers in evaluating how well the test items define a variable and compare the predicted order of item difficulty with the actual order of item difficulty in a data set. With this comparison, researchers can evaluate how the test matches theoretical predictions.
5.2. Test score reliability
Item internal consistency reliability estimates were calculated using R software with the psych package (Revelle, 2019).
Fig. 3.Examples of items on the inductive reasoning test.
Cronbach’s alpha values were calculated for the subtests and the whole test. The number series completion task achieved the highest alpha value of .81, and the lowest alpha coefficient, .69, was found for the number analogies. Cronbach’s alpha was .88 for the whole test. No items were deleted to increase the reliability of the test. All the items appeared to be worth retaining. In general, the Cronbach’s alpha in the adapted test indicated an acceptable level of internal consistency reliability.
5.3. Validity of the inductive reasoning test 5.3.1. Confirmatory factor analysis
Confirmatory factor analysis (CFA) is considered one of the best tools to evaluate the construct validity and reliability of the adapted instruments. We utilized CFA to evaluate the construct validity of the adapted IR test with the unidimensional construct as a criterion for further analysis with the Rasch model. A single-group CFA was conducted to assess thefit of the model using the root mean square error of approximation (RMSEA), comparativefit index (CFI) and standardized root mean square residual (SRMR). Fit indices refer to a measure of how well the rotated matrix matches the original matrix. It involves goodness offit statistics (e.g. CFI), which require large values, and compares the reproduced correlation matrix to the real correlation matrix; it also involves residual statistics (e.g. RMSEA, SRMR), for which small values are expected in the residual matrix. Therefore, the following cut-offcriterion values were used to assess modelfit: RMSEA < .06, CFI > .90 and SRMR < .08 (Hu & Bentler, 1999). The results showed that the model was a goodfit to the values for the cut-offcriteria: CFI = .902, RMSEA = .038 CI (.034, .041) and SRMR = .046. As expected, the indicators all showed significant positive factor loadings with a significant level. Overall, the modelfit was at an acceptable level but not excellent, since the results for the indices were a goodfit for the cut-offcriteria.
5.3.2. Rasch analysis
We analyzed the data with item response modeling to investigate whether the IR test can measure students’IR across school grades. The results of the Rasch analysis on the item level indicated a goodfit model with thefit for single items (weighted mean squares, MNSQ) ranging from 0.84 to 1.22 (M = 0.98, SD = 0.09). The average item difficulty wasfixed on 0 logits (SD = 1.0), representing the zero point of the scale, while the item difficulties ranged from -1.79 to 2.29. The quality of items on the test is good, as the discrimination values for most of the items are higher than 0.3 (for 31 out of 32 items) (Ebel & Frisbie, 1991). The relation between the average item difficulty of 0 logits and the average person proficiency of 1.08 logits on the MLE scale implied that students’proficiency in IR was higher than the average item difficulty. Overall, participants successfully completed 66.6 % of the IR items (21.3 out of 32 items) on average. The psychometric properties of the items ordered from most difficult to least difficult are summarized in Appendix A.
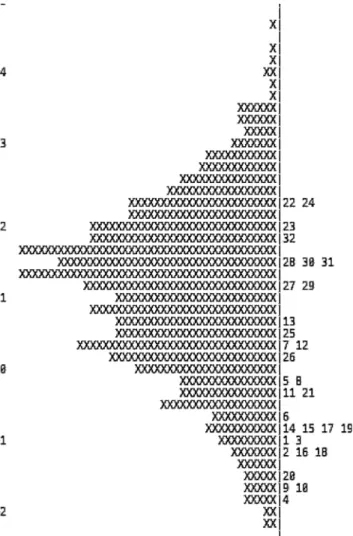
The Wright person-item map depicted inFig. 1shows the level of ability of students on the left-hand side and the difficulty of the items on the right. This item-person map describes the distribution of item difficulty estimates and person ability estimates on one scale, making it possible to compare items and persons directly within the context of the study and judge if the difficulty of the items was appropriate for the actual participants. If a student is located at the same level as an item, this suggests that that student has a 50
% chance of responding to that item correctly (p = .5). If the student is plotted higher than the item, then the chances of success increase (p > .5) and will continue to increase as the distance between the person and the item widens. Similarly, if the item is placed higher than the student, the student will not be likely to succeed; indeed, the chances of success decrease if the distance between the item and the person increases (Griffin, 2010). The distance of the item from the top of the ruler correlates to its difficulty relative to the other items. In this study, the most difficult items (22 and 24) are shown at the top on the right of the y-axis. Item 4 is the easiest since it stands at the bottom of the right-hand side of the map.
A general pattern of item difficulty can clearly be seen within the abilities of the test-taking population inFig. 4. The item-person map summarizing the test performance of the sample confirms that many of the test-takers are quite beyond the higher limit of the test. Item 4 is too easy and falls outside the abilities of the students. According toGriffin (2010), good items have to cover all the areas on the ruler when measuring the ability spectrum of all students.
All in all, despite the existence of a little misfit for items, this test appears to have performed well as a measurement instrument.
The test is appropriate for the assessment of IR for the study sample. The items selected for this study did cover most of the persons on the scale, so it appears that the test is well-targeted for this group of test-takers.
5.4. Correlations between subtests
Table 2presents the correlation matrix for the subtests. The correlations of pairs of tasks were significantly high and identical. The pairs of variables (figure series completion andfigure analogies, r = .55) had a higher correlation than others. The correlations between thefigure series completion, on the one hand, and the number analogies and number series completion tasks, on the other, had the same rate of .42, with other pairs indicating high correlations, ranging from .47 to .53. This implied that students who performed well on the subtest were likely to achieve high scores on other subtests on the IR test.
5.5. Differences among school grade cohorts
The second aim of this study was to investigate the effects of school grade groups on students’performance on the IR test. We composed pirate plots to visualize the distribution of achievements among students in the study. A pirate plot can easily show raw data, descriptive statistics and inferential statistics in one plot. These pirate plots for each group included a box plot with the mean,
95 % shaded highest density intervals (HDIs), the jittered individual data points and symmetric kernel densities. They provided more information than regular bar plots and box plots (Phillips, 2016,2017).Fig. 5depicts students’latent abilities on the IR test across school grade cohorts. Because the intervals among the sample did not overlap, we can confidently conclude that students’mean abilities on the test showed a remarkable improvement across cohorts. In the 5th-grade group, there was a combination of a number of students who received a very low score and the smallest number of students who achieved a high score. On average, the 5th graders yielded a score of 0.24 logits (MLE scale). The mean scores in the 7th- and 9th-grade groups were around 0.92, but their distribution of scores showed a different pattern. The 7th-grade cohort had both the highest- and lowest-performing participants. It appeared that there was an equivalent proportion of students who achieved higher mean scores and lower scores in this group. In the 9th-grade group, the number of students achieving a higher mean score (M = 1.25) was larger than that of those who received a lower mean score. Among the 11th graders, the average mean remained at about 1.86, but there were still some students receiving under 0. The distribution is spread out and has its highest density because of the higher rate of students of high ability.
In the study, we plotted the smooth curve to present the trend in students’performance on the IR test across grade groups (with the ggplot2 package, seeWickham, 2016).Fig. 6illustrates the change of students’IR from the 5th to 11th grades. In general, students’achievement on the IR test grew gradually throughout the grade level groups. The strongest growth occurred from the 5th to
Fig. 4.Wright map of persons and items for the unidimensional model (each‘X’represents 1.1 cases).
Table 2
Correlation matrix for the subtests on the inductive reasoning test (N = 701).
Figure series completion Figure analogies Number analogies
Figure analogies .55
Number analogies .42 .53
Number series completion .42 .50 .47
Note: p < .001 for all coefficients.
7th grades, and the trend slowed down during the end of lower secondary education (9th grade). The growth rate tended to speed up again at the beginning of upper secondary education but at a lower rate.
As regards children’s reasoning proficiency on each subtest, students achieved different proficiency on different kinds of subtests.
Students’latent abilities were lowest on the number series completion subtest (M = 0.3, SD = 1.9) and highest on thefigure analogies subtest (M = 2.0, SD = 1.6), followed by thefigure series completion (M = 1.5, SD = 1.5) and the number analogies (M = 0.5, SD = 1.6) subtests.
The smooth curves inFig. 6depict four different subtests that students exhibited throughout the age group cohorts. Overall, there was different achievement among students on the different tasks across school grades. It is easy to recognize that students performed better on the subtests constructed withfigures, such as thefigure series completion andfigure analogies subtests. Participants showed the highest proficiency levels on thefigure analogies (FA) task, followed by thefigure series completion (FS) task throughout the sample cohorts. The results of test-takers on the number analogies (AN) task showed a different pattern, since itfluctuated from the
Fig. 5.Differences in the performance of age groups on the inductive reasoning test.
Fig. 6.Development of reasoning across school age groups on the test and tasks.
Note: IR: inductive reasoning test; FS:figure series completion task; FS:figure analogies task; AN: number analogies task; NS: number series completion task.
7th to the 9th grades. The 7th-grade students achieved very high, even higher than the 9th graders did, on the AN subtest. In contrast, there was a linear increase in the students’performance on the NS task from just under -1.0 in the 5th grade to around 1.0 in the 11th grade. Student achievement on the NS task seemed to strongly depend on school grade level on the NS task.
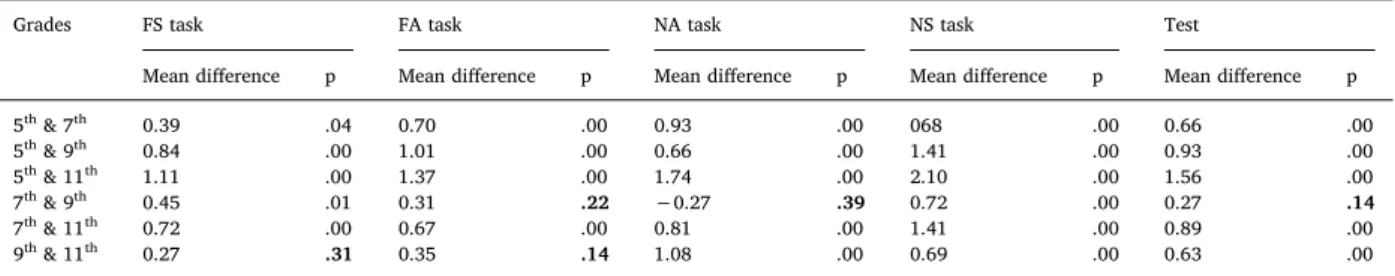
Furthermore, the ANOVA analysis was conducted to compare the effect of school grade groups on students’proficiency on the subtests and the test. The results revealed significant differences among the school grade groups, which were confirmed on subtests and the test scores for students across four cohorts with the FS subtest [F(3, 697) = 20.78, p < .01], FA subtest [F(3, 697) = 25.61, p < .01], NA subtest [F(3, 697) = 36.83, p < .01], NS subtest [F(3, 697) = 44.63, p < .01] and entire test [F (3, 697) = 51.76, p < .01]. To identify whether there were significant differences in pairs of grades on the test and subtests, Tukey’s honestly sig- nificant difference (Tukey’s HSD) analysis was performed, with the results shown inTable 3.
For the whole test, a significant difference was investigated for all pairs of school grade groups on the IR test, except for a pair in the 7th and 9th grades. As regards the subtests, the older students performed significantly better than the younger students on the NS subtest. This also happened on the NA subtest, except for a 7th- and 9th-grade pair, where the 7th graders achieved a higher mean score than the 9th graders did. The general trend in students’performance on the FS subtest and the FA subtest was similar across school grade levels. However, students in the 9th and 11th grades did not achieve significantly on the FS task, while the school grade difference was not found on the FA task in two pairs, one 7th- and 9th-grade pair and another 9th- and 11th-grade pair. Overall, the results indicated that the students from the higher grades tended to perform significantly better on the numerical tasks than the younger students did, but students achieved a higher score on thefigural tasks than they did on the numerical tasks.
5.6. Gender differences in inductive reasoning
The general trend was that males and females showed equivalent proficiency in each cohort (Fig. 7). The mean scores stayed at around 0.2 and 1.0 for the 5th grade and 7th grade, respectively. In the 9th grade and 11th grade, the average score among males and females was at a similar level, but these distributions displayed different patterns. In comparison with girls in the 9th grade, the larger part of the density of the male sample shifted toward both the minimum and maximum scores. This demonstrated that the standard Table 3
Tukey’s multiple comparisons.
Grades FS task FA task NA task NS task Test
Mean difference p Mean difference p Mean difference p Mean difference p Mean difference p
5th& 7th 0.39 .04 0.70 .00 0.93 .00 068 .00 0.66 .00
5th& 9th 0.84 .00 1.01 .00 0.66 .00 1.41 .00 0.93 .00
5th& 11th 1.11 .00 1.37 .00 1.74 .00 2.10 .00 1.56 .00
7th& 9th 0.45 .01 0.31 .22 −0.27 .39 0.72 .00 0.27 .14
7th& 11th 0.72 .00 0.67 .00 0.81 .00 1.41 .00 0.89 .00
9th& 11th 0.27 .31 0.35 .14 1.08 .00 0.69 .00 0.63 .00
Fig. 7.Comparing performance among males and females.
deviation was larger in the male cohort. In contrast, male students in the 11th grade had a smaller standard deviation than the females.
We applied thet-test to compare abilities between males and females based on the maximum likelihood estimate of the students’ latent ability.Table 4presented the results of the analysis of thet-test for four cohorts and the whole sample. No significant difference was found on the IR test between boys and girls in the whole sample and in each cohort (p > .05). This also suggested that students’
abilities in each cohort did not differ significantly on the IR test for both boys and girls. In other words, it was estimated that males and females had an equivalent ability level on the IR test.
Furthermore, no gender difference was found for the subtests.Table 5provides evidence that all p-values were larger than .05. In other words, gender had no significant impact on performance among students on the subtests. However, it is surprising that male students achieved a slightly higher mean score than female students on tasks withfigural material, but this was not found on tasks with numerical material, where female students achieved a higher mean score than male students. Standard deviations for the males’
abilities appeared somewhat higher than those of the females.
5.7. Predicting inductive reasoning performance
Stepwise multiple regression was used to explore how the latent factors predicted IR ability in individuals.Table 6showed the results of a stepwise multiple regression analysis. School grade group, school performance in the previous semester and parents’ educational level significantly explained 32.0 % of the variance on the IR test, F (680) = 79.0, p < .001.
School performance in the previous semester was the best predictor with standardized beta regression coefficients of .65 each, followed by school grade groups with .33 each. Parents’educational level significantly affected IR ability in children. Specifically, the effect of educational level among students’fathers on IR outweighed that of their mothers’education in the study sample.
6. Discussion and conclusion
The results indicated that the adapted version of the IR test is reliable for measuring reasoning in school age groups in the 5th, 7th, 9th and 11th grades. This means that the same IR test may be used in a broad age range, similarly to previous paper-based IR tests. For example, in a cross-sectional assessment,Csapó (1997)used the same version of an IR test from the 3rd grade to the 11th grade. Technology-based testing offers several solutions to cover an even broader competency range, either by using adaptive testing or by anchoring tests composed of items with different difficulty levels (e.g.Molnár & Csapó, 2011). The average person proficiency in IR was higher than the average item difficulty. Thisfinding demonstrated that participants completed most of the items correctly.
The item-person map shows that the construction of the inductive reasoning test needs to be improved to measure students’per- formance at the higher end of the proficiency continuum. The present study demonstrates that the test, comprisingfigural and numerical material, was a reliable tool to assess IR. Students tended to achieve a better performance with high scores on items with figural material than items with numerical material. Thesefindings correspond with that of the study conducted by (Roberts, et al., 2000).
As regards gender, no statistically significant difference was found in IR. Boys and girls showed no significant difference in their performance for each grade and even for the whole study sample. These results were in line with previous studies in Namibia (Kambeyo, 2018) and Spain (Díaz-Morales & Escribano, 2013), although males achieved a slightly higher mean score compared to females, in agreement with the general conclusion of the meta-analysis performed byWaschl and Burns (2020).
Table 4
Thet-test to compare inductive reasoning test results between males and females.
Male Female
Grade N Mean (SD) N Mean (SD) t p
5 78 0.27 (1.14) 79 0.22 (1.24) 0.27 .791
7 107 0.96 (1.27) 115 0.88 (1.26) 0.51 .610
9 57 1.33 (1.64) 78 1.19 (1.13) 0.57 .572
11 90 1.83 (0.88) 97 1.88 (1.23) −0.34 .731
All 332 1.09 (1.35) 369 1.07 (1.35) 0.31 .754
Table 5
Thet-test to compare latent abilities between males and females on each subtest.
Male Female
Subtest Mean (SD) Mean (SD) t p
Figure series completion 1.82 (1.43) 1.71 (1.48) 1.05 .292
Figure analogies 1.84 (1.64) 1.78 (1.48) 0.49 .621
Number analogies 0.87 (1.68) 0.84 (1.67) 0.20 .840
Number series completion −0.08 (1.88) −0.07 (2.01) −0.11 .915
In terms of age group results, IR performance increased across school grade cohorts. Thefindings presented in this study are seemingly consistent with thefindings ofCsapó (1997),Csapó et al. (2019),Díaz-Morales and Escribano (2013),Molnár and Csapó (2011), andMolnár et al. (2013). A series of these measurements concluded that the development of IR was significant across grade levels. The fastest development happened between the age group of 12 years and 14 years or during the middle school educational level, but the acceleration of improvement seemed to slow down after 14 years.
Thesefindings have contributed to an increased understanding of latent factors predicting the IR ability of children. Learning in the disciplines mirrored in the school performance in the previous semester prominently enhanced IR. Along with the age group factor, parents’education level impacts appreciably on individuals in terms of IR. Students’IR proficiency is especially affected by the educational levels of their fathers. The results are inconsistent with the outcome of the previous study, in which mothers’educational level had a stronger impact than that of the fathers (Csapó, 2001) or parents’educational level had no influence on students’
achievement on the IR test at all (Kambeyo, 2018). These differences in the impact of parents’education may be attributed to cultural differences and to the different impact of the socio-economic status of the families, as is routinely reported in the PISA surveys. In the PISA 2015 assessment, Vietnam was among those countries where the impact of students’socio-economic status on performance was the lowest (OECD, 2016).
The national core curricula in Vietnam would consider developing students’thinking skills embedded in the learning of disciplines without any explicit IR training programs in this age range. The study has provided evidence that students’IR can be assessed and their development can be monitored. This possibility also paves the way for estimating the impact of the teaching and learning activities of the current core curriculum on IR and assessing the effect of any curricular change in the future, as is the existing practice in some countries (Vainikainen, 2014).
The results of the present study also show the age range when IR develops the most rapidly, between 12 and 14 years, suggesting that this is the most effective time to enhance IR. Thus, teachers should be aware of this opportunity and actively search for means to boost students’reasoning skills during those years through their school subjects.
There are some limitations regarding the measures in the current study as well. We used four kinds of non-verbal tasks to measure IR without covering the full scope of reasoning proficiency. Tests withfigural content are easy to translate from one language to another and adapt to a different culture. However, IR in the verbal context also plays a significant role in many learning tasks, and this study cannot deal with such issues.
This study was also limited by the fact that the sample was drawn from a small population in An Giang Province, Vietnam. Some of the results of the study cannot be generalized to other educational contexts. Large-scale assessments of reasoning should be undertaken to evaluate the success of curricula in school practice. Future research needs to validate the possible relationships between reasoning, academic success and relevant cultural factors.
Our study was thefirst major assessment of a general cognitive skill with an online instrument. The success of this assessment may encourage the assessment of general cognitive skills as well as the use of computers for assessment purposes. The successful adap- tation of a cognitive test may inspire other researchers to adapt other instruments as well.
Funding
The authors received funding from the University of Szeged Open Access Fund. Grant number: 4873.
Intellectual property
We confirm that we have given due consideration to the protection of intellectual property associated with this work and that there are no impediments to publication, including the timing of publication, with respect to intellectual property. In so doing we confirm that we have followed the regulations of our institutions concerning intellectual property.
Research ethics
We further confirm that any aspect of the work covered in this manuscript has been conducted with the ethical approval of all Table 6
Hierarchical regression summary for prediction of inductive reasoning (N = 701), R2= .32, adjusted R2= .31.
Model M1 M2 M3 M4
Predictor β β β β
School grade .26*** .31*** .33*** .33***
School performance .76*** .69*** .65***
Mother’s education .17*** .11*
Father’s education .14**
Note:ΔR2= .18 for M1,ΔR2= .11 for M2,ΔR2= .02 for M3,ΔR2= .01 for M4;
* p < .05.
** p < .01.
*** p < .001.
relevant bodies and that such approvals are acknowledged within the manuscript.
IRB approval was obtained.
Authorship
All listed authors meet the ICMJE criteria. We attest that all authors contributed significantly to the creation of this manuscript, each having fulfilled criteria as established by the ICMJE.
Contact with the editorial office
This author submitted this manuscript using his/her account in editorial submission system.
Declaration of Competing Interest
No conflict of interest exists.
Acknowledgment
The authors are thankful to the student participants and the teachers who assisted with the assessments in the secondary schools.
The Center for Research on Learning and Instruction at the University of Szeged supported the development of the Vietnamese- language version of the inductive reasoning test and its online administration to the Vietnamese students via the eDia platform. This work was supported by the University of Szeged Open Access Fund. Grant number: 4873.
Appendix A. The properties for the Rasch model
Item Subtest Correct answer (%) Difficulty Discrimination Infit MNSQ
4 FS 90.71 −1.794 0.45 0.89
9 FA 90.00 −1.686 0.43 0.94
10 FA 89.14 −1.576 0.42 0.94
20 NA 88.14 −1.461 0.48 0.93
16 FA 85.71 −1.201 0.53 0.86
18 NA 84.86 −1.120 0.54 0.84
2 FS 84.41 −1.097 0.44 0.98
1 FS 83.98 −1.058 0.47 0.96
3 FS 83.71 −1.032 0.51 0.87
14 FA 82.29 −0.891 0.49 0.96
17 NA 81.86 −0.856 0.44 0.98
19 NA 81.29 −0.811 0.53 0.92
15 FA 80.86 −0.774 0.56 0.87
6 FS 78.57 −0.609 0.39 1.07
11 FA 75.29 −0.369 0.52 0.98
21 NA 73.86 −0.277 0.55 0.92
8 FS 73.00 −0.222 0.43 1.04
5 FS 71.71 −0.144 0.42 1.07
26 NS 66.14 0.190 0.55 0.91
7 FS 64.29 0.299 0.35 1.15
12 FA 64.14 0.312 0.46 1.05
25 NS 61.00 0.479 0.50 0.99
13 FA 57.54 0.702 0.41 1.11
27 NS 49.86 1.066 0.56 0.87
29 NS 48.43 1.138 0.51 0.99
30 NS 42.43 1.451 0.52 0.94
28 NS 42.29 1.459 0.53 0.93
31 NS 41.14 1.518 0.52 0.93
32 NS 36.14 1.788 0.48 0.98
23 NA 32.43 2.002 0.32 1.14
22 NA 27.71 2.284 0.33 1.14
24 NA 27.57 2.290 0.22 1.22
Note: FS:figure series completion; FS:figure analogies; NA: number analogies; NS: number series completion.
References
Adams, R., & August, M. W. (2010).Modelling a dichotomously scored multiple choice test with the Rasch model.ConQuest.
Adey, P., & Csapó, B. (2012). Developing and assessing scientific reasoning. In B. Csapó, & G. Szabó (Eds.).Framework for diagnostic assessment of science(pp. 17–53).
Budapest: Nemzeti Tankönyvkiadó.
Ariës, R. J., Ghysels, J., Groot, W., & Van Den Brink, H. M. (2016). Combined working memory capacity and reasoning strategy training improves reasoning skills in secondary social studies education: Evidence from an experimental study.Thinking Skills and Creativity, 22, 233–246.https://doi.org/10.1016/j.tsc.2016.10.008.
Binkley, M., Erstad, O., Herman, J., Raizen, S., Ripley, M., Miller-Ricci, M., et al. (2012).Defining twenty-first century skills. Assessment and teaching of 21st century skills.
Dordrecht: Springer17–66.https://doi.org/10.1007/978-94-007-2324-5_2.
Chu, S. K. W., Reynolds, R. B., Tavares, N. J., Notari, M., & Lee, C. W. Y. (2017).Twenty-first century skills and global education roadmaps. 21st century skills development through inquiry-based learning. Singapore: Springer17–32.https://doi.org/10.1007/978-981-10-2481-8_2.
Csapó, B. (1997). The development of inductive reasoning: Cross-sectional assessments in an educational context.International Journal of Behavioral Development, 20(4), 609–626.https://doi.org/10.1080/016502597385081.
Csapó, B. (2001). Az induktív gondolkodás fejlődésének elemzése országos reprezentatív felmérés alapján [An analysis of the development of inductive reasoning on the basis of a large-scale survey].Magyar Pedagógia, 101(3), 373–391.
Csapó, B., & Molnár, G. (2019). Online diagnostic assessment in support of personalized teaching and learning: The eDia System.Frontiers in Psychology, 10, 1522.
https://doi.org/10.3389/fpsyg.2019.01522.
Csapó, B., Hotulainen, R., Pásztor, A., & Molnár, G. (2019). Az induktív gondolkodás fejlődésének összehasonlító vizsgálata: online felmérések Magyarországon és Finnországban [A comparative study of the development of inductive eeasoning: Online assessments in Hungary and Finland].Neveléstudomány, 7(3–4), 5–24.
Csapó, B., Molnár, G., & Tóth, R. K. (2009). Comparing paper-and-pencil and online assessment of reasoning skills. A pilot study for introducing electronic testing in large-scale assessment in Hungary. In F. Scheuermann, & J. Björnsson (Eds.).The transition to computer-based assessment. New approaches to skills assessment and implications for large-scale testing(pp. 120–125). Luxemburg: Office for Official Publications of the European Communities.
Csapó, B., Molnár, G., & Nagy, J. (2014). Computer-based assessment of school readiness and early reasoning.Journal of Educational Psychology, 106(2), 639–650.
https://doi.org/10.1037/a0035756.
Díaz-Morales, J. F., & Escribano, C. (2013). Predicting school achievement: The role of inductive reasoning, sleep length and morningness-eveningness.Personality and Individual Differences, 55(2), 106–111.https://doi.org/10.1016/j.paid.2013.02.011.
Du, N. N. (2015).Factors influencing teaching for critical thinking in Vietnamese lower secondary schools: A mixed method study focussed on history(Unpublished doctoral dissertation)Newcastle University.
Ebel, R. L., & Frisbie, D. A. (1991). Essentials of educational measurement.Journal of School Psychology, 11Engelwood Cliffs, New Jersey, USA: Prentice-Hall.
Greiff, S., Molnár, G., Martin, R., Zimmermann, J., & Csapó, B. (2018). Students’exploration strategies in computer-simulated complex problem environments: A latent class approach.Computers & Education, 126, 248–263.https://doi.org/10.1016/j.compedu.2018.07.013.
Griffin, P. (2010).Item response modelling: An introduction to the Rasch model.Melbourne: Assessment Research Centre Faculty of Education, The University of Melbourne.
Hamers, J. H. M., De Koning, E., & Sijtsma, K. (1998). Inductive reasoning in third grade: Intervention promises and constraints.Contemporary Educational Psychology, 23(2), 132–148.https://doi.org/10.1006/ceps.1998.0966.
Hotulainen, R., Pásztor, A., Kupiainen, S., Molnár, G., & Csapó, B. (2018). Entering school with equal skills? A two-country comparison of early inductive reasoning.
AugustPaper presented at the 9th biennial conference of EARLI SIG 1: assessment and evaluation: assessment & learning analytics. Paper: C_2_3.
Hu, L. T., & Bentler, P. M. (1999). Cutoffcriteria forfit indexes in covariance structure analysis: Conventional criteria versus new alternatives.Structural Equation Modeling, 6(1), 1–55.https://doi.org/10.1080/10705519909540118.
Ifenthaler, D., & Seel, N. M. (2011). A longitudinal perspective on inductive reasoning tasks. Illuminating the probability of change.Learning and Instruction, 21(4), 538–549.https://doi.org/10.1016/j.learninstruc.2010.08.004.
Jeotee, K. (2012).Reasoning skills, problem solving ability and academic ability: Implications for study programme and career choice in the context of higher education in Thailand(Unpublished doctoral dissertation) Retrieved fromDurham Universityhttp://etheses.dur.ac.uk/3380.
Kambeyo, L. (2018).Assessing Namibian students’abilities in scientific reasoning, scientific inquiry and inductive reasoning skills(Unpublished doctoral dissertation) University of Szeged.
Kinshuk, Lin, T., & Mcnab, P. (2006). Cognitive trait modelling: The case of inductive reasoning ability.Innovations in Education and Teaching International, 43(2), 151–161.https://doi.org/10.1080/14703290600650442.
Klauer, K. J. (1989). Teaching for analogical transfer as a means of improving problem-solving, thinking and learning.Instructional Science, 18(3), 179–192.
Klauer, K. J. (1996). Teaching inductive reasoning: Some theory and three experimental studies.Learning and Instruction, 6(1), 37–57.https://doi.org/10.1016/s0959- 4752(96)80003-x.
Klauer, K. J., & Phye, G. D. (2008). Inductive reasoning: A training approach.Review of Educational Research, 78(1), 85–123.https://doi.org/10.3102/
0034654307313402.
Leighton, J. P., & Sternberg, R. J. (2004).The nature of reasoning. The nature of reasoning. Cambridge: Cambridge University Press3–11.https://doi.org/10.1161/
CIRCRESAHA.116.305012.
Mayer, D., Sodian, B., Koerber, S., & Schwippert, K. (2014). Scientific reasoning in elementary school children: Assessment and relations with cognitive abilities.
Learning and Instruction, 29, 43–55.https://doi.org/10.1016/j.learninstruc.2013.07.005.
Mehraj, A. B. (2016). The predictive power of reasoning ability on academic achievement.International Journal of Learning Teaching and Educational Research, 15(1), 79–88.
MOET (2017).Chương trình giáo dục tổng thể[General education program].Hanoi.
Mollohan, K. N. (2015).Epistemologies and scientific reasoning skills among undergraduate science students.The Ohio State University.
Molnár, G. (2011). Playful fostering of 6- to 8-year-old students’inductive reasoning.Thinking Skills and Creativity, 6(2011), 91–99.https://doi.org/10.1016/j.tsc.
2011.05.002.
Molnár, G., & Csapó, B. (2011). Az 1–11 évfolyamot átfogó induktív gondolkodás kompetenciaskála készítése a valószínűségi tesztelmélet alkalmazásával [Constructing inductive reasoning competency scales for years 1–11 using IRT models].Magyar Pedagógia, 111(2), 127–140.
Molnár, G., Greiff, S., & Csapó, B. (2013). Inductive reasoning, domain specific and complex problem solving: Relations and development.Thinking Skills and Creativity, 9, 35–45.https://doi.org/10.1016/j.tsc.2013.03.002.
Nhat, H. T., Lien, N. T., Tinh, N. T., Vu, N., Hang, T., & Trang, N. T. (2018). The development of critical thinking for students in Vietnamese schools: From policies to practices.American Journal of Educational Research, 6(5), 431–435.https://doi.org/10.12691/education-6-5-10.
Nikolov, M., & Csapó, B. (2018). The relationships between 8th graders’L1 and L2 reading skills, inductive reasoning and socio-economic status in early English and German as a foreign language programs.System, 73, 48–57.https://doi.org/10.1016/j.system.2017.11.001.
OECD (2016).PISA 2015 results (Volume I): Excellence and equity in education.Paris: OECD Publishinghttps://doi.org/10.1787/9789264266490-en.
Pásztor, A., Kupiainen, S., Hotulainen, R., Molnár, G., & Csapó, B. (2018). Comparing Finnish and Hungarian fourth grade students’inductive reasoning skills. August Paper presented at the 9th biennial conference of EARLI SIG 1: Assessment and evaluation: assessment & learning analytics. Paper: A_1_3.
Peng, P., Wang, T., Wang, C., & Lin, X. (2019). A meta-analysis on the relation betweenfluid intelligence and reading/mathematics: Effects of tasks, age, and social economics status.Psychological Bulletin, 145(2), 189.https://doi.org/10.1037/bul0000182.
Perret, P. (2015). Children’s inductive reasoning: Developmental and educational perspectives.Journal of Cognitive Education and Psychology, 14(3), 389–408.
Phillips, N. (2016).Yarrr ! The pirate’s guide to R.http://www.thepiratesguidetor.com.
Phillips, N. (2017).Yarrr: A companion to the e-Book "YaRrr!: The pirate’s guide to R.Retrieved fromwww.thepiratesguidetor.com.
R Core Team (2019).R: A language and environment for statistical computing.Retrieved fromVienna, Austria: R Foundation for Statistical Computing.https://www.r-
project.org/.
Raven, J. (2003). Raven progressive matrices. In R. S. McCallum (Ed.).Handbook of nonverbal assessment(pp. 223–237). Boston, MA: Springer.
Revelle, W. (2019).Psych: Procedures for psychological, psychometric, and personality research.Retrieved fromEvanston, Illinois: Northwestern University.https://cran.r- project.org/package=psych.
Roberts, M. J., Welfare, H., Livermore IV, D. P., & Theadom, A. M. (2000). Context, visual salience, and inductive reasoning.Thinking & reasoning, 6(4), 349–374.
https://doi.org/10.1080/135467800750038175.
Saleh, A. R., & Molnár, G. (2018). Inductive reasoning through the grades: Case of Indonesia. In L. G. Chova, A. L. Martínez, & I. C. Torres (Eds.).EDULEARN18 proceedings: 10th international conference on education and new learning technologies(pp. 8790–8793)..
Schweizer, F., Wüstenberg, S., & Greiff, S. (2013). Validity of the MicroDYN approach: Complex problem solving predicts school grades beyond working memory capacity.Learning and Individual Differences, 24, 42–52.https://doi.org/10.1016/j.lindif.2012.12.011.
Stamovlasis, D., Tsitsipis, G., & Papageorgiou, G. (2010). The effect of three cognitive variables on students’understanding of the particulate nature of matter and its changes of state.International Journal of Science Education, 32(08), 987–1016.https://doi.org/10.1080/09500690902893605.
Sternberg, R. J. (1986). Toward a unified theory of human reasoning.Intelligence, 10, 281–314.https://doi.org/10.1016/0160-2896(86)90001-2.
Sternberg, R. J., & Sternberg, K. (2012).Cognitive psychology(6th ed.). Belmont CA: Wadsworth Cengage.
Stevenson, C. E., Hickendorff, M., Resing, W. C., Heiser, W. J., & de Boeck, P. A. (2013). Explanatory item response modeling of children’s change on a dynamic test of analogical reasoning.Intelligence, 41(3), 157–168.https://doi.org/10.1016/j.intell.2013.01.003.
Strobel, A., Behnke, A., Gärtner, A., & Strobel, A. (2019). The interplay of intelligence and need for cognition in predicting school grades: A retrospective study.
Personality and Individual Differences, 144(July 2018), 147–152.https://doi.org/10.1016/j.paid.2019.02.041.
Tekkaya, C., & Yenilmez, A. (2006). Relationships among measures of learning orientation, reasoning ability, and conceptual understanding of photosynthesis and respiration in plants for grade 8 males and females.Journal of Elementary Science Education, 18(1), 1–14.
Tunteler, E., Pronk, C. M. E., & Resing, W. C. M. (2008). Inter- and intra-individual variability in the process of change in the use of analogical strategies to solve geometric tasks in children: A microgenetic analysis.Learning and Individual Differences, 18(1), 44–60.https://doi.org/10.1016/j.lindif.2007.07.007.
Tzuriel, D., & George, T. (2009). Improvement of analogical reasoning and academic achievement by the Analogical Reasoning Programme (ARP).Educational and Child Psychology, 26(3), 71.
Vainikainen, M. P. (2014). Finnish primary school pupils’performance in learning to learn assessments: A longitudinal perspective on educational equity.Research Reports 360.https://helda.helsinki.fi/handle/10138/136364.
Venville, G., & Oliver, M. (2015). The impact of a cognitive acceleration programme in science on students in an academically selective high school.Thinking Skills and Creativity, 15, 48–60.https://doi.org/10.1016/j.tsc.2014.11.004.
Vietnam National Assembly (2006).Luật Giáo dục 2005 [Education Law 2005].Hanoi: The Publication of Labour and Society.
Vogelaar, B., Sweijen, S. W., & Resing, W. (2019). Gifted and average-ability children’s potential for solving analogy items.Journal of Intelligence, 7(3), 19.https://doi.
org/10.3390/jintelligence7030019.
Voogt, J., & Roblin, N. P. (2012). A comparative analysis of international frameworks for 21st century competences: Implications for national curriculum policies.
Journal of Curriculum Studies, 44(3), 299–321.https://doi.org/10.1080/00220272.2012.668938.
Wang, K. (2008).Investigating the domain of geometric inductive reasoning problems: A structural equation modeling analysis(Doctoral dissertation)Brigham Young University.
Waschl, N., & Burns, N. R. (2020). Sex differences in inductive reasoning: A research synthesis using meta-analytic techniques.Personality and Individual Differences, 164, Article 109959.https://doi.org/10.1016/j.paid.2020.109959.
Wickham, Hadley (2016).ggplot2: Elegant Graphics for Data Analysis.Springer-Verlag New YorkArticle ISBN:978-3-319-24277-4.https://ggplot2.tidyverse.org.
Williams, J. E., & McCord, D. M. (2006). Equivalence of standard and computerized versions of the Raven Progressive Matrices Test.Computers in Human Behavior, 22(5), 791–800.
Wu, H., & Molnár, G. (2018). Interactive problem solving: Assessment and relations to combinatorial and inductive reasoning.Journal of Psychological and Educational Research, 26(1), 90–105.