0139–3006 © 2018 Akadémiai Kiadó, Budapest DOI: 10.1556/066.2018.47.1.5
TEXTURAL PROPERTIES OF TURKEY SAUSAGE USING PEA FIBER OR POTATO STARCH AS FAT REPLACERS
É. VARGA-VISI*, B. TOXANBAYEVA, G. ANDRÁSSYNÉ BAKA and R. ROMVÁRI Faculty of Agriculture and Environmental Sciences, Kaposvár University H-7400 Kaposvár, Guba S. u. 40.
Hungary
(Received: 27 February 2017; accepted: 30 April 2017)
The fat content of Bologna-type turkey sausages was partially replaced with pea fi ber or potato starch. Textural properties of full fat turkey sausage were mainly restored in sausages when fat was partially replaced with some levels of pea fi ber (0.6, 1.2%) or potato starch (1.9%). Authors observed signifi cant correlation (P<0.01) between instrumentally measured values of hardness and chewiness and sensory ratings of low fat sausages.
Keywords: low fat sausage, turkey, texture profi le analysis, hardness, cohesiveness, chewiness
Fat reduction in foods can decrease the energy intake of humans and therefore may help preventing overnutrition and non-communicable diseases (HYGREEVA et al., 2014).
Nevertheless, fat is responsible for the appropriate texture, juiciness, and characteristic aroma of meat products (CHOI et al., 2013). In the case of Bologna-type sausages, gel strength increases with the reduction of fat/lean ratio (KEETON, 1994) as the ratio of continuous phase (protein solution) rises compared to dispersed phase (fat globules) in meat emulsion, therefore reduction of fat content cannot be achieved per se. Inclusion of surplus gel forming ingredients beside meat proteins can increase gel strength further. The result could be an increase in yield, but parallel to this, the product could be too fi rm, dry, and rubbery that may be rejected by consumers. The consequence is, when fat replacers are used, the addition of an excess amount of water is necessary, and the ratio of surplus water and fat substitute should be balanced in order to avoid the formation of too rigid or too soft texture (VARGA-VISI and TOXANBAYEVA, 2017).
Correlation between sensory assessed and instrumentally detected hardness of food products has been established (BOURNE, 2002). Low fat Bologna-type products were compared to full fat control based on the results of both texture profi le analysis (TPA) and panel test, and the results of instrumental and sensory evaluations were similar regarding hardness (PIETRASIK & JANZ, 2010; KEENAN et al., 2014). However, little studies have been cited in the literature concerning other TPA parameters. The objective of this study was to investigate the effect of potato starch and pea fi ber additives on textural properties of low fat Bologna-type sausage made of poultry. Moreover, the correlations between instrumentally measured and sensory assessed hardness and chewiness were also assessed.
* To whom correspondence should be addressed.
Phone: +36 82 505 800/2307; fax: +36 82 321 749; e-mail: vargane.eva@ke.hu
Acta Alimentaria 47, 2018
1. Materials and methods
1.1. Materials, sausage formulation and manufacture
Potato starch, pea fi ber, salt with nitrite, spice mixture, and casings were purchased from Solvent Inc. (Budapest, Hungary), vacuum packed turkey breast meat and goose fat were obtained from a local store. The meat was minced through a Moulinex Charlotte HV3 type meat grinder with 4 mm hole size, then mixed and sorted into 0.45 kg lots. Those were frozen and stored at –20°C. Goose fat was stored at 4°C until processing.
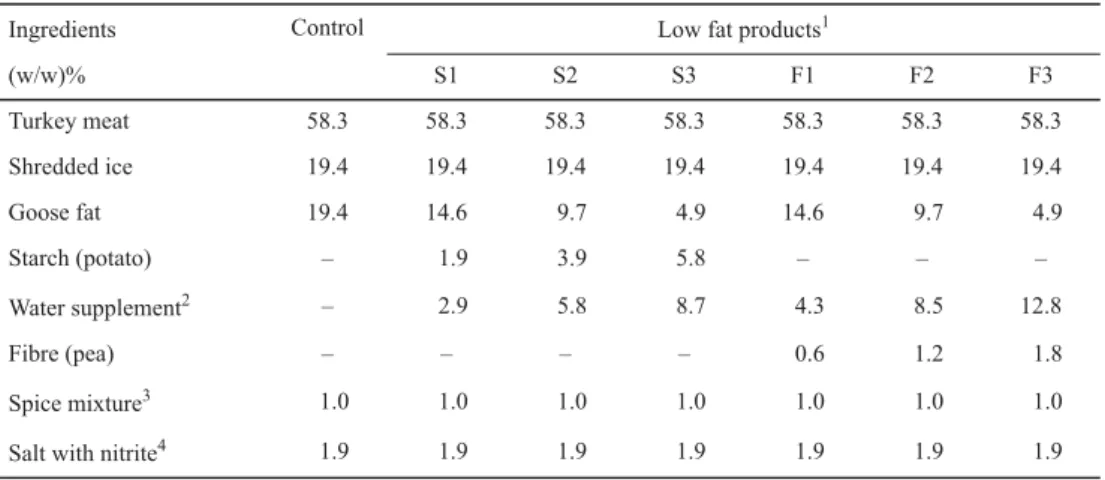
Six different formulations of reduced-fat Bologna-type sausages and full fat reference sausage were processed in a pilot plant at Kaposvár University. The ratio of lean meat, salt with nitrite, and spice mixture was kept constant for each type of sausage, while the ratio of fat was reduced by approximately 25, 50, and 75% compared to the full fat control product (Table 1). The manufacture of the seven sorts of sausages was accomplished on the same day.
The processing was repeated four times at four different days, i.e. four batches (each 0.77 kg) were prepared for each treatment. For each type of sausage all ingredients were minced in a Blixer 4 v.v. type silent cutter (Robot couple U.S.A Inc, Ridgeland) for 20 s at 30 s–1, after checking the temperature of the meat mass, further chopping was carried out for 20 s at 30 s–1. The temperature of the meat mass was between –4 and –2.5 °C, and the mixtures were completely emulsifi ed at the end of the chopping. The meat mass was stuffed into 55 mm diameter heat-resistant, water impermeable plastic casings. Sausage batches were thermally processed in water at 78 °C for 2 h in an 850 C-FRG type instrument (Bayhaand Strackbein GmbH, Arnsberg, Germany) followed by rapid cooling in ice-water bath and storage at 4 °C.
All sensory and instrumental evaluations were conducted on the seventh day of storage.
Table 1. Formulations used in the manufacture of full fat and fat-reduced sausages
Ingredients Control Low fat products1
(w/w)% S1 S2 S3 F1 F2 F3
Turkey meat 58.3 58.3 58.3 58.3 58.3 58.3 58.3
Shredded ice 19.4 19.4 19.4 19.4 19.4 19.4 19.4
Goose fat 19.4 14.6 9.7 4.9 14.6 9.7 4.9
Starch (potato) – 1.9 3.9 5.8 – – –
Water supplement2 – 2.9 5.8 8.7 4.3 8.5 12.8
Fibre (pea) – – – – 0.6 1.2 1.8
Spice mixture3 1.0 1.0 1.0 1.0 1.0 1.0 1.0
Salt with nitrite4 1.9 1.9 1.9 1.9 1.9 1.9 1.9
1: S: potato starch; F: pea fi ber; 1: 25% of fat was substituted; 2: 50% of fat was substituted; 3: 75% of fat was substituted.
2:Water supplement was applied to low fat products in the form of shredded ice.
3:Bologna sausage type spice mixture contained diphosphate and sodium-iso-ascorbic acid.
4: Salt with nitrite consisted of 0.45±0.05 (w/w)% sodium nitrite.
1.2. Chemical assays, texture analysis, and organoleptic assessment
Moisture, fat, protein, and ash content were measured according to the standards of MSZ ISO (2000a), MSZ ISO (2002a), MSZ ISO (2002b), and MSZ ISO (2000b), respectively. The energy content of sausages was determined using an IKA C4000 adiabatic calorimeter (IKA- Werke GmbH & Co. KG, Staufen, Germany).
Texture profi le analysis was conducted with a Zwick Roell Z005 type texture analyser equipped with a 5 kN load cell and TestXpert 11.0 program. Cylindrical samples (25 mm diameter and 20 mm height) were obtained from both vertical and horizontal directions from the sausages, the latter is the direction of stuffi ng of casings, while the former is perpendicular to the direction of stuffi ng. Four samples were taken from each direction of each batch of sausage. Cylindrical specimens were compressed to 50% of their original height and force – distance (time) curves were recorded. The crosshead speed was 50 mm s–1. The diameter of the compression plate was 43 mm. Based on force – distance curves of the fi rst and the second compression, the values of hardness (peak force on fi rst compression, N), cohesiveness (ratio of the work done under the second compression compared to the fi rst compression, dimensionless), springiness (the height after the fi rst compression compared to the height before compression, dimensionless), and chewiness (hardness × cohesiveness × springiness) were measured and calculated.
Sensory profi le test was conducted by an in-house panel familiar with the type of the product being evaluated and trained for the descriptive attributes. The casings were removed from sausages and they were sliced just before the assays. Slices with 2 mm width and 55 mm diameter were placed on white plastic plates, samples were randomly coded. All seven sorts of samples of four repetitions were investigated. The number of assessors was 11 for each test. Panelists scored the next sensory descriptors of the samples on a fi ve-point hedonic scale: hardness1 by touch (1: very soft, 5: very hard), hardness2 by the fi rst bite (1: very soft, 5: very hard), and chewiness (the required mastication force and time for complete disintegration of the sausage, 1: short time, weak mastication, 5: long time, strong mastication).
1.3. Data analysis
Analysis of variance was used for TPA and sensory analysis data with Student–Newman–
Keuls post hoc test or Tamhane’s posteriori test. In cases when variables did not follow normal distribution, Kruskal–Wallis nonparametric test was applied. The degree of association between instrumentally measured and organoleptic properties was assessed with correlation analysis, Pearson correlation was calculated. Parameters of predicting functions describing the relationship between instrumentally measured and organoleptic properties, regression constants and regression coeffi cients, were determined with linear regression. Calculations were conducted with the use of IBM SPSS Statistics (20. version).
2. Results and discussion
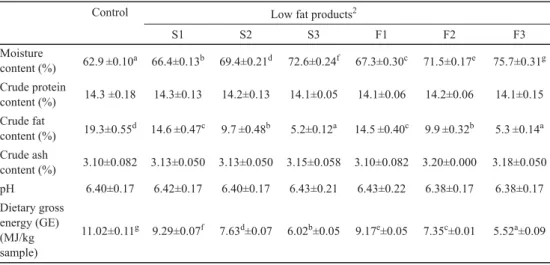
The chemical composition of the sausages (Table 2) was in line with the applied formulas (Table 1).
Sausages were sampled from both vertical and horizontal direction, i.e. from the shorter size and from the longer size. The effect of the direction of pressing on TPA parameters was assessed fi rst. The means of cohesiveness values obtained from vertical and horizontal
Acta Alimentaria 47, 2018
pressing did not differ (P=0.921) by direction and the same was valid for springiness (P=0.596).
However, the direction of pressing does exert a signifi cant effect on the hardness and chewiness values with higher means in the case of vertical pressing, 49.7 and 30.0, respectively, compared to horizontal pressing 43.7 and 26.1, respectively. Hence in the case of these two TPA variables, data obtained from horizontal and vertical pressing were analysed separately.
Table 2. Proximate composition, pH, and energy content of high fat and low fat Bologna sausages1
Control Low fat products2
S1 S2 S3 F1 F2 F3
Moisture
content (%) 62.9±0.10a 66.4±0.13b 69.4±0.21d 72.6±0.24f 67.3±0.30c 71.5±0.17e 75.7±0.31g Crude protein
content (%) 14.3 ±0.18 14.3±0.13 14.2±0.13 14.1±0.05 14.1±0.06 14.2±0.06 14.1±0.15 Crude fat
content (%) 19.3±0.55d 14.6±0.47c 9.7±0.48b 5.2±0.12a 14.5±0.40c 9.9±0.32b 5.3±0.14a Crude ash
content (%) 3.10±0.082 3.13±0.050 3.13±0.050 3.15±0.058 3.10±0.082 3.20±0.000 3.18±0.050 pH 6.40±0.17 6.42±0.17 6.40±0.17 6.43±0.21 6.43±0.22 6.38±0.17 6.38±0.17 Dietary gross
energy (GE) (MJ/kg sample)
11.02±0.11g 9.29±0.07f 7.63d±0.07 6.02b±0.05 9.17e±0.05 7.35c±0.01 5.52a±0.09
Means within row with different superscript letters are signifi cantly different (P<0.05).
1: Values are mean ±standard deviation (n= 4); 2:S: potato starch; F: pea fi ber; 1: 25% of fat was substituted; 2: 50%
of fat was substituted; 3: 75% of fat was substituted.
Springiness was signifi cantly (P=0.001) infl uenced by the formulation of the sausage.
Samples with medium and high levels of starch had signifi cantly greater springiness values than reference sausage (Table 3). Sausage type also exerts a signifi cant effect (P<0.001) on cohesiveness. High starch sample (S3) was more cohesive than the control and high fi ber sample (F3). Altering formulations resulted in signifi cant differences in both hardness and chewiness values (P<0.001). The tendency of these two TPA values correlates, as chewiness is calculated partially based on hardness. Results based on vertical and horizontal pressing were evaluated separately (Table 3), as the effect of the direction of sampling on these variables was signifi cant. However, the tendency of the results, regarding the effect of the formulations of samples on hardness and chewiness was similar, irrespectively of the direction of pressing. Both hardness and chewiness values were proportional to the percentage of starch included in the samples. Samples with high level of starch (5.8%) were harder than reference sausage, and samples with more than 3.9% of starch were chewier than the control.
PIETRASIK and JANZ (2010) detected signifi cant increase of instrumental chewiness when fat was replaced with 4% pea starch, as in this paper, while the increase of the mean value of hardness was not signifi cant. Starch inclusion was reported to exert a similar effect on gel strength like the decrease of fat/lean ratio that is advantageous for yield (BAÑÓN et al., 2008) but may result in too dry and rubbery structure (MALLIKA et al., 2009). In our experiment, fat replacement at the lowest level with 1.9% of starch gave the same TPA values as full fat control.
Table 3.Instrumental textural properties of high fat and low fat fat Bologna sausages ControlLow fat products3 S1S2S3F1F2F3 Springiness10.904±0.070a0.915±0.022ab0.925±0.035b0.930±0.028b0.921±0.038ab0.919±0.028ab0.912±0.070ab Cohesiveness10.620±0.030a0.664±0.022bc0.663±0.025bc0.674±0.020c0.677±0.055bc0.658±0.026bc0.649±0.028b Hardness, vertical pressing253.6±4.3cd49.7±2.3c53.5±4.0d57.6±4.8e47.1±5.3b46.3±4.6 b40.2±3.2a Hardness, horizontal pressing243.3±5.0b43.3±6.1b48.2±5.2c56.5±3.7d39.0±3.9ab38.9±6.2 ab36.4±2.0a Chewiness, vertical pressing229.6±3.6b30.4±1.9b32.9±3.8c36.3±3.1d29.6±5.0b27.9±3.2b23.1±1.9a Chewiness, horizontal pressing224.1±2.6ab26.1±4.0b29.5±3.8c34.8±2.4d24.4±3.3ab23.6±4.4 ab21.5±1.1a Means within row with different superscript letters are signifi cantly different (P<0.05). 1: Values are mean ±standard deviation (n=32); 2: Values are mean ±standard deviation (n=16); 3: S: potato starch; F: pea fi bre; 1: 25% of fat was substituted; 2: 50% of fat was substituted; 3: 75% of fat was substituted. Table 4. Scores of sensory analysis of high fat and low fat Bologna sausages1 ControlLow fat products2 S1S2S3F1F2F3 Hardness13.0±0.76a3.5±0.59ab3.6±0.76bc4.0±0.65c3.2±0.68ab3.1±0.73ab3.0±0.78a Hardness22.8±0.71a3.5±0.66b3.7±0.75bc4.1±0.72c3.3±0.66ab2.9±0.62a2.8±0.78a Chewiness2.7±0.80ab3.3±0.65c3.6±0.85c3.9±0.86c3.2±0.65b2.7±0.67ab2.6±0.81a Means within row with different superscript letters are signifi cantly different (P<0.05). 1:Values are mean ±standard deviation (n=44); 2:S: potato starch; F: pea fi ber; 1: 25% of fat was substituted; 2: 50% of fat was substituted; 3: 75% of fat was substituted.
Acta Alimentaria 47, 2018
PIETRASIK and JANZ (2010) used 4% pea fi ber in a formulation of low fat sausage and reported the same instrumental hardness and signifi cantly greater chewiness values compared to full fat sausage. On the contrary, in the present work, the texture of sausages was measured somewhat softer when pea fi ber was included instead of fat. Fat replacement at medium and low levels with 1.2 or 0.6% of pea fi ber mainly restored the hardness and chewiness values of full fat control, while the inclusion of 1.7% of pea fi ber (F3) caused signifi cant decrease in instrumental hardness and chewiness values compared to full fat reference sausage.
In sensory evaluation starch inclusions increased hardness1 value (hardness estimated by touch) as the samples became fi rmer in line with the increased percentage of starch; while the addition of pea fi ber did not exert signifi cant effect on this variable (Table 4). All pea fi ber enriched sausages were perceived as having the same hardness1 mean value as reference sausage. The ratio of substituting material and water was held constant at the three levels of fat replacement, but the water content of the product increased in line with the degree of substitution. Despite of high water content (see Table 2 on chemical analysis), none of the products with fi ber was perceived as having a softer structure than the control that may suggest that inclusion of these levels of pea fi ber was adequate to restore the structure of full fat analogue for assessors. However, the addition of starch was not advantageous in this respect, as the structure was assessed fi rmer than the control. The observed tendency for hardness measured by the fi rst bite (hardness2) was pretty similar to that of hardness1.
Hardness2 values increased as the percentage of starch was enhanced (see Table 4 from S1 to S3). Inclusion of fi ber instead of fat at each level, from F1 to F3, did not result signifi cant change in hardness2 value compared to control. Replacement of fat with starch caused signifi cant increase in chewiness, while the inclusion of medium and high levels of fi ber resulted in the same mean values of chewiness than that of reference sausage. Namely, the formulations with pea fi ber were assessed to result in similar textural characteristics as full fat sausage. Concurring with our fi ndings, replacement of fat with 4% of pea fi ber did not change the fi rmness of low fat Bologna-type sausages made of beef and pork (PIETRASIK &
JANZ, 2010), although in the present study the percentage of pea fi ber was smaller, between 0.6 and 1.7.
Assessors’ perceived hardness was in line with instrumental texture attributes. Hardness1 and hardness2 scores had higher Pearson correlation with horizontally measured hardness values than with vertically measured hardness values, because assessors bit or touched the samples from horizontal direction (Table 5). The connection between instrumentally measured and sensory assessed hardness was more signifi cant when only the values of reduced fat samples were included and not the full data set with control (right and left part of Table 5, respectively). In the case of full fat control samples, both hardness1 (hardness by touch) and hardness2 (hardness by the fi rst bite) values were underestimated by panelists compared to fat-substituted counterparts. The average score for hardness1 of control was 2.98. Based on the estimating equation describing the relationship between hardness1 and vertically determined hardness (Table 6), it should be 3.70, moreover, based on the estimating equation describing the relationship between hardness1 and horizontally determined hardness, it should be 3.32. The same tendency is shown for hardness 2 value of the control at similar magnitude. As a consequence, the results of the organoleptic and instrumental evaluation of the hardness values were contradictory in some cases. Sample with high level of fi ber (F3) was perceived having the same hardness as the control by the assessors (Table 4), while the hardness of these samples signifi cantly differed when it was measured instrumentally, as the control sample was measured signifi cantly harder than the sample with high level of fi ber
(Table 3). Within the group of low fat samples, the evaluation of their relative hardness hardly depends on the sort of method. Similar tendency was observed for chewiness, as the value of control sample was probably underestimated by panelists compared to reduced-fat samples, but the degree of this deviation was much smaller than in the case of hardness values.
Table 5. Correlation between instrumentally measured values and sensory ratings of hardness and chewiness values previously presented in Tables 3 and 4
Pearson correlation (R)
Instrumental texture analysis
Full-fat and reduced-fat sausages (full data set) Only reduced fat sausages Sensory
evaluation
Hardness (vertical)
Hardness (horizontal)
Chewiness (vertical)
Chewiness (horizontal)
Hardness (vertical)
Hardness (horizontal)
Hardness1 0.700 0.897** 0.967** 0.987**
Hardness2 0.705 0.883** 0.953** 0.960**
Chewiness 0.897** 0.931**
**: Correlation is signifi cant at the 0.01 level (2-tailed).
Table 6. Linear regression parameters of estimating curves describing the relationship between sensory ratings and instrumentally measured values of hardness previously presented in Tables 3 and 4
Sensory evaluation
Instrumental texture analysis Full-fat and reduced-fat sausages (full data set)
Hardness (vertical) Hardness (horizontal)
B0 B1 B0 B1
Hardness1 12.94±16.84 10.99±5.01 –12.28±12.37 16.72±3.68
Hardness2 21.92±12.62 8.44±3.80 2.30±9.91 12.55±2.98
Chewiness (vertical) Chewiness (horizontal)
B0 B1 B0 B1
Chewiness 6.76±5.16 7.40±1.63 –0.18±4.68 8.44±1.48
Sensory evaluation
Instrumental texture analysis Only reduced-fat sausages
Hardness (vertical) Hardness (horizontal)
B0 B1 B0 B1
Hardness1 –5.82±7.31 16.11±2.14 –25.94±5.68 20.45±1.66
Hardness2 8.74±6.50 11.97±1.91 –6.83±7.38 15.00±2.17
Y=B0+B1×x; B0: regression constant; B1: regression coeffi cient; Y: hardness (vertical) or hardness (horizontal) or chewiness (vertical) or chewiness (horizontal); X: hardness1 or hardness2 or chewiness
Acta Alimentaria 47, 2018
3. Conclusions
Results show that the textural properties of full fat turkey sausage were mainly restored in sausages when fat was partially replaced with some levels of pea fi ber (0.6, 1.2%) or potato starch (1.9%). Moreover, increase of fi ber or starch content, parallel with the decrease of fatty ingredient, led to different effects on textural characteristics. Starch, owing to its own gel forming, increased the measured TPA values compared to reference sausage, generating harder, chewier, more springy and cohesive structures; while inclusion of fi ber somewhat softened the structure, although this effect was signifi cant only in some cases at the highest level (1.6%) of addition.
The contradiction between the results of instrumental and organoleptic assays may indicate that there might be differences between the rheological models valid for full fat and fat substituted samples, resulting differences in the perception of hardness. Further work is needed to study this issue.
*
This work was supported by the Doctoral School of Animal Science, Kaposvár University. Toxanbayeva Botagoz PhD student is granted by the Balassi Institute (Stipendium Hungaricum Scholarship Program, K 3203). The authors also wish to thank the members of Institute of Food and Agricultural Product Qualifi cation who participated in organoleptic tests and conducted proximate analysis of samples.
References
BAŇÓN, S., DÍAZ, P., NIETO, G., CASTILLO, M. & ÁLVAREZ, D. (2008): Modelling the yield and texture of comminuted pork products using color and temperature. Effect of fat/lean ratio and starch. Meat Sci., 80, 649–655.
BOURNE, M.C. (2002): Food texture and viscosity: concept and measurement. Academic Press, London, UK, pp.
182–186.
CHOI, Y.S., PARK, K.S., KIM, H.W., HWANG, K.E., SONG, D.H., CHOI, M.S., LEE, S.Y., PAIK, H.D. & KIM, C.J. (2013):
Quality characteristics of reduced-fat frankfurters with pork fat replaced by sunfl ower seed oils and dietary fi ber extracted from makgeolli lees. Meat Sci., 93, 652–658.
HYGREEVA D., PANDEY, M.C. & RADHAKRISHNA, K. (2014): Potential applications of plant based derivatives as fat replacers, antioxidants and antimicrobials in fresh and processed meat products. Meat Sci., 98, 47–57.
KEENAN, D.F., RESCONI, V.C., KERRY, J.P. & HAMILL, R.M. (2014): Modelling the infl uence of inulin as a fat substitute in comminuted meat products on their physico-chemical characteristics and eating quality using a mixture design approach. Meat Sci., 96, 1384–1394.
KEETON, J.T. (1994): Low-fat meat products – technological problems with processing. Meat Sci., 36, 261–276.
MALLIKA, E.N., PRABHAKAR, K. & REDDY, P.M. (2009): Low fat meat products – an overview. Vet. World, 9(2), 364–366.
MSZ ISO (2000a): Hús és hústermékek. A nedvességtartalom meghatározása (referencia-módszer). (Meat and meat products. Determination of moisture content (reference method)). MSZ ISO 1442:2000
MSZ ISO (2000b): Hús és hústermékek. Az összes hamu meghatározása. (Meat and meat products. Determination of total ash), MSZ ISO 936:2000
MSZ ISO (2002a): Hús és húskészítmények. Az összes zsírtartalom meghatározása. (Meat and meat products.
Determination of total fat content.) MSZ ISO 1443:2002
MSZ ISO (2002b): Hús és húskészítmények. A nitrogéntartalom meghatározása (referencia-módszer). (Meat and meat products. Determination of nitrogen content (reference method).) MSZ ISO 937:2002
PIETRASIK, Z. & JANZ, J.A.M. (2010): Utilization of pea fl our, starch-rich and fi ber-rich fractions in low fat bologna.
Food Res. Int., 43, 602–608.
VARGA-VISI, É. & TOXANBAYEVA, B. (2017): Application of fat replacers and their effect on quality of comminuted meat products with low lipid content: A review. Acta Alimentaria, 46, 181–186.