EFFECT OF FIRE ON NATURAL STONES
András Biró, Viktor Hlavička, Éva Lublóy
Budapest University of Technology and Economics, Department of Construction Materials and Technologies, H-1111, Budapest, Műegyetem rkp. 3. Hungary
ABSTRACT
Natural stones have been widely used in many areas of our life since the stone age. The exact properties of the building stones are very important to know, especially for designing structures like tunnels, bridges, buildings. It is also necessary to have proper information about the changes of structure of the stones affected by high temperatures or fire.
Fire cases in historical buildings drew more attention to this aspect of the researches in the last few decades, the proper knowledge of the physical and chemical changes of the stones exposed to high heat became essential.
At high temperature (500-800 °C), stones tend to disintegrate, but some changes start to appear at lower temperatures already (150-300 °C). At lower temperatures mostly aesthetical changes, like discoloration, pale surface and the oxidation of minerals containing iron occur.
Nowadays, architects mainly choose natural stone for aesthetical reasons. They are mostly used as cover on the walls, on the ground or on the ceiling. On the other hand, in historical structures, stone is used as the main structural material. In our opinion, it is important to compare the frequently used stone types to get more information about their behaviour and safety in case of fires. The main type of failure of stone slabs is bending failure (because of the method of the fixation).
In our research, we tested stones which are widely used as tiles in Hungary (granite, marble, travertine, labradorite). We tested the stones after exposing them to heat to get information about their property changes and their limits of usage. Beside flexural strength, among our laboratory tests we also measured uniaxial compressive strength and tensile strength (indirectly by Brazilian test). We also examined the stone material with optical microscope and derivatograph as well.
Keywords: natural stone, fire, derivatograph, optical microscope
*Manuscript
Click here to view linked References
1. INTRODUCTION
After fire cases in historical stone buildings, it became obvious, that fire resistance tests for natural stones are necessary. It is necessary to maintain the strength and stability of the structures during the fire. Fire safety standards prioritize human life over the protection of the structure against the heat and smoke. In case of reconstructions after fire, we needed to know the residual properties and the structural state of the materials. In many cases examinations right after the fire would provide more accurate information and more useful data, if they could be done, but typically it is not possible until the insurance process is finished.
Stonemasonry (limestone in this particular case) was affected by the fire of the Windsor-Castle (which is a property of the royal family in the United Kingdom) on November 20th in 1992 (Figure 1), when a private chapel set ablaze in the Chester Tower on the first floor, which is located in the north-eastern side of the castle. At the beginning photographers noticed a burning carpet. Later experiments confirmed, that a lamp caused the fire, which set several chemicals ablaze and the fire spread to the carpets only after. The high heat and fire damaged the St George’s Hall and destroyed the Brunswick Tower. The natural stone was damaged by fire, smoke and even by the water used during the fire extinguish [2].
Figure 1: Fire of the Windsor Castle [1]
A similar case was the fire in the Hampton Court Palace on March 31st in 1986. The historical palace is in Southwest London and has around 1000 rooms. After the fire, a lot of unknown voids and vents were found which helped the spread of the flames. Probably a candle-like flame caused the fire. The structure of the building helped the spread of the flames to the roof. Although there was serious structural damage, the stonemasonry remained in an acceptable condition. The damage in stones was localized around doors and windows. The smaller cracks were repaired, and in some cases, stonemasonry needed to be replaced [2].
The historical Mithatpasa Technical Junior High School, built in 1881, was damaged by a major fire that took place recently in the city of Izmir. Cracks, crusts and spalling were observed on the blocks after the fire. The term crack referred to discontinuities formed by thermal gradients within the marble blocks during the fire. Crust and spalling, on the other hand were used to define a few centimetres thick thermally stressed slice below the block surface, and a reduction in the cross-sectional area of the block due to the breakage of relatively large size pieces along fractured surfaces where high thermal stress concentrations had been taken place. Cracks and crusts were mainly localized on the flame- heated side of the blocks. The opposite side of the blocks, however, did not possess significant cracks and crusts and apparently received less damage [3].
There are several significant studies on the decomposition of the elements that form the structure caused by the effect of high temperature and fire in case of concrete [4,5], high performance concrete [6,7], lightweight concrete [8,9], mortar [10–12], steel [13,14], clay bricks [15] and engineered stone [16]. The natural weathering and behaviour of natural stones have been studied in detail, but only few attempts have been made to understand the behaviour of these stones at high temperatures. Studies on the effect of temperature on natural stones usually concern sandstone [17–20] and granite [21–23].
Researchers have made some experimental studies on the effect of high temperature (around 500 °C in the furnace), on rock weathering in laboratory conditions, focusing on some petro-physical and chemical properties [24–26]. The effects of different temperature values from room temperature up to 1000 °C (room temperature, 200, 400,600, 800, 1000 °C) on marble and limestone were investigated by the aspects of change in colour and whiteness, polish reception, daily physical change, pH and temperature variations of the cooling solution. Ozguven and Ozcelik [27] concluded:
It is determined that the colour of natural stones becomes lighter in appearance with increasing of temperature.
In the restoration process of natural stones that are exposed to high temperature or direct heat in a fire, up to a certain temperature, if possible, they can be re-polished in situ. Every natural stone can be polished up to 600 °C.
It is determined that depending on the composition and temperature exposure, colour and lightness values of the natural stones change.
According to the studies, it is understood that natural stone structures becomes damaged and/or changes, breaks down, pours or cracks after heated above 800 °C. It is observed that generally, natural stones that face this amount of heat under atmospheric conditions, crack, fragmentize, spall and disperse.
If a fire temperature around natural stones reaches high degrees, it is observed that the calcine from natural stones react with water, disperse in water and cause very high temperatures and pH levels by exothermic reactions. For this reason, it is established that there must be additional measures of security at that kind of location.
Researchers observed the following [28]:
1) Limestone. Brown or buff-coloured limestone which contains hydrated iron oxide was found to change colour to pink or reddish-brown at 250-300 °C and to become more reddish at 400
°C. From 800 to 1000 °C the stone becomes a grey-white powder. In limestone, the calcination of calcium carbonate begins at 600 °C and proceeds rapidly beyond 800 °C.
2) Sandstone. The colour change in sandstones corresponds with the dehydration of iron compounds. This requires a temperature of 250-300 °C. Brown or buff coloured sandstone changes colour to reddish brown but the change may not be apparent until the stone has been heated to temperatures above 400 °C. This colour change can persist after heating to 1000 °C.
Heating sandstones to greater than 573 °C usually causes internal rupturing of the quartz grains thus leading to weakening of the stone which tends to become friable.
3) Granite. Igneous rocks such as granites have been found to show no colour change on heating.
But they crack or shatter at temperatures above 573 °C through quartz expansion. Thermal expansion of granite from 20 °C to 250° C is fully reversible for a small fire when the heating rate is 1 °C per minute. However, for a large fire with a heating rate of 5 °C per minute the expansion is not totally reversible. Differential thermal expansions of granite at higher temperatures (e.g. 900 °C) give rise to tensile and compressive stresses that can cause permanent strain in the stoned.
4) Marble. While marble has been observed to undergo a complete decomposition of the internal structure induced by differential expansion of the calcite crystals. This residual expansion is known as thermal hysteresis and can cause significant reductions in the flexural strength. In extreme cases the marble can become so friable that it can crumble into powder.
Earlier studies on thermally induced stresses had concluded that because of the low thermal diffusivity value of stone, steep temperature gradients are set up across the stone when the fire is extinguished or when the surface is cooled rapidly by water. These gradients will cause differences in the degree of thermal expansion which will, in turn, induce stresses in stone. Cracking or spalling of the stone can then occur.
The primary reason of our work was that in the reviewed literature there were no detailed studies and tests on the effects of high temperatures on natural stones frequently used in Hungary. The mechanical properties change with the inner structure and mineral composition, so the stones used in a certain region does not have the same properties as stones in other regions even if they are similar (e.g.
different pore content can change fire behaviour drastically).
In some studies, the effects of low temperatures on limestone and marble have been investigated [4,17, 29, 30, 31]. In the studies, in which the provided temperature values do not exceed 400 – 500 °C, the temperature range, a stone might be exposed to in a real fire is not fully covered. Therefore, in our study we aimed to understand the effect of high temperatures and heat during a fire on natural building stones such as limestone and marble, which are widely used in buildings.
2. MATERIALS AND TEST METHODS 2.1 Applied materials
Our experimental study included four types of rocks, which are frequently used in Hungary. During selecting the stone types, we have considered the formation of the stone. We tested both sedimentary, igneous and metamorphic stones.
The following stone-types were tested:
Rosa Beta granite: felsic, intrusive, igneous rock, granular and phaneritic in texture,
Labradorite (Pakoslawice, Poland): intrusive igneous rock, phaneritic in texture,
Travertine (Haraszti, Hungary): sedimentary, carbonate rock,
Marble (Carrara, Italy): metamorphic, recrystallized carbonate minerals.
The geometric parameters of the test specimens were:
d=50 mm, h=60 mm cylinders to measure uniaxial compressive strength,
d=50 mm, h=30 mm cylinders for the Brazilian test,
a=150 mm, b=50 mm, c=25 mm for three-point bending test.
We exposed the specimens to 50, 150, 300, 500, 800 °C temperature load and there were reference specimens as well (20°C). For each temperature level three samples were tested. Altogether 216 specimens were tested. Our experiment matrix is shown in Table 1.
Table 1: Experiment matrix (b=three-point bending test, c=uniaxial compressive strength, t= Brazilian test for tensile strength)
Temp.
Granite Labradorite Travertine Marble[°C] b. c. t. b. c. t. b. c. t. b. c. t.
20 3 3 3 3 3 3 3 3 3 3 3 3
50 3 3 3 3 3 3 3 3 3 3 3 3
150 3 3 3 3 3 3 3 3 3 3 3 3
300 3 3 3 3 3 3 3 3 3 3 3 3
500 3 3 3 3 3 3 3 3 3 3 3 3
800 3 3 3 3 3 3 3 3 3 3 3 3
Total specimen count
2162.2 Test methods
2.2.1 Temperature load
To provide temperature load we used an electrical furnace. The furnace heated the specimens according to the standard fire curve [32]. The highest temperatures were 50, 150, 300, 500 and 800 °C for the samples. As references, we had samples only exposed to room temperature (20 °C). The duration of the temperature loading was 2 hours in every case because it was enough to warm up the sample to an equal temperature. We let the specimens to cool down at room temperature and only tested them afterwards.
2.2.2 Compressive strength
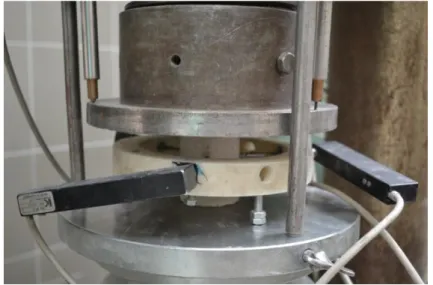
We measured the compressive strength on cylindrical specimens (h=60 mm, d=50 mm) (Figure 2).
During the tests we measured the axial and lateral deformations, by three-three electronic transducers (10 mm measuring limit). The device used for the test was displacement controlled. The loading speed was 0.01 mm/s.
Figure 2: Experimental setup for uniaxial compressive strength test
2.2.3 Flexural strength
Flexural strength was also measured. The geometry of the specimens was: 25×50×150 mm. The applied support distance was 125 mm. The experimental setup can be seen in Figure 3. The force which caused the failure of the specimen was measured. The device used for this test was force controlled. The loading speed was 0.5 MPa/s.
There was small groove on the specimens (Figure 3). These grooves made sure that the failure happened at the middle of the specimen and made possible to also evaluate the results by fracture mechanics methods. This evaluation is not the subject of this research.
Figure 3: Experimental setup for flexural strength test
2.2.4 Splitting strength
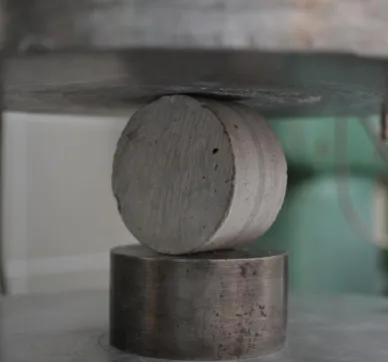
Splitting (tensile) strength was measured on cylindrical specimens (h=30 mm, d=50 mm) (Figure 4).
The force, which caused the failure of the specimens was detected. The device used for the test was force controlled. The loading speed was 1 kN/s.
Figure 4: Experimental setup for splitting strength test
2.2.5 Microscopic observation
For microscopic observation thin sections were cast from the samples only exposed to room temperature. First, thin pieces of the stones were cut which were adhesively bonded to a properly prepared slide with epoxy resin. Next, the specimens were polished to a thickness less than 0.03 mm.
The thin sections were observed by a Zeiss Axioskop 40 optical microscope.
2.2.6 Observation by derivatograph
The stone material was observed by a derivatograph as well. This is a simultaneous thermoanalytical method that simultaneously generates TG (thermogravimetric), DTA (differential thermal analysis) and DTG (derivative thermogravimetric) signal. A small sample was grinded to powder in an inert material pot (corundum or platinum), then heated at a steady heating rate in a furnace. Meanwhile the analytical balance measured the changes in mass of the sample (TG curve) and thermocouples measured thermal reactions in the sample relative to the temperature of a reference inert substance in the furnace (DTA curve). The first derivative of the TG curve is the DTG curve. The DTG curve is analogously produced by the apparatus which helps in separating the thermal reactions associated with mass change. These three curves by the temperature and the time we call a derivatogram.
The parameters of the tests were the following:
reference substance: aluminium oxide,
heating rate: 10 °C/min,
temperature range: 20-1000° C,
initial sample mass 200 mg,
TG sensitivity: 50 mg
corundum pot,
atmospheric pressure.
To evaluate the test results, we used the WINDER (Version 4.4) software.
Phases of the test material that do not undergo any thermal reaction during the measurement temperature range cannot be analysed with the derivatograph. If multiple thermal reactions occur in the same temperature interval, the peaks of the DTH and the DTA curve may overlap, multiple peaks or inflections appear. In such cases, the qualitative identification of the phases with the derivatograph is cumbersome or impossible.
3. TEST RESULTS AND THEIR EVALUATION 3.1 Visual observation
We observed the specimens after exposing them to the applied temperature. All specimens lost some of their aesthetic value with the increasing temperature, which is obviously a factor to consider. In practice, decreased aesthetic value can lead to the replacement of a specific stone slab. At lower temperatures (up to 300 °C) the rocks became obscure. The damage of the surface of the rocks (e.g.
oxidation of iron containing minerals) and cracks may indicate a chemically altered structure.
Chemical changes usually also cause strength changes.
The following observations were made:
Slight cracks appeared on the granite and labradorite specimens at 500 °C and even more and wider cracks appeared at 800 °C (Figure 5). It is assumed that the cracks also affect the strength values unfavourably, which makes the further applicability of these rocks questionable.
Discoloration of the labradorite specimens was observed at 500 °C, probably due to the oxidation of iron-containing minerals in the rock.
At 300 °C and above the granite specimens faded and some of the darker coloured minerals were probably transformed.
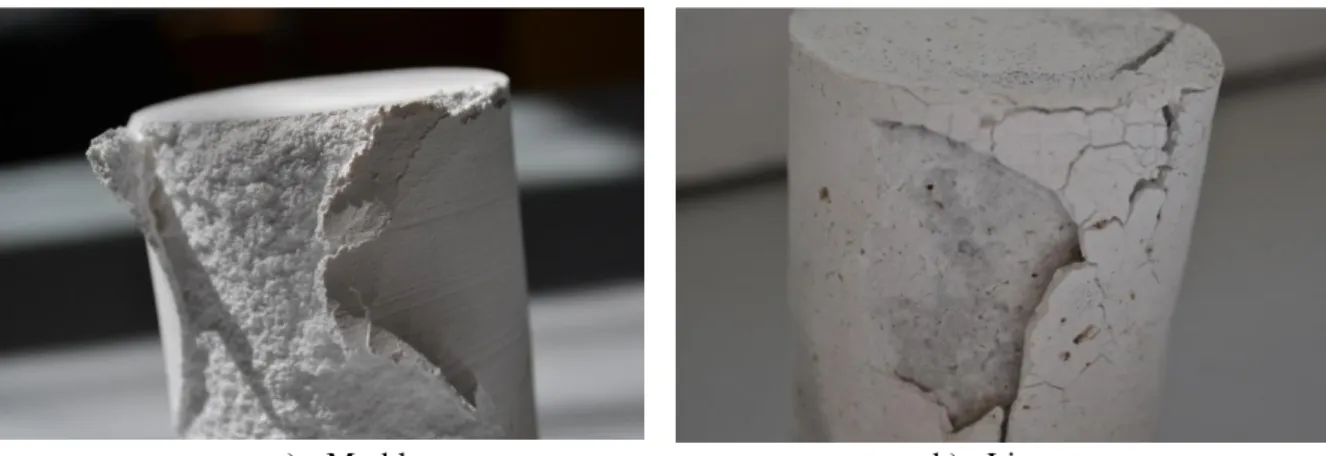
The most noticeable change of the marble was that the stone became matt white. The specimens completely lost their brightness. The strength tests were not made the same day as the heat loading (only the day after), so further changes occurred on the 800 °C temperature loaded CaCO3 based rocks (marble and limestone). The next day, a white powdery layer was observed. This layer could be easily grinded by hand and fell off in pieces thus the geometrical dimensions were difficult to determine for the strength tests. After measuring the geometry, the mass of the removed part (powder) was also measured. The removed part was 5.5 m% for the limestone and 3.1 m% for the marble. Because of the temperature load, calcium carbonate was converted to calcium oxide, which reacted with the moisture in the air and became calcium hydroxide (a part of it at least). This resulted in a 44% increase in volume, causing spalling of the surface. The marble specimens were damaged so intensely that the material could be easily grinded by hand. The phenomenon is shown in Figure 6.
Figure 5: Cracks on 800°C temperature loaded labradorite specimen
a) Marble b) Limestone
Figure 6: Surface spalling on specimens cast for uniaxial compressive strength tests
3.2 Result of compressive strength tests
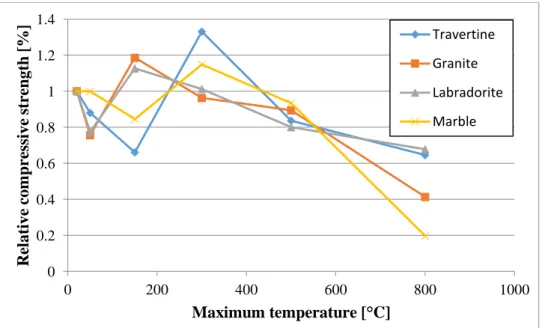
For strength test results we gave the results relative to the measured strength of the reference specimen (20 °C). The relative compressive strength after temperature loading (each point is the average of 3 measurements) is shown in Figure 7.
Figure 7: Relative compressive strength (each point is the average of 3 measurements) The reference values were 63.58 MPa for the travertine, 81.34 MPa for the granite, 61.51 MPa for the labradorite and 59.09 MPa for the marble.
The test results were grouped based on the origin and the base components of the stone. The results of the marble specimens were compared to those of the travertine (CaCO3 and MgCO3 based rocks) and the results of the labradorite specimens were compared to those of the granite (igneous rocks).
The granite behaved favourably up to 500 °C. After being subjected to 500 °C heat load, the decrease in its compressive strength was only 9.6%, but after 800 °C heat-load only 41% relative strength remained. This significant decrease was predictable during the observations as we saw that a lot of cracks appeared at 800 °C. This was a result of the high quartz content of the granite, as the inversion of the α quartz to β quartz happens at 573 °C and it is accompanied by a linear expansion of 0.45%. A local maximum of relative compressive strength can be seen for the granite at 150 °C. Presumably it is due to the release of the absorbed water. The granite had the highest absolute compressive strength values at 20 °C, 50 °C and 150 °C. We observed that the failure always happened on the crystal boundaries. The fracture pattern changed with the increase of the temperature load. When the surface of the specimen was matt, we found that the fracture surface was matt as well.
The labradorite behaved similarly to the granite up to 500 °C, its compressive strength was 80% of the reference value. Similar local maximum can be seen at 150 °C, and it is caused by the release of the absorbed water. There was a significant difference however, the cracks were fewer and thinner than in case of the granite at 800 °C due to the lower quartz content. Therefore, the cracks did not drastically reduce the relative residual compressive strength. In this case the residual strength was 67%. Failure always happened at the crystal boundaries.
The decomposition of the CaCO3 to CaO and CO2 only occurs between 700 and 800 °C, which explained the favourable behaviour of the travertine up to 500 °C. As we saw on the specimens after the 800 °C temperature load only a layer fell off, the chemical reactions did not happen in the inner parts of the specimens. The manner how the structure of the rock affects the speed of these chemical
0 0.2 0.4 0.6 0.8 1 1.2 1.4
0 200 400 600 800 1000
Relative compressive strength [%]
Maximum temperature [°C]
Travertine Granite Labradorite Marble
reactions should be further investigated. It is important that the decrease in strength after temperature loading with 150 °C and the increase after temperature loading with 300 °C were bigger for the travertine than for the marble.
According to the compressive strength test results, the marble was the most sensitive of the rocks to 800 °C temperature load. The relative residual compressive strength was only 20%. The 500 °C test result was 93%, which was 77% in previous studies [3]. This could happen due to the differences of the mineral structure and different chemical composition. The CaCO3 crystals had a more homogenous structure in the marble than in the travertine, which led to more CaCO3 decomposition over the same period of time so the decrease in compressive strength was more significant.
The recording of the lateral and axial deformations made it possible to make the stress-deformation curves, some of the typical ones for each rock at each temperature are shown on Figure 8. The decrease of the stiffness of the rocks was significant only after being exposed to 500 °C and above. At these high temperatures the initial deformations were also bigger, and the typical linear phase was delayed. There were more cracks after high temperature loading which had to close first. Furthermore, it can be stated that during the load, with the increase of heat-load, the curves were much more unevenly formed, there were more breakpoints on them. At 800°C the failure of the specimens (except for the marble because measurement results were so low that they could not be considered after temperature loading with 800 °C) happened with a larger deformation.
In the case of the two igneous rocks the linear slope of the curves varied only slightly up to 300 °C, but both the stiffness (Young’s modulus) and the strength decreased, and the deformations increased significantly at 500 °C and 800 °C. These were true for both igneous rocks, although the decrease in stiffness was bigger for the labradorite after temperature loading with 500 °C, and the decrease in strength was bigger for the granite after temperature loading with 800 °C.
a) Granite b) Labradorite
c) Marble d) Travertine
0 20 40 60 80 100 120
0 0.02 0.04
σ [MPa]
ε [-]
G20 G50 G150 G300 G500 G800
0 20 40 60 80 100 120
0 0.02 0.04
σ [MPa]
ε [-]
L20 L50 L150 L300 L500 L800
0 20 40 60 80 100 120
0 0.02 0.04
σ [MPa]
ε [-]
M20 M50 M150 M300 M500
0 20 40 60 80 100 120
0 0.02 0.04
σ [MPa]
ε [-]
T20 T50 T150 T300 T500 T800
Figure 8: Typical stress-deformation curves by rock type and temperature
The travertine had the biggest deformation of the specimens heated to 800°C, and it had the highest number of breakpoints on the curves out of all the rocks at all temperatures. These breakpoints can be explained by the pores in the travertine. The marble specimens suffered so much damage after temperature loading with 800°C that their stress-deformation curves were useless. After temperature loading with 500°C the initial deformations and the stiffness decreased. At lower temperatures however, only small changes occurred because of the homogenous microcrystal structure.
3.3 Flexural strength test results
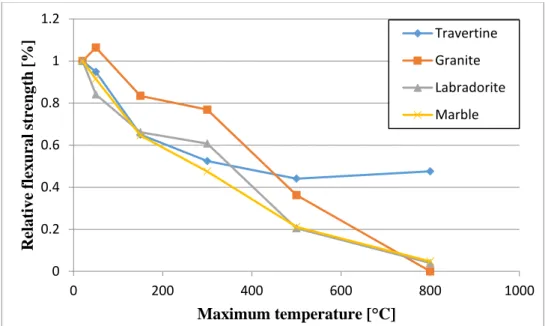
The relative flexural strength results are shown in Figure 9.
Figure 9: Relative flexural strength (each point shows the average of 3 measurements) The reference values were 4.02 MPa for the travertine, 3.41 MPa for the granite, 4.27 MPa for the labradorite and 4.82 MPa for the marble.
Marble had the highest reference flexural strength but the changes in its inner structure resulted in the fastest and most significant absolute decrease.
The initial flexural strength of granites was lower than of the marbles and the relative residual flexural strength was near 0% after the 800 °C temperature load. However, from 50 °C to 300 °C it had the best relative performance of the four rock types and only the travertine had better relative results after temperature loading with 500 °C.
Concerning the rocks that we examined, the travertine had the best overall performance in flexural strength, approximately 50% of the reference value remained at 800 °C. As we mentioned above, the main reason for this was the duration of the heat-load. The inner structure of the limestone was damaged (discoloration, darker surface), but only an outer layer reacted with oxygen completely, and fell off after. Surprisingly we experienced a slight increase in strength from 500 °C to 800 °C, but this can be explained by the low number of samples (the standard deviation was also higher at 800°C).
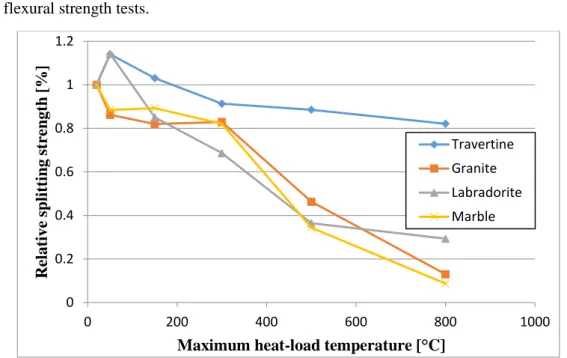
3.4 Splitting strength test results
The relative splitting strength test results are shown in Figure 10.
The reference values were 6.02 MPa for the travertine, 10.29 MPa for the granite, 8.32 MPa for the labradorite and 6.79 MPa for the marble.
0 0.2 0.4 0.6 0.8 1 1.2
0 200 400 600 800 1000
Relative flexural strength [%]
Maximum temperature [°C]
Travertine Granite Labradorite Marble
The splitting strength test results showed similar trends to the flexural strength test results. The main differences were the following:
The granite did not have a better performance at lower temperatures.
The strength of the travertine and of the labradorite had a local maximum at 50 °C.
The relative residual values were at each case higher than the ones measured during the flexural strength tests.
Figure 10: Relative splitting strength (each point shows the average of 3 measurements)
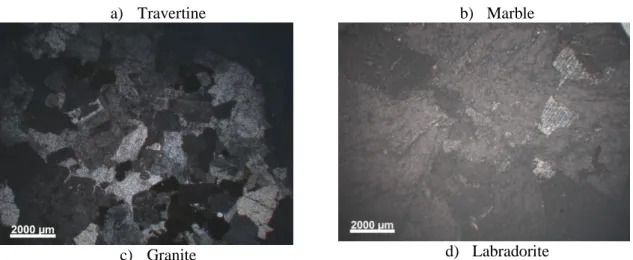
3.5 Microscopic observation
We took pictures of the thin sections with one polarizing filter and two polarizing filters as well (Figure 11). One can see the crystal structure in the pictures taken with one polarizing filter and the mineral composition in the picture taken with two filters.
The homogenous, porous texture with scattered calcites could be seen for the travertine.
The marble had a microcrystalline texture with small, not crystallized parts.
The quartz crystals in the granite were loosened, but there were various plagioclases and coloured envelopes.
Images of the labradorite showed an orientation in the minerals. There were big plagioclases (compared to crystals of the other rocks) and scattered coloured envelopes. It was very compact, its pore content was very low, loosening was not visible.
0 0.2 0.4 0.6 0.8 1 1.2
0 200 400 600 800 1000
Relative splitting strength [%]
Maximum heat-load temperature [°C]
Travertine Granite Labradorite Marble
a) Travertine b) Marble
c) Granite d) Labradorite
Figure 11: Microscopic pictures taken with two polarization filters (reference temperature)
3.6 Results of derivatographic analysis
Milled samples were tested by Q-1500D type derivatograph. The results are shown in Figures 12, 13, 14 and 15.
The derivatograms of the granite and the labradorite were typical for igneous rocks. There was only one thermal decomposition peak for the granite and the labradorite, which was the release of the absorbed water.
The marble and the travertine showed similarities on their derivatograms. The derivatograms of the marble and of the travertine had two thermal decomposition peaks each:
Peak 1: Release of absorbed water
Peak 2: Decomposition of CaCO3 (
CaCO
3 CaO + CO
2)
According to the weight evaluation of the marble and the travertine, the emission of CO2 was higher for the travertine, suggesting that the CaCO3 content of the travertine sample was higher. This was predictable because marble may contain MgCO3 as well. The decomposition of MgCO3 only happens at higher temperatures. The same result was shown by the weight of the spalling material after the 800
°C heat-load.
Figure 12: Derivatogram of the granite
Figure 13: Derivatogram of the labradorite
Figure 14: Derivatogram of the marble
Figure 15: Derivatogram of the travertine
4. CONCLUSIONS
Our experimental study was made with four types of stones, which are frequently used in Hungary.
During selection of the stone types, we have considered the formation of the stones, both sedimentary, igneous and metamorphic stones were tested.
The following stones were tested:
Rosa Beta granite: felsic, intrusive, igneous rock, granular and phaneritic in texture,
Labradorite (from Pakoslawice, Poland): intrusive igneous rock, phaneritic in texture,
Travertine (Haraszti mine, Hungary): sedimentary, carbonate rock,
Marble (Carrara): metamorphic, recrystallized carbonate minerals.
The geometric parameters of the specimens and the applied tests were:
d=50 mm, h=60 mm cylinders to measure uniaxial compressive strength tests,
d=50 mm, h=30 mm cylinders for Brazilian (splitting strength) tests,
a=150 mm, b=50 mm, c=25 mm for three-point bending tests.
We exposed the specimens to 50, 150, 300, 500, and 800 °C and there were reference specimens as well (20 °C). For each temperature level and test type three-three specimens were tested, altogether 216 specimens were used.
Based on our experiments, at lower temperatures (300 °C and below) granite had the best results in case of compressive strength and splitting strength test, even though the loosened quartz crystals could be seen on the thin sections cut from the reference samples. Flexural strength was also satisfactory up to 300°C but a significant decrease could be noticed after temperature loading with 500 °C for all the three test types. After temperature loading with 800 °C only the strength of the marble was lower than the strength of the granite. The changes in stiffness had the same trends as in compressive strength.
The unfavourable results after temperature loading with 800 °C could be explained by the inversion of the quartz crystals, which is accompanied by 0.45% linear expansion. This volume increase of the quartz crystals created cracks in the rock caused rapid decrease of the strength of it.
The labradorite behaved in a similar manner as the granite in many aspects, but its crystals were bigger, and its quartz content was lower, so the above-mentioned inversion could not damage the texture of the rock that much. The absolute and the relative compressive strength results of the labradorite were the highest of the four rocks at 800°C. The most important inner change was the oxidation of the iron containing minerals. For bending it behaved similarly to marble, the curves of change of relative strength were almost parallel, but after temperature loading with 300°C the relative flexural strength of the labratorite was slightly higher.
For the marble the homogenous microcrystalline texture with several not crystallized parts could be seen under the microscope. In this case the sudden decrease in strength after temperature loading with 800°C is caused by decomposition of the CaCO3 to CaO and CO2. This decomposition caused an outer layer to fall off from the specimens. Some of the CaO reacted with the moisture in the air becoming Ca(OH)2. There was a specimen in which the 800°C heat load itself caused failure. At 800°C the marble specimens provided the lowest strength results of all examined rocks. There was one exception however, the relative residual flexural strength of the marble was 4.7%, while it was 3.9% for the labradorite and nearly 0% for the granite, but in this case all these three stones had very small residual strength. Between 50 °C and 300 °C, the flexural strength of the marble decreased monotonously with the increasing heat load, while the splitting strength was quasi constant with little decrease. For bending, the marble had the highest reference strength values, but for splitting we got lower initial results compared to the two igneous rocks. The trends of Young’s moduli were again similar to the
trends of the compressive strengths. The reference value for Young’s modulus was 17000 MPa, the residual value after temperature loading with 800 °C was 635 MPa.
The travertine was considered to be homogenous, but it was porous as it could be seen under the microscope. The decomposition of the CaCO3 caused a significant decrease in strength and stiffness after temperature loading with 800°C (similarly to what was seen in case of the marble). It also caused an outer layer to fell off after the heat-load. At the highest tested temperature, this rock behaved the best of the four materials tested for all three strength tests. On the other hand, Young’s modulus, although it was initially the largest, was eventually very low after temperature loading with 800 °C, while the igneous rocks remained stiffer. For splitting strength, the absolute values were from 500°C, the relative values were from 50°C the best of all 4 rocks tested. After temperature loading with 800°C the residual splitting strength of the travertine was 82%. For flexural strength the travertine gave the best results after temperature loading with 500°C and above, the relative residual strength was 47% at the highest tested temperature. We experienced a slight increase in flexural strength from 500 to 800
°C, but this could be explained by the low number of the specimens. In the case of compressive strength this rock had more variation than the marble but had similar trends up to 500 °C. On the other hand, at the highest temperature it did not decrease as drastically and gave somewhat the same absolute and relative results as the labradorite (41 MPa and 64%). Despite the fact that the same chemical process took place in travertine and in marble, their behaviour was very different. Further examination is needed to analyse the influence of the inner structure on the speed of the chemical reaction, and by change of the duration of the temperature load, to see how it affects the strength of the travertine.
Although several rocks could meet the requirements of strength after being exposed to temperatures, the aesthetic aspects may lead to the replacement or to the polish of the rock, because of the discoloration and loss of brightness at lower temperatures.
5. ACKNOWLEDGEMENT
This research was also supported by the János Bolyai Research Scholarship of the Hungarian Academy of Sciences. The research reported in this paper was supported by the Higher Education Excellence Program of the Ministry of Human Capacities in the frame of the Water sciences & Disaster Prevention research area of the Budapest University of Technology and Economics (BME FIKP-VÍZ).
6. REFERENCES
![Figure 1: Fire of the Windsor Castle [1]](https://thumb-eu.123doks.com/thumbv2/9dokorg/1066842.70815/2.892.231.660.491.754/figure-windsor-castle.webp)