Total absorption γ -ray spectroscopy of the β -delayed neutron emitters
137I and
95Rb
V. Guadilla,*J. L. Tain, A. Algora,†J. Agramunt, D. Jordan, M. Monserrate, A. Montaner-Pizá, E. Nácher,‡ S. E. A. Orrigo, B. Rubio, and E. Valencia
Instituto de Física Corpuscular, CSIC-Universidad de Valencia, E-46071 Valencia, Spain
M. Estienne, M. Fallot, L. Le Meur, J. A. Briz, A. Cucoanes, A. Porta, T. Shiba, and A.-A. Zakari-Issoufou Subatech, IMT-Atlantique, Université de Nantes, CNRS-IN2P3, F-44307 Nantes, France
A. A. Sonzogni
NNDC, Brookhaven National Laboratory, Upton, New York 11973-5000, USA
J. Äystö, T. Eronen, D. Gorelov, J. Hakala, A. Jokinen, A. Kankainen,§V. S. Kolhinen, J. Koponen, I. D. Moore, H. Penttilä, I. Pohjalainen, J. Reinikainen, M. Reponen, S. Rinta-Antila, K. Rytkönen, V. Sonnenschein, and A. Voss
Department of Physics, University of Jyväskylä, 40014, Jyväskylä, Finland L. M. Fraile and V. Vedia
Grupo de Física Nuclear and IPARCOS, Universidad Complutense de Madrid, CEI Moncloa, E-28040 Madrid, Spain E. Ganio˘glu
Department of Physics, Istanbul University, 34134 Istanbul, Turkey W. Gelletly
Department of Physics, University of Surrey, GU2 7XH Guildford, United Kingdom M. Lebois and J. N. Wilson
Institut de Physique Nuclèaire d’Orsay, 91406 Orsay, France T. Martinez
Centro de Investigaciones Energéticas Medioambientales y Tecnológicas, E-28040 Madrid, Spain
(Received 8 July 2019; published 9 October 2019)
The decays of theβ-delayed neutron emitters137I and 95Rb have been studied with the total absorption γ-ray spectroscopy technique. The purity of the beams provided by the JYFLTRAP Penning trap at the ion guide isotope separator on-line facility in Jyväskylä allowed us to carry out a campaign of isotopically pure measurements with the decay total absorptionγ-ray spectrometer, a segmented detector composed of 18 NaI(Tl) modules. The contamination coming from the interaction of neutrons with the spectrometer has been carefully studied, and we have tested the use of time differences between promptγrays and delayed neutron interactions to eliminate this source of contamination. Due to the sensitivity of our spectrometer, we have found a significant amount ofβ intensity to states above the neutron separation energy that deexcite byγ rays, comparable to the neutron emission probability. The competition between γ deexcitation and neutron emission has been compared with Hauser-Feshbach calculations, and it can be understood as a nuclear structure effect. In addition, we have studied the impact of the β-intensity distributions determined in this work on reactor decay heat and reactor antineutrino spectrum summation calculations. The robustness of our results is demonstrated by a thorough study of uncertainties and with the reproduction of the spectra of the individual modules and the module-multiplicity gated spectra. This work represents the state-of-the-art of our analysis methodology for segmented total absorption spectrometers.
DOI:10.1103/PhysRevC.100.044305
*Present address: Subatech, IMT-Atlantique, Université de Nantes, CNRS-IN2P3, F-44307 Nantes, France; guadilla@ific.uv.es
†Also at Institute of Nuclear Research of the Hungarian Academy of Sciences, Debrecen H-4026, Hungary.
‡Also at Instituto de Estructura de la Materia, CSIC, E-28006 Madrid, Spain.
§Also at University of Edinburgh, Edinburgh EH9 3JZ, United Kingdom.
I. INTRODUCTION
Neutron-rich nuclei far from stability may exhibitβ-decay energy windowsQβ larger than the neutron separation energy Sn in the daughter nucleus. In those cases with Qβ >Sn, neutron emission competes strongly withγ-ray emission in the deexcitation of excited levels populated above Sn in the βdecay. This decay mode, known asβ-delayed neutron emis- sion, was discovered in 1939 by Robertset al.[1] and becomes dominant when the neutron excess is sufficiently large.
The β-delayed neutron emission process plays an im- portant role in stellar nucleosynthesis. Heavy nuclei beyond iron can be produced by means of the rapid-neutron-capture process, the so-called r-process [2]. The main characteristic of the r-process is the availability of a large number of neutrons that are added in a short time interval to elements of the iron group in successive neutron capture processes followed by β decays. Very neutron-rich nuclei, includingβ-delayed neutron emitters, up to the (trans-)actinide regions at A≈300 are formed in this way. Core collapse supernovae of massive stars or neutron star mergers have been considered as possible astrophysical sites for the r-process. Recently, the combined detection of gravitational waves and electromagnetic radiation from the GW170817 neutron star merger, gave support to the idea that such mergers are important sources of r-process elements [3].
The detailed study of the r-process requires nuclear data such as nuclear masses, half-lives (T1/2),β-delayed neutron emission probabilities (Pn), and neutron capture (n, γ) reac- tion cross sections [4] for nuclei far away from stability. In spite of considerable experimental effort, a large amount of data is still lacking and is thus obtained theoretically from nuclear models.
In the case of (n, γ) cross sections, when no experimen- tal information is available, statistical calculations using the Hauser-Feschbach formalism (HFF) [5] are used. These cal- culations rely on parameters obtained close to the valley of β stability for nuclear level densities (NLD), photon strength functions (PSF), and neutron transmission coefficients (NTC) [6]. In recent years the connection between the β-delayed neutron emission process and (n, γ) reactions as a possi- ble source of experimental information has been highlighted [7–10]. In both processes resonant states that decay either by γor neutron emission are populated, though they usually have different spin-parity values. The experimental difficulty when taking advantage of this connection is related to the accurate measurement of the β intensity followed by γ emission aboveSn. Traditional high-resolution experiments with HPGe detectors have been shown to be limited in determining β intensity at high excitation energies. This is due to the so- called pandemonium effect [11], associated with the limited efficiency of such detectors. The total absorptionγ-ray spec- troscopy (TAGS) technique allows one to overcome this effect and it has proven to be capable of extracting theβ intensity followed by γ rays above Sn in previous works [7,8,12,13].
This technique uses large scintillator crystals covering almost the full solid angle in order to maximize the γ-detection efficiency. The sum of the γ rays deexciting each level fed in the daughter nucleus is detected, instead of the individualγ
rays. The TAGS technique allows one to obtain theβ-intensity distribution followed byγ-ray emission,Iβγ, by means of a deconvolution process.
On the other hand, in the case of T1/2 and Pn values, predictions from quasiparticle random-phase approximation (QRPA)β-strength calculations [14,15] have been compared in recent years with experimental results to test the accuracy of the nuclear models. A more stringent cross-check implies a comparison of calculated and measuredβ-strength distribu- tions, since they are particularly sensitive to the details of the nuclear model. A key ingredient to determine theβ-strength distributions are the β intensity probabilities, which can be obtained free from the pandemonium effect with TAGS, as mentioned above.
The β decay of fission fragments plays a crucial role in nuclear reactors, where on average six β decays follow each fission reaction. A precise knowledge of the energy released by their radioactive decay, the so-called decay heat (DH), turns out to be important in order to maintain the safe operation of a reactor after shutdown. Furthermore, it can help to understand the occurrence of accidents, as shown in the case of the Fukushima-Daiichi plant [16], a consequence of the noneffective dissipation of the DH in the reactor core and in the adjacent cooling pool for spent fuel. In addition, predictions of the DH associated with innovative fuels and reactors are needed.
Apart from its importance for the safe operation of reactors, accurate information on the β decay of the resulting fission fragments can be used to improve our understanding of the reactor antineutrino spectrum, important for reactor-based antineutrino experiments on fundamental neutrino physics [17–19] and for reactor monitoring [20]. The standard ap- proach used in antineutrino spectrum calculations is based on the conversion of integralβ-spectra measurements for the main fissile isotopes [21,22]. However, the recent observation of discrepancies between experimental data and calculations of the absolute flux [23] and shape [24–26] of the reactor antineutrino spectrum has encouraged further improvements in the alternative summation approach, which relies on the information from nuclear databases. In this approach, the total antineutrino spectrum is calculated as the sum of the antineu- trino spectra associated with the decay of each fission product weighted by the corresponding activity. The antineutrino spec- trum for each decay is constructed by using the β-intensity probabilities. An improvement in the summation method from the point of view of decay data consists of the provision of data free from the pandemonium effect [27]. The same applies for the calculation of the reactor DH, where a summation over the inventory of fission products provides an alternative to integral measurements. The DH as a function of time is computed by summing the energy released by the decay of each nucleus (averageγandβenergies forβ-decaying nuclei) weighted by the activity at this time. For the calculation of the average energies, theβ-intensity distributions are needed, so that the use ofβ intensities suffering from pandemonium effect limits the accuracy of such calculations [28].
Here we study the decays of two importantβ-delayed neu- tron emitters by means of the TAGS technique: the decay of
137I (Qβ =6.027(8) MeV [29]) into137Xe (Sn=4.025 MeV
[30]) and the decay of 95Rb (Qβ=9.228(21) MeV [29]) into95Sr (Sn=4.348(7) MeV [31]). The decay properties of their respectiveβ-n branches (neutron emission probability, neutron branching to states in the final nucleus and neutron spectra) are well known; hence one can make a detailed study of the neutron-γcompetition.137I is identified as an important contributor to the reactor DH and to the reactor antineutrino spectrum. In fact, a high priority has been assigned to mea- surements of this decay with the TAGS technique by the International Atomic Energy Agency (IAEA) [32]. Although
95Rb has a smaller contribution to the total decay energy released in a reactor, its large Qβ value makes it a good candidate for investigating the pandemonium effect.
The paper is organized as follows. In Sec.IIwe describe the experimental measurements of these decays and in Sec.III a detailed discussion of the TAGS analyses will be presented.
The competition between neutron emission andγ-ray emis- sion will be addressed in Sec.IV. In Sec.Vwe compare the β energy spectra obtained from the results of this work with previous measurements, as well as the new averageβ andγ energies with previous values. Finally, in Sec.VIthe impact of these results in reactor DH and reactor antineutrino spectrum summation calculations will be discussed.
II. EXPERIMENT
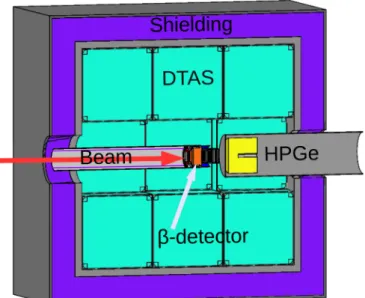
A campaign of measurements, including 137I and 95Rb decays, was carried out in 2014 at the upgraded Ion Guide Iso- tope Separator On-Line (IGISOL) facility at the University of Jyväskylä [33]. We employed the new Decay Total Absorption γ-ray Spectrometer (DTAS), composed of 18 NaI(Tl) crystals [34]. In the set-up a plasticβdetector of 3 mm thickness was located close to the center of DTAS, and a HPGe detector was placed behind theβ detector. A schematic picture of the set-up can be seen in Fig.1. The fission ion guide was used to extract the nuclei produced by 25-MeV proton-induced fission on natural uranium. The IGISOL separator magnet was employed to separate the radioactive nuclei based on their mass-to-charge ratio before using the double Penning trap system JYFLTRAP [35] for isobaric separation. The ions extracted from the trap were implanted on a computer magnetic tape placed in front of the plasticβdetector. A tape transport system was employed to remove the activity from DTAS during the measurements. The collection cycles of the tape transport system were selected to allow the reduction of the descendant activity in the measurements. For the de- cay of137I (T1/2=24.5(2) s [30]) the collection cycle was
≈4×T1/2, while for 95Rb (T1/2=377.7(8) ms [31]) it was
≈7×T1/2.
A. Experimental spectra
A coincidence between DTAS and the β detector was required to get a spectrum free from environmental back- ground. The total sum energy of DTAS was reconstructed off- line from the signals in the individual modules as described in Ref. [36], with threshold values of ≈90 keV for DTAS modules and≈70 keV for the β detector. Standard calibra- tion sources were used to obtain the energy and resolution
FIG. 1. Partial view of a longitudinal cut in a drawing of the ex- perimental set-up. The following elements are depicted: the NaI(Tl) crystals of DTAS (in green) surrounded by the lead shielding (in violet), the beam pipe to the left (in gray), the plastic detector with its light guide close to the center (in orange), and the HPGe detector to the right (in yellow). The red arrow represents the beam direction and indicates the implantation point.
calibration of DTAS (22Na,60Co,137Cs, and a mixed source of152Eu-133Ba), as well as a24Na source produced by means of a (p, 2p) reaction on natural Mg [36]. There are three main sources of contamination in our TAGS spectra that need to be corrected: (1) the summing-pileup distortion, (2) the activity of the descendants, and (3) the contribution of the β-delayed neutrons interacting with the detector. The first two are discussed here, while the third one is discussed in Sec.II B.
The summing-pileup distortion was calculated as in pre- vious works [8,37–39], with a Monte Carlo (MC) procedure based on the random superposition of two stored events within the analog-to-digital converter (ADC) gate length [36,40].
The decay of 137Xe (T1/2=3.818(13) min [30]) was measured and its contribution to the measurement of 137I was calculated using the γ transition at 455.5 keV from the decay of 137Xe as normalization. In the case of 95Rb, both the daughter (95Sr, with T1/2=23.90(14) s [31]) and the granddaughter (95Y, withT1/2=10.3(1) min [31]) con- taminate the measurement. Both decays were measured, and their contribution was estimated with the help of the Bateman equations. Contaminant fractions of 3.13% and 0.38% were calculated for daughter and granddaughter respectively. The contamination of95Y in the measurement of95Sr (3.96%) was also taken into account in the same way.
B. β-Delayed neutron background
β-Delayed neutrons interact with the NaI(Tl) material of the detector producingγ rays, either in an inelastic reaction or after neutron capture, that are easily detected in DTAS. The most clear evidence of these interactions is a structure in the
Energy [keV]
0 2000 4000 6000 8000 10000
Counts
1 10 10
210
310
4 TAGS spectrum:Experiment
from Kratz MC with In
from ENSDF MC with In
95
Rb
837 keV
capture Neutron
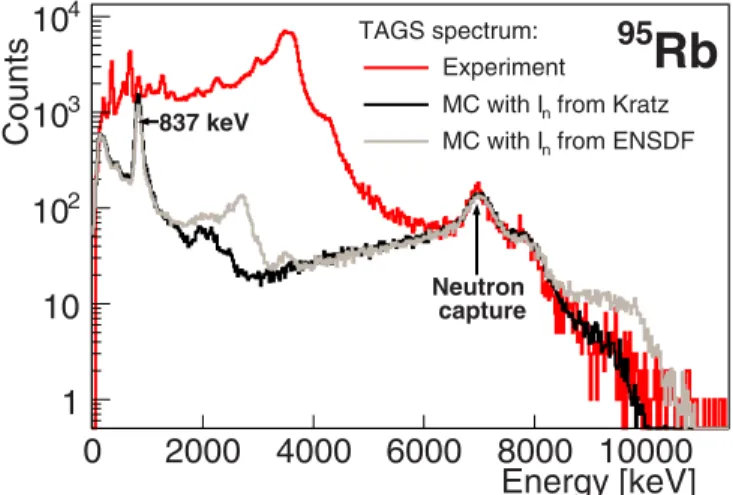
FIG. 2. Comparison of the effect in the simulation of the β- delayed neutron branch in the decay of 95Rb of two different In
distributions. The experimental β-gated TAGS spectrum for this decay is shown together with MC simulations of theβ-nbranch. See text for details. The MC spectra are normalized to the experimental spectrum around 6.8 MeV (the neutron capture peak indicated with an arrow). The 836.9-keVγ-ray peak from the first excited state in
94Sr is highlighted.
spectra above 6.8 MeV, mainly due to neutron capture on the
127I of the NaI(Tl) crystals, that can be seen in Fig. 2. On the other hand,γ rays from inelastic scattering, less evident, concentrate at low energy. This contamination was treated in two different ways. In the first method it is calculated using dedicated MC simulations. In the second method we exploit the fact thatγrays from neutron interactions are delayed, due to the low velocity of the neutrons, with respect to promptγ rays emitted after the decay.
1. MC simulation ofβ-delayed neutrons
The simulation of the contamination due to theβ-nbranch was done using the Geant4 simulation code [41] and the DECAYGEN event generator, as described in Ref. [36]. The generator uses the β-intensity distribution followed by neu- tron emission,Iβn, that was reconstructed from the measured neutron spectra using the information on neutron branching ratios to the excited levels in the final nucleus,In. The neu- tron spectra are obtained from ENDF/B-VII.0 [42], based on an evaluation of experimental data [43]. In the case of
95Rb the experimental information is complemented at high energies (from 1.8 MeV) with QRPA and Hauser-Feshbach theoretical calculations [44]. For 137I the neutron spectrum directly provides Iβn since neutron emission proceeds to the
136Xe ground state (g.s.) only. For 95Rb there are several measurements of the neutron branching In to the different levels in 94Sr [45–47], and they are summarized in TableI.
The values quoted in ENSDF [48] are based on the work of H. Gabelmann [47] that supersedes the results of K.-L. Kratz et al.[46], a previous work by the same group. However, we observe that our experimental spectrum is compatible with the simulation performed using the intensities coming from the earlier work but not with the one using theInfrom ENSDF, as
TABLE I. β-delayed neutron intensities (In) for the decay of95Rb into94Sr. Different experimental results are presented together with the ENSDF evaluation [48] based on the results of H. Gabelmann [47]. In the work of K.-L. Kratzet al. an intensity of2.0% to levels above 2.650-MeV excitation energy is also mentioned.
Energy In(%)
(keV) Hoff [45] Kratz [46] Gabelman [47] ENSDF [48]
0.0 67.0(40) 66.5(25) 68.0(20) 67.6(20)
836.9 29.0(40) 28.8(26) 21.0(10) 20.9(10)
1682.0 − ≈1.5 − −
1926.3 2.6(5) 1.3(4) 0.5 0.5
2055.0 − ≈0.5 − −
2146.0 − 1.2(4) 0.1 0.5
2271.2 − 0.9+0.3−0.6 − −
2414.1 <2.0 0.7(3) 2.0(5) 2.0(5)
2603.9 <0.3 0.3(2) 1.9(5) 1.9(5)
2614.1 − − 1.3(5) 1.3(5)
2649.8 − 0.2(2) 1.0(5) 1.0(5)
2703.9 − − 1.3(5) 1.3(5)
2710.6 − − 0.8(5) 0.8(5)
2739.2 − − 0.9(5) 0.9(5)
2929.8 − − 0.9(5) 0.9(5)
3438.6 − − 1.0(5) 1.0(5)
shown in Fig.2. The data from P. Hoff [45] give also a good reproduction of our spectrum, although they are considered less complete. As presented in TableItheIn to levels above 2649.8 keV amounts 4.9% in the work of H. Gabelmann [47], while in the work of K.-L. Kratzet al.[46] it is stated to be 2.0%. Theγrays emitted in the deexcitation of these levels above 2649.8 keV are summed with theγ rays produced after the neutron capture in the127I of the NaI(Tl) crystals, thus producing the bump at high energies (8–10 MeV) not followed by our experimental data.
As discussed in Ref. [36], a 500-ns time window for accumulation of the energy deposited in DTAS was used for both the experimental spectra and in the MC simulations.
This time is enough to allow the full energy deposition ofβ delayed neutron-induced γ rays. The simulatedβ-n branch has been normalized to match the low-energy tail of the experimental neutron capture peak at≈6.8 MeV (see Fig.2).
In95Rb this normalization matches at the same time the peak corresponding to the 836.9 keVγ ray, emitted from the first excited state in94Sr, which is populated in theβ-ndecay (see Fig.2).
2. Time discrimination of neutrons
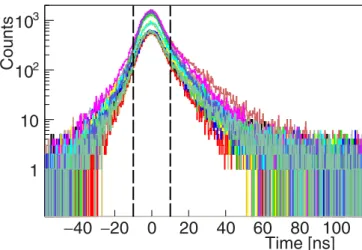
As discussed in Ref. [34], one can use the timing informa- tion betweenγrays detected in DTAS andβparticles detected in the plastic scintillation detector in order to distinguish whetherγ rays are coming from neutron interactions or from the β decay. Time correlation spectra t =tDTAS−tplastic were reconstructed for the individual modules as shown in Fig.3. For convenience the peak positions of all spectra are aligned to zero applying an offset. We found that a time gate of 20-ns length (i.e.,±10 ns with respect to zero) is adequate
Time [ns]
− 40 − 20 0 20 40 60 80 100
Counts
1 10 10
210
3FIG. 3. Individual time correlation spectra between each of the 18 modules and the plastic detector for the decay of137I. The prompt gate of 20 ns (±10 ns) is indicated with vertical dashed lines.
to separate prompt contributions and delayed ones (those with
|t|>10 ns). As shown in Fig.4 the neutron capture peak disappears when we use the prompt gate. Unfortunately this gate impairs the reconstruction of the low energy part of the spectra [compare the light gray and the black spectra in Fig.4(top)]. This is related to the relatively poor individual timing resolution of around 20 ns, which was not properly optimized in the present measurements and is much worse than the 5 ns reported in Ref. [34] for the DTAS prototype module. As a consequence, the effective energy threshold is increased, affecting the sum energy reconstruction. In fact, in the measurement of95Rb the intenseγ ray of 204.0-keV energy is cut with this procedure [as can be seen in Fig. 4 (bottom)], and we estimate that the effective threshold is about 280 keV instead of 90 keV. As we will show later, this has an impact on the determination of theβ intensity distribution.
In the future, a proper optimization of the individual timing resolution and the use of narrower gates, could make this a better method than the MC simulation method for the study of isotopes with very large neutron emission probabilities or unknownβ-ndecay properties.
III. TAGS ANALYSES
In the analysis we follow the method developed by the Valencia group to determine theβ-intensity distributions in TAGS experiments [49–51]. For that, we have to solve the following inverse problem [50]:
di=
j
Ri j(B)fj+Ci, (1) wheredi represents the number of counts in channeliof the experimental spectrum, fj is the number of events that feed level j in the daughter nucleus,Ci is the contribution of all contaminants to channel i, and Ri j is the response function of the spectrometer, that depends on the branching ratios (B) between the states in the daughter nucleus. The branching ratio matrix is calculated using the known decay information for the levels at low excitation energy complemented with
Energy [keV]
0 2000 4000 6000 8000
Counts
1 10 102
103
All
Prompt Delayed
137I
Energy [keV]
0 2000 4000 6000 8000 10000
Counts
1 10 102
103
All
Prompt Delayed
95Rb
FIG. 4. Effect of different time correlation windows t= tDTAS−tplasticon theβ-gated DTAS spectrum for the decays of137I (top) and 95Rb (bottom). Prompt gate (t20 ns) in light gray and delayed gate (t>10 ns) in dark gray. The spectrum in red corresponds to a gate oft=500 ns that covers both the prompt and the delayed signals.
an estimate based on the nuclear statistical model at high excitation energy.
According to the Reference Input Parameter Library (RIPL-3) [52], the level scheme of 137Xe is complete up to a level at 2726.1 keV, whereas for95Sr it is only considered complete up to a level at 1259.7 keV (from these energies Excut onward RIPL-3 considers that levels are missing in the known level scheme). These limits define the known parts of the branching ratio matrices for the two cases studied (we will refer to known part of the level scheme equivalently to complete part of the level scheme in the sense of RIPL-3). For
137Xe we considered, in addition, two alternative known parts of the level scheme: up to the level at 2244.1 keV, where there is good agreement between the experimental number of levels and the prediction of the statistical model (see Fig. 5), and up to the level at 1534.3 keV, where there is a substantial gap to the next level at 1621.1 keV.
In all cases, from the last known level included in the known level scheme up to the Qβ value (maximum decay energy window), a continuum region with 40 keV bins is defined. The branching ratios in this continuum region are de- termined with the statistical model, as presented in Ref. [51].
Energy [keV]
0 1000 2000 3000 4000 5000 6000
Accum. levels
1 10 102
103
104
105
106
107
Q
βS
n137 Xe
HFB (RIPL3) HFB (modified) Experimental
FIG. 5. Accumulated number of levels as a function of exci- tation energy for 137Xe. The dotted-blue line is the experimental information obtained from ENSDF. The gray line corresponds to the HFB level density as obtained from RIPL-3. The black line comes from the HFB level density modified to reproduce the experimental information both at low and high energies. The three vertical dotted red lines represent the three limits considered for the known part of the level scheme. See text for details.
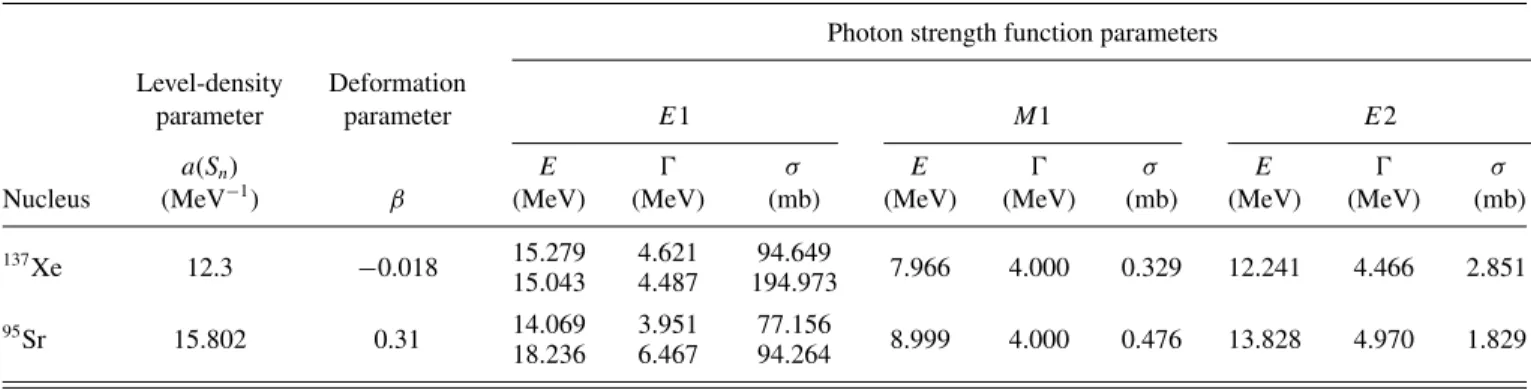
All parameters used for the statistical model calculations are extracted from RIPL-3 [52] and summarized in Table II, with PSF and deformation parameters based on Ref. [53] and Ref. [54], respectively. The level-density parameter “a” at the neutron binding energy used to calculate the E1 γ-strength function is obtained from enhanced generalized superfluid model (EGSM) calculations for 95Sr [52], while for 137Xe it is taken from B. Fogelberg et al.[55]. The Hartree-Fock- Bogoliubov (HFB) plus combinatorial model nuclear level densities [56,57] have been used. For the level density of
95Sr theC andP correction parameters from RIPL-3 were used (0.0 and 0.78795, respectively). However, since the level-density correction factors for 137Xe in RIPL-3 (C= 2.96189 and P=1.09479) did not reproduce the available experimental information, we have calculated new corrections (C= −1.02 and P=0.69). In particular, the experimental number of resonances in137Xe in the region 4.03–4.53 MeV, just above Sn, according to the experimental work of B.
Fogelberget al.[58] is4 1/2+levels, (24±8) 1/2−levels,
and (16±5) 3/2−levels. With the original correction factors from RIPL-3 one obtains unrealistically large values: 618 1/2+levels, 12630 1/2−levels, and 24722 3/2− levels. The new correction factors have been calculated to obtain a more reasonable number of levels in the resonance region: 2.6 1/2+ levels, 12 1/2−levels, and 24 3/2− levels. In addition, both sets of correction factors reproduce the accumulated number of levels at 1808.8 keV. A comparison of the original level density and the modified one for137Xe is shown in Fig.5. We should mention that the analysis of the DTAS spectra using the original level density did not allow a good reproduction of the experimental spectrum (see Sec.III A).
Once the branching-ratio matrix is constructed, the re- sponse functionRi j(B) is calculated by means of MC simu- lations [49]. The detailed description of the geometry of the set-up and the nonproportionality of the light yield in NaI(Tl), as described in Ref. [49], are included in the simulations.
The MC simulations were validated by comparison with mea- surements of well-known radioactive sources [36]. The TAGS analysis is then carried out by applying the expectation maxi- mization (EM) algorithm to extract theβ-feeding distribution [50].
The branching ratio matrix constructed combining the information from the statistical model and the known level scheme, provides a realistic estimate of the true branching ratio matrix. Differences in model branching ratio matrices can appear not only because of the use of different nuclear statistical model parameters but also because of ambiguities in the spin-parity values of levels in the known part of the level scheme. The impact of different choices of parameters can be used to estimate systematic uncertainties in the resulting β-intensity distribution, as will be shown later. In fact, some choices can be ruled out because they do not lead to a good reproduction of the total absorption spectrum. In this respect, a significant advance in the TAGS technique is the introduction of segmented spectrometers like DTAS. The model branching ratio matrix can now be subjected to more restrictive tests, using the reproduction of the individual-module spectra and the module-multiplicity gated total absorption spectra as ad- ditional analysis criteria (where the module-multiplicity of an event,Mm, is defined as the number of modules that fire above the threshold). All these tests improve significantly the reliability of the results, and they can provide a guide for empirical modification of the branching ratio matrix.
TABLE II. Parameters used in the statistical model calculation of the branching ratio matrix (B) of the daughter nuclei.
Photon strength function parameters Level-density Deformation
parameter parameter E1 M1 E2
a(Sn) E σ E σ E σ
Nucleus (MeV−1) β (MeV) (MeV) (mb) (MeV) (MeV) (mb) (MeV) (MeV) (mb)
15.279 4.621 94.649
137Xe 12.3 −0.018 7.966 4.000 0.329 12.241 4.466 2.851
15.043 4.487 194.973 14.069 3.951 77.156
95Sr 15.802 0.31 8.999 4.000 0.476 13.828 4.970 1.829
18.236 6.467 94.264
Energy [keV]
0 1000 2000 3000 4000 5000 6000 [%] βI
−3
10
−2
10
−1
10 1 10
2726 keV
x ≤ Ecut
2244.1 keV
x ≤ Ecut
1534 keV
x ≤ Ecut
FIG. 6. Comparison of theβintensities obtained for the decay of
137I using three different excitation energy limits in the137Xe known level scheme considered (Excut).
A. Decay of137I
The tentative spin-parity value of the ground state (g.s.) of137I, according to ENSDF, is (7/2+), based on systematics [30]. In the analysis we used the value 7/2+ as the primary choice and we considered decays by allowed transitions and first forbidden transitions to states in the known part of the level scheme, while only allowed transitions were considered to states in the continuum. Alternative g.s. spin-parity values of 7/2− and 5/2+ were also used to construct alternative branching ratio matrices that also gave a reasonable repro- duction of the total absorption spectrum. The associated β intensities were considered in the evaluation of uncertainties.
The three different choices for the known part of the level scheme in 137Xe mentioned above were also investigated.
They were found to be equivalent, although the best re- production of the total absorption spectrum was obtained with the known level scheme extending up to 2726.1 keV.
Moreover, this choice was shown to reproduce better the module-multiplicity gated spectra, as will be discussed later.
A comparison of theβintensities obtained with the three level schemes is shown in Fig.6.
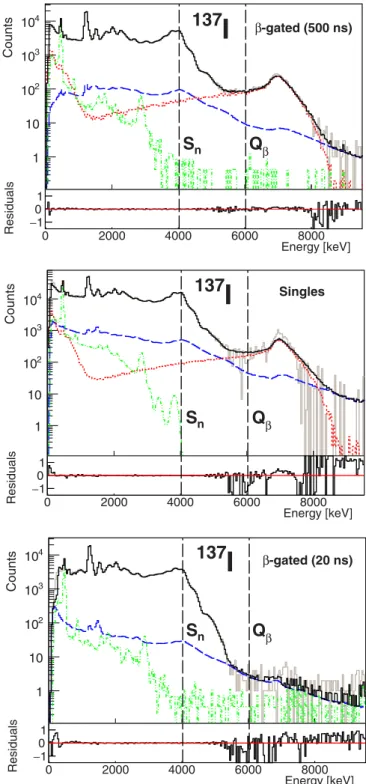
In Fig.7we show the quality of the analysis by comparing experimental spectra with the spectra reconstructed using Eq. (1) for different β-gating conditions. In the top panel of the figure we show the analysis of theβ-gated spectrum with the 500-ns coincidence gate. In the central panel we show the analysis of the background subtracted singles spectrum (no β gated). In the bottom panel we show the analysis of the β-gated spectrum with the 20-ns coincidence gate that eliminates the majority of neutron-inducedγ rays. The relative deviations between experimental and reconstructed spectra are shown in each case. They are small up to 5.2 MeV, except for the 20-ns gated spectrum in the first few hundred keV. This reflects the difficulty of reproducing the effective module threshold in the MC simulation. All three analyses were performed with the reference branching ratio matrix. It should be noted that the result of the analysis of the singles spectrum does not depend on the simulatedβ-efficiency of the
Counts
1 10 102
103
104
Q
βS
n137 I
β-gated (20 ns)Energy [keV]
0 2000 4000 6000 8000
Residuals
−01 1
Counts
1 10 102
103
104
Q
βS
n137 I
SinglesEnergy [keV]
0 2000 4000 6000 8000
Residuals 1−0
1
Counts
1 10 102
103
104
Q
βS
n137 I
β-gated (500 ns)Energy [keV]
0 2000 4000 6000 8000
Residuals 1−0
1
FIG. 7. Relevant histograms for the analysis of the decay of137I:
experimental total absorption spectrum (solid gray), summing-pileup contribution (dashed blue),137Xe daughter spectrum (dashed-dotted- dotted green), β-n decay branch (dotted red), and reconstructed spectrum (solid black). The analyses of three different experimen- tal spectra are shown: β gated with a 500-ns gate (top), singles background subtracted (middle), and βgated with a gate of 20 ns to cut neutron-induced γ rays. See text for further details. The relative deviations between experimental and reconstructed spectra are shown for each case.
Energy [keV]
0 1000 2000 3000 4000 5000 6000 [%] βI
−3
10
−2
10
−1
10 1 10
-gated (500 ns) β
Singles -gated (20 ns) β
FIG. 8. Comparison of theβ intensities obtained for the decay of137I from the TAGS analyses of three experimental spectra with differentβ-gating conditions.
β detector, strongly varying close toQβ, but is very sensitive to the proper background subtraction. On the other hand, the result of the analysis of the β-gated spectrum with the neutron background suppressed does not depend on the MC simulation of the β-n branch of the decay, but suffers from the higher threshold at low energies. A comparison of the β-intensity distributions obtained from these three analyses is presented in Fig.8. As can be seen the agreement is good except in the continuum region up to 3.5 MeV and for the weakly populated state at 601.1 keV.
We should mention that in the analysis of the singles spec- trum the contribution of the 137Xe daughter decay (dashed- dotted green line in the central panel of Fig. 7) was ob- tained from MC simulations. For that, the information on this decay available in ENSDF [30] was used as input for the DECAYGEN event generator [51]. This information is reliable according to our TAGS analysis of theβ-gated137Xe spectrum and is in agreement with the recent TAGS result of B. C. Rascoet al.[59]. This procedure avoids the impact of the large statistical fluctuations of the experimental137Xe singles spectrum after background subtraction. We also point out that in the analysis of theβ-gated spectrum with the 20-ns time window, the same time window was applied to obtain the spectrum of the daughter decay contamination and the summing-pileup contribution.
As mentioned, the segmentation of DTAS allows one to make more stringent tests of the branching ratio matrix used to construct the spectrometer response function for the decay of interest. The quality of the reproduction of the individual-module spectra and the module-multiplicity gated total absorption spectra was investigated for these purposes.
The spectra of the individual modules is sensitive to the single γ-ray energy distribution from the whole decay. A more powerful test is provided by the total absorption spectra for different module-multiplicity conditions, which reflect the γ-cascade energy and multiplicity distribution as a function of excitation energy. The corresponding experimental spectra were generated with a 500-nsβ-gating time window and are compared with MC simulations obtained with the DECAY-
Energy [keV]
0 2000 4000 6000
Counts
1 10 10
210
310
4 EcutxIndividual modules (sum)
137 I
FIG. 9. Comparison of the 18 individual experimental spectra summed (solid gray) with the reconstructed spectrum after the anal- ysis (solid black) after taking into account the pileup contribution (dashed blue), the 137Xe daughter contamination (dashed-dotted- dotted green), and theβ-nbranch (dotted red).Excutis the limit of the known part of the137Xe level scheme.
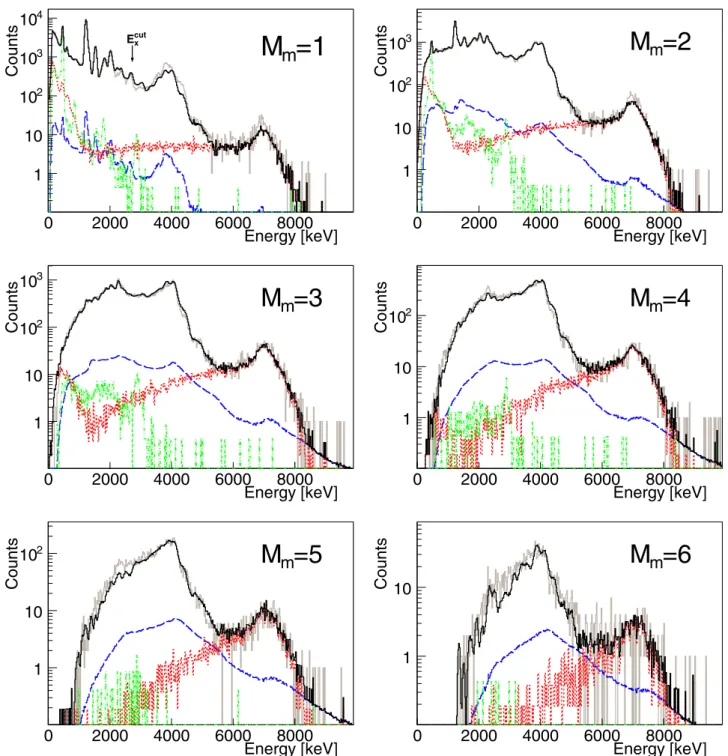
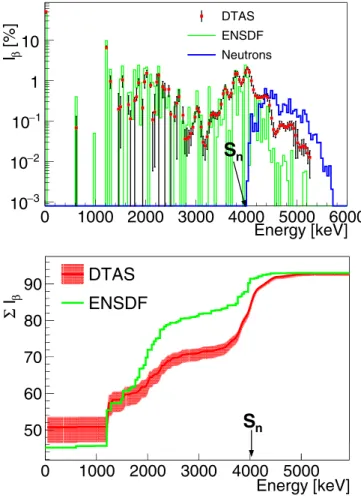
GEN event generator [51] using the reference branching-ratio matrix and the β-intensity distribution from the analysis of the total absorption spectra (top panel in Fig.7) as input. The comparison for the sum of the 18 single-module spectra can be seen in Fig.9. A reasonable reproduction of the spectrum is obtained, except for an excess of counts in the simulation in the range 2.2–3.2 MeV and a deficit of counts in the interval 3.2–4.6 MeV. The quality of the reproduction of the total absorption spectra for module multiplicities from 1 to 6 is shown in Fig.10. We should emphasize that the same numer- ical factors used to normalize the contaminants for the total absorption spectrum [Fig.7(top)] were used to normalize the contaminants for all multiplicities. The agreement is excellent forMm=2 toMm=6. The most significant differences are found forMm=1 and in fact the behavior is similar to that observed for single-module spectra, which is not surprising since theMm=1 spectrum is mostly sensitive to singleγ-ray deexcitations. None of the changes in the branching ratio matrix that we have tested (see below) resulted in a better agreement, thus we adopted this β-intensity distribution as the reference solution. This distribution is obtained for the 500-ns time window and it is depicted with red points in the top panel of Fig.11. The black vertical bars indicate the uncertainty obtained with the procedure detailed below. For comparison we include in this figure theβintensity obtained in high-resolutionγ-ray spectroscopy from ENSDF [30], as well as the β intensity followed by neutron emission, Iβn, discussed above. In the lower panel of Fig.11the accumulated β intensity as a function of excitation energy from DTAS is compared with the one from ENSDF, showing clearly the pandemonium effect in the high-resolution data and the importance of using the TAGS technique.
For the evaluation of the systematic uncertainty in theβ intensity resulting from the TAGS analysis, we considered all possible solutions compatible with reproduction of the data.
In comparison, the statistical uncertainty was found to be negligible. The envelope of all theseβ-intensity distributions
Energy [keV]
0 2000 4000 6000 8000
Counts
1 10 102
103
104
m =1
cut
M
Ex
Energy [keV]
0 2000 4000 6000 8000
Counts
1 10 102
103
M
m=2
Energy [keV]
0 2000 4000 6000 8000
Counts
1 10 102
103
m =3 M
Energy [keV]
0 2000 4000 6000 8000
Counts
1 10
102
M
m=4
Energy [keV]
0 2000 4000 6000 8000
Counts
1 10
102
M
m=5
Energy [keV]
0 2000 4000 6000 8000
Counts
1 10
m
=6 M
FIG. 10. 137Iβ-gated spectra with a 500-nsβ-gating time window and with a condition on module-multiplicityMmfrom 1 to 6 (solid gray) compared with the MC simulations (solid black) taking into account the summing-pileup contamination (dashed blue), the137Xe daughter activity (dashed-dotted-dotted green), and theβ-nbranch contribution (dotted red).Excut is the limit of the known part of the137Xe level scheme.
defines the uncertainty bars shown in Fig.11. Theβ-intensity distribution obtained in the analysis of theβ-gated spectrum with a 500-ns time window [shown in Fig.7(top)] is taken as the reference result, and it can be found in the Supplemental Material [60]. The other twoβ-intensity distributions plotted in Fig.8 obtained from the same data with different gating conditions are considered as cross-checks of the reference solution. The influence of other experimental parameters in the results was investigated for the evaluation of the uncertain-
ties of the reference solution. One of these parameters is the normalization factor of the contaminants. The corresponding normalization was varied until the reproduction of the total absorption spectrum was no longer considered acceptable.
The normalization factor of the summing-pileup was changed by a factor of ±30% and the ones for the daughter con- tribution and the β-n contribution were changed by ±5%.
The resulting β-intensity distributions were included in the uncertainty estimation. We also changed the energy threshold
Energy [keV]
0 1000 2000 3000 4000 5000 6000 [%] βI
−3
10
−2
10
−1
10 1 10
DTAS ENSDF Neutrons
S
nEnergy [keV]
0 1000 2000 3000 4000 5000 β IΣ
50 60 70 80
90
DTAS
ENSDF
S
nFIG. 11. β-intensity distribution for the decay of137I. Top panel:
TAGS results (red dots with black error bars) and high-resolution γ-spectroscopy data from ENSDF (green line) are shown together with theβ-ncomponent (blue line). Bottom panel: accumulatedβ- intensity distribution obtained from the TAGS analysis (red line with error) and high-resolutionγ-spectroscopy data from ENSDF (green line).
in the simulation of theβdetector by±10 keV to evaluate the influence in the results of a change in theβ-efficiency curve.
The uncertainty in the experimental calibration of DTAS was also taken into account: the experimental energy calibration parameters have been changed by ±0.5%, while the width calibration parameters were changed by±15%.
The influence of different branching ratio matrices was considered as well. This includes the β-intensity distribu- tions obtained with the alternative spin-parity values for the g.s. level of 137I mentioned above. We tested the impact on the electric dipole PSF of alternative values of the level- density parameter a atSn: 7.118, from EGSM calculations, and 16.461, from TALYS [61] (see TableII). We introduced by hand modifications in the branching ratio matrix of the continuum in order to reproduce better the experimentalγin- tensities at low excitation energies obtained in high-resolution studies [55,58,62] (see TableIII). Although it worsened the reproduction of the sum of the individual modules and the module-multiplicity gated spectra, it gave a good reproduction of the total absorption spectrum and it was included in the evaluation of the uncertainties.
TABLE III. Absolute γ intensities per 100 decays deexciting the main levels in the known part of the level scheme populated in the decays of137I (first row) and95Rb (rest). The second column corresponds to the intensities obtained from high-resolution data [30,31]. The third column gives the intensities obtained with TAGS for the reference analysis, whereas the intensities obtained with a modified branching ratio matrix are presented in the fourth column (TAGS∗).
Nucleus Energy (keV) IγENSDF IγTAGS IγTAGS∗
137I 1218 0.128 0.071 0.127
95Rb 352.01 0.490 0.659 0.491
556.06 0.151 0.252 0.150
680.7 0.244 0.263 0.242
The impact of the first bin of the experimental spectrum included in the analysis was also evaluated. We found that it affects significantly the g.s. feeding intensity determination and we considered variations of ±1 bin in the result. We have also used the maximum entropy (ME) algorithm [50]
instead of the conventionally used EM algorithm to check the influence of the method of deconvolution in the analysis.
Theβ intensities determined in all cases were normalized to 100-Pn, where we take as a reference the value from ENSDF:
7.14(23)% [30]. However, we also considered two alternative Pnvalues: 7.76(14)% [63] and 7.33(38)% [64].
We obtained a g.s. feeding intensity of 50.8(43)%. In the analysis with a 20-ns window, an intensity of 47.4% was obtained, while the analysis of the background subtracted singles spectrum gives a value of 49.9%. This intensity was also calculated by means of aβ-γcounting method for TAGS data proposed by Greenwoodet al.[65], and we obtained a similar value of 51.2(6)%. These two values are larger than the quoted number in ENSDF: 45.2(5)%. It is also worth mentioning that B. Fogelberget al.[58] reported aβintensity of 47% to the g.s., while the recent TAGS measurement of B.
C. Rascoet al.determined a value of 49(1)% [59].
B. Decay of95Rb
A spin-parity value of 5/2− [31] is used for the g.s. of
95Rb. For the analysis, we considered allowed transitions and first forbidden transitions to states of the known part of the level scheme and only allowed transitions to states in the continuum. Using the known level scheme and the nuclear statistical model parameters described at the beginning of Sec. III, we performed the analysis of the β-gated total absorption spectrum with the time window of 500 ns. The quality of the reproduction of the experimental spectrum is shown in the top panel of Fig. 12 and the corresponding β-intensity distribution is shown in Fig. 13 (see also the Supplemental Material [60]). We also performed the analysis of theβ-gated spectrum with a condition of 20 ns to elimi- nate the majority of the delayed contribution associated with neutron interactions of theβ-nbranch (see bottom panel of Fig.12). Note that here there is a prompt contribution due to theγ rays deexciting theβ-n daughter94Sr. This did not happen in137I, where only the g.s. of136Xe is populated. This
Counts
1 10 102
103
104
Q
βS
n95 Rb
-gated (500 ns) β
837 keV
Energy [keV]
0 2000 4000 6000 8000 10000
Residuals
−01 1
Counts
1 10 102
103
104
Q
βS
n95 Rb
-gated (20 ns) β
837 keV
Energy [keV]
0 2000 4000 6000 8000 10000
Residuals 1−0
1
FIG. 12. Relevant histograms for the analysis of the decay of
95Rb: experimentalβ-gated spectrum (solid gray), summing-pileup contribution (dashed blue),95Sr daughter spectrum (dashed-dotted- dotted green),95Y granddaughter spectrum (densely-dotted pink), β-nbranch (dotted red), and reconstructed spectrum (solid black).
The analyses of two different experimental spectra are shown: β gated with 500-ns time gate (top) andβgated with a gate of 20 ns to cut theβ-delayed neutrons (bottom). See text for further details. The relative deviations between experimental and reconstructed spectra are shown for each case. The 836.9-keVγ-ray peak from the first excited state in94Sr is highlighted in both figures.
contribution can be identified as an 836.9-keV γ-transition visible as a peak in the spectra. In theβ-gated spectrum with the long time coincidence window, the prompt contribution is partially added to the delayed contribution distorting the high-energy side of the neutron capture bump, as shown in Sec.II B. As seen in the bottom panel of Fig.12, the use of a 20-ns time coincidence window in the MC simulation of theβ-nbranch eliminates the neutron capture bump, leaving a prominent peak at 836.9 keV used for normalization of this contamination. It should be noted (compare top and bottom panels in Fig. 12) that the increase of the effective DTAS threshold associated with the narrow time window strongly affects the shape of the total absorption spectrum in this case.
The reason is that we are cutting some low-energyγrays that take part in many cascades deexciting high energy levels. In
Energy [keV]
0 2000 4000 6000 8000
[%]
βI
−3
10
−2
10
−1
10 1
10
β-gated (500 ns)-gated (20 ns) β
FIG. 13. Comparison of theβintensities obtained for the decay of95Rb from the TAGS analysis of experimental spectra generated with two different time conditions.
particular, the intenseγ ray of 204.0 keV, which comes from a 7/2+ level at 556.1 keV, is clearly cut, thus shifting and distorting the spectrum. This explains the large differences in theβ-intensity distributions obtained from the analysis of both spectra, as shown in Fig.13.
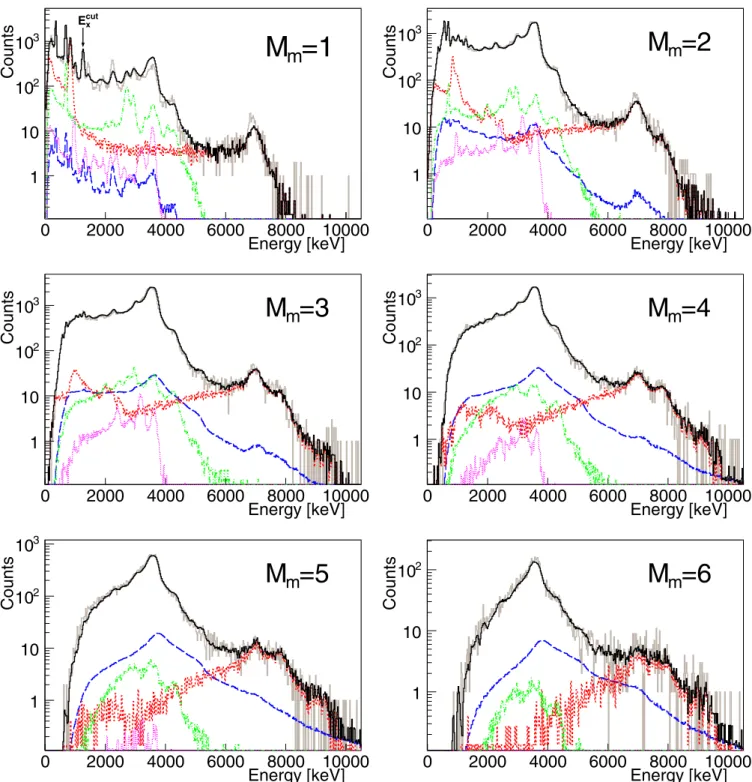
As in the case of 137I the branching ratio matrix used in these analyses was tested investigating the reproduction of the sum of the individual-module spectra (see Fig. 14) and the module-multiplicity gated spectra (see Fig.15). The result of the analysis of theβ-gated spectrum with the 500-ns time gate was used as the reference one. As for 137I, the overall agreement is excellent and the larger differences are found for theMm=1 multiplicity gated total absorption spectrum and the sum of the individual-module spectra. The discrepancies in the reproduction of the fine structure in these spectra above the last discrete level in the known level scheme seem to
Energy [keV]
0 2000 4000 6000 8000
Counts
1 10 10
210
310
410
5 cut ExIndividual modules (sum)
95 Rb
FIG. 14. Comparison of the sum of the 18 individual experimen- tal spectra (solid gray) with the reconstructed spectrum after the anal- ysis (solid black) taking into account the pileup contribution (dashed blue), the95Sr daughter contamination (dashed-dotted-dotted green), the95Y granddaughter contamination (densely-dotted pink), and the β-nbranch (dotted red).Excutis the limit of the known part of the95Sr level scheme.
Energy [keV]
0 2000 4000 6000 8000 10000
Counts
1 10 102
103
M m =1
cut
Ex
Energy [keV]
0 2000 4000 6000 8000 10000
Counts
1 10 102
103
M m =2
Energy [keV]
0 2000 4000 6000 8000 10000
Counts
1 10 102
103
M m =3
Energy [keV]
0 2000 4000 6000 8000 10000
Counts
1 10 102
103
m =4 M
Energy [keV]
0 2000 4000 6000 8000 10000
Counts
1 10 102
103
m =5 M
Energy [keV]
0 2000 4000 6000 8000 10000
Counts
1 10
102
M m =6
FIG. 15. 95Rbβ-gated spectra with a 500-nsβ-gating time window and with a condition on module-multiplicityMm from 1 to 6 (solid gray) compared with the MC simulations (solid black) taking into account the summing-pileup contamination (dashed blue), the95Sr daughter activity (dashed-dotted-dotted green), the95Y granddaughter activity (densely-dotted pink), and theβ-nbranch contribution (dotted red).Excut is the limit of the known part of the95Sr level scheme.
reflect the difficulty in the statistical model of reproducing variations in the branching to the g.s. for individual levels. The impact of these discrepancies in theβ-intensity distribution is small, given the limited contribution of Mm=1 to the total spectrum.
Similarly to the 137I case, we have considered different sources of systematic error for the reference solution obtained with a 500-ns time window. The maximum variation of the
normalization factor for theβ-delayed neutron branch com- patible with the reproduction of the total absorption spectrum was ±10%. Due to the large contribution of the β-delayed neutron branch [see dotted-red line in Fig.12(top)], especially at high energies, the summing-pileup normalization could be changed by a factor ±100%, and the activities of daughter and granddaughter were changed by a factor±50% without noticing a distortion in the reproduction of the spectrum.
Energy [keV]
0 2000 4000 6000 8000 [%]
βI
−4
10
−3
10
−2
10
−1
10 1
10
DTASENSDF Neutrons
S
nEnergy [keV]
0 2000 4000 6000 8000
βI Σ
0 20 40 60 80 100
DTAS ENSDF
S
nFIG. 16. β-intensity distribution for the decay of 95Rb. Top panel: TAGS results (red dots with error bars) and high-resolution γ-spectroscopy data from ENSDF (green line) are shown together with the β-n component (blue line). Bottom panel: accumulated β-intensity distribution obtained from the TAGS analysis (red line with error) and high-resolutionγ-spectroscopy data from ENSDF (green line).
Apart from that, we have considered the same possible sources of uncertainty as in137I for the threshold of theβdetector, the energy calibration and the width calibration. We also consid- ered the solution obtained by applying the ME deconvolution method. Apart from the ENSDFPnvalue of 8.7(3)% [31], al- ternative values have been used to normalize theβ intensities to 100-Pn: 8.87(29)% [64] and 9.08(14)% [63]. A modified branching ratio matrix reproducing the knownγ intensities for low-excitation levels, coming from high-resolution studies [66], was also considered (see TableIII). Although it gave acceptable results, it worsened the reproduction of the total spectrum and the reproduction of the module-multiplicity gated spectra. The β intensity distribution obtained with a narrow gate of 20 ns is considered just as a cross-check (see Fig.13) and it was not included in the error budget.
In Fig.16, theβ-intensity distribution including the sys- tematic uncertainty is compared with the high-resolution re- sult from ENSDF [31]. Theβ-intensity distribution obtained with DTAS is normalized to 100-Pn, whereas the intensity in
TABLE IV. Integral Iβγ above Sn (Pγ) obtained with TAGS in comparison with the value from ENSDF and with the neutron emission probability,Pn.
PγENSDF PγTAGS Pn
Nucleus (%) (%) (%)
137I 2.76 9.25+−12..8423 7.14(23)
95Rb 0.57 2.92+0.97−0.83 8.7(3)
ENSDF is normalized to 77.971% [31] since the evaluators recognized the incompleteness of the experimental informa- tion (the evaluation is based on a high-resolution spectroscopy work [66] with 56 unplacedγrays).
IV. γ-NEUTRON COMPETITION
In the twoβ-delayed neutron emitters studied in this work a significant amount of β intensity deexciting by means of γ rays,Iβγ, is observed aboveSn. In order to compare with the neutron emission probability (Pn) we can definePγ as the integratedIβγ aboveSn:
Pγ = Qβ
Sn
IβγdEx. (2)
In TableIVthePγ values obtained in this work are com- pared with thePn values from ENSDF. The β intensity con- necting to levels that deexcite by means ofγ rays represents 56% of the total β intensity above Sn for 137I and 25% for
95Rb. The situation is similar to that found in the decays of
87,88Br [7,8] and can be understood as a nuclear structure ef- fect, as discussed below. Compared to theγintensity observed above Sn in high-resolution experiments, retrieved from the ENSDF database, we observe 3 and 5 times higher values for
137I and95Rb, respectively, indicating a sizable pandemonium effect.
The uncertainties quoted in TableIVfor ourPγ values are the quadratic sum of two terms. One term is evaluated from the dispersion of Pγ values calculated from the differentβ intensity distributions obtained in our analysis under different assumptions, as explained in previous sections. The second term arises from the uncertainty in the first bin considered in the integration of Eq. (2), due to the uncertainty of our energy calibration. This term amounts to 20% for 137I and 26% for
95Rb and dominates the upper limit of the uncertainty given in TableIV.
Similarly to the previous works on87,88Br and94Rb [7,8], we have evaluated the ratio Iβγ/(Iβγ +Iβn) as a function of the excitation energy above Sn. This ratio is equivalent to the average ratio of widthsγ/(γ +n)that is calculated in the Hauser-Feshbach formalism as described in detail in Refs. [8,9]. The ingredients for these calculations are the NLD and the PSF in the daughter nucleus and the neutron transmission coefficients (NTC) into the β-delayed neutron descendant. The first two are the same used for the con- struction of the branching ratio matrix in the TAGS analysis, whereas NTC are obtained from optical model calculations performed with TALYS-1.8 [61]. In the case of137I we only