9 Creative workers in Europe
Is it a reserve of the ‘ Would-Be Entrepreneurs ’ ?A cross country comparison
Csaba Makó, Miklós Illéssy and András Borbély
1 Introduction
‘Entrepreneurship’ frequently became the last resort miracle tool for European policy makers without solid empirical evidences. To illustrate the popularity of entrepreneurship as a panacea, especially in periods of crisis, a recent analysis entitled ‘Is European entrepreneurship in crisis?’ quotes an article published in 2009 in The Economist: ‘When faced with crisis, policymakers often call on entrepreneurs to save the day when other more conventional economic policies fail to have the desired impact’(Wooldrigge, 2009, in: Naudé, 2016:3). Undoubtedly, smallerfirms create more jobs than larger ones. This pattern looks rather universal. Similar to the US context,
‘SMEs are the job engine of Europe. In 2014, SMEs were responsible for 71 per cent of employment growth in the non-financial business economy’
(Mandl et al., 2016:5). However, the population of this company segment is rather heterogeneous in many respects and especially when it comes to its employment creation capability. According to the above-quoted Eurofound report (Mandl et al., 2016), the younger firms, of up to five years of operation, are the leaders in job creation.
Presently, Europe is confronting the well-known problems of both population decline and ageing. The outcomes of these unfavourable demographic changes are the ageing of both entrepreneurship and firms in Europe, which have direct negative impacts on employment creation capability as older firms are ‘less innovative and less dynamic, and less likely to employ new labour than younger firms’ (Naudé, 2016:6). This demographic trend for the population and forfirms, in combination with the employment impacts (McAfee and Brynjolfsson, 2016) of the digitisa- tion of the economy (such as robotisation and Industry 4.0) increase the interest in identifying and locating the possible source of the ‘would-be entrepreneurs’ within the workforce employed in various countries, sec- tors and occupations before and after the recent crisis in the European economy. Entrepreneurship is a complex phenomenon, which can be investigated from different perspectives (for example sociological, psy- chological, or economic), but in this chapter we intend to focus mainly
on psychological and cognitive traits such as creativity and problem- solving capability. Analysing existing European-wide employee survey databases, we aim to identify the possible source of the ‘future entrepre- neurs’ considering the fact that these entrepreneurs are recruited from those older people who already have the necessary professional experi- ences: ‘For this reason, older rather than younger individuals are more likely to be self-employed’ (Mascherini and Bisello, 2015:14).1 However, this is true only from a short term perspective. On the basis of the accumulated working experiences:
promotion of youth entrepreneurship is likely to have substantial effects in the medium to long term, with both tangible – new rapid growth companies – and intangible – changes in attitude of young people towards self-employment and entrepreneurship viewed as a viable employment option due to entrepreneurship-related content in the education system – results which can foster job creation and make Europe a more dynamic labour market.
Mascherini and Bisello (2015:100) If this is true, the characteristics of previous working experiences and working environments play a crucial role in the long-term success of new entrepreneurs. We argue that such characteristics of work organisation as task complexity, problem-solving activity, creativity and learning possibilities offered by the workplaces, together with the degree of employees’ autonomy, are often neglected in research on entrepreneurship, but are still a determinant factor of a country’s entrepreneurial environment because new entrepreneurs can only build their businesses on the basis of their existing experiences and practices (Deandreis 2016).
This chapter is structured as follows: in the next two sections we present briefly the theoretical-methodological foundation of our analysis and compare the distribution of creative, constrained problem solver and Taylorized workplaces by different country groups. The fourth and fifth sections focus on the relation between occupational groups, main sectors of activity and types of job by country groups. The sixth section focuses on the relation between the types of workers by country groups and the countries’ position in the Global Entrepreneurship and Devel- opment Index (GEDI) Rank. In addition, the authors make a distinction between the ‘opportunity’ and ‘necessity’ entrepreneurs, identifying the relations between the types of workers and the types of entrepre- neurs. In the final section, contributors outline the lessons and the directions of their future work. However, we have to note that in this shortened version of our work, we set aside the detailed statistical analysis of our results. Instead, we will only reveal the most important findings.
2 Theoretical and methodological foundation: how can we measure creative and innovative capability in the workplace?
The core ambition of this chapter is to map European workplaces according to the characteristics relative to cognitive dimensions of jobs and the degree of autonomy employees have in getting their job done. This analysis is based on the work of Lorenz and Lundvall (2011). Their methodology will be presented later in detail. They analysed the fourth wave of the European Working Conditions Survey (EWCS-2005) and distinguished three types of employees according to the dimensions of cognitive demands of work and employees’ autonomy. These three groups are ‘creative workers’, ‘con- strained problem solvers’and‘Taylorized workers’. Then they analysed the relationships between these characteristics and such:
complementary institutional arrangements that have received attention in recent work on national innovation systems: the role of broad competence- based systems of education and training, and the role of labour market systems characterised by the combination of high levels of labour market mobility and well developed systems of unemployment protection.
Lorenz and Lundvall (2011:10) Our chapter, however, uses Lorenz and Lundvall’s work only as a starting point, and it differs from it in two main ways. First, we included data from thefifth wave of EWCS (2010). This allowed us to enlarge the scope of the analysis to include the comparison of periods before and after the recent (2008) financial crisis. In addition, our chapter widens the limits of their study by evaluating the differences between each European country-group.2 Second, our chapter links the results of these analyses with the rank of the Global Entrepreneurship and Development Index (GEDI-2012), indicating the intensity of entrepreneurship (measured by the intensity of the attitude, abilities, and aspiration of entrepreneurship, see Table 9.5A in Annex) (Szerb and Trumbull, 2016). In this context we map interactions between the types of workplaces and the forms – opportunity versus necessity – of entrepreneurship.
The analysis presented here relies on data taken from the two waves of the European Working Condition Survey (EWCS-2005 and -2010) carried out by the European Foundation for the Improvement of Living and Work- ing Conditions (Dublin).3Our work focuses on salaried employees working in organisations with at least 10 employees in such non-agricultural sectors as industry and service, excluding public administration and social security, education, health and social work, household activities, and agriculture and fishing. In addition, the study excludes several non-market occupational categories such as armed forces occupations, skilled and elementary agricul- tural, forestry and fishery occupations. The sample examined consists of 9,296 salaried employees in the case of year 2005, and 12,161 in 2010. In
order to elaborate unbiased results, all tables presented in this study incorporate cross-national weighted data.
Not only the sampling procedure but also the choice of variables and methods of analysis for this study are consistent with the approach of Lorenz and Lundvall (2011). In order to characterise the main attributes of a creative workplace, we used the following six binary variables:
1 a variable measuring whether the work requires problem solving [PBSOLV], 2 a variable measuring whether one is able to learn new things in one’s work
[LEARN],
3 a variable measuring the presence of complex tasks in one’s work [COMPLX],
4 a variable measuring the use of the individual’s own ideas at work [IDEAS],4 5 a variable indicating the presence of autonomy in choosing the working
methods [AUTMET],
6 and a variable indicating autonomy in choosing the order of tasks [AUTORD].
The type of factor method that was carried out on these variables is Multi- ple Correspondence Analysis (MCA). Further analyses were elaborated on two factors together contributing to 58% of the inertia in the case of EWCS-2005, and 62% of the inertia in the case of EWCS-2010. In order to group the cases, hierarchical clustering (Ward’s method) was carried out on the basis of the factor scores, on each sample.
Thefirst group incorporates‘creative workers’characterised by high levels of problem solving, learning, and task complexity as well as the opportunity to use their own ideas at work, and to carry out their work in noticeably autonomous ways. The second group encompasses a group of workers referred to as
‘constrained problem solvers’, characterised by comparable levels of problem solving, learning and task complexity. Their highly supervised work environ- ment, however, offers them restrained opportunities to use their own ideas at work, and low levels of autonomy. The third group includes routine workers or
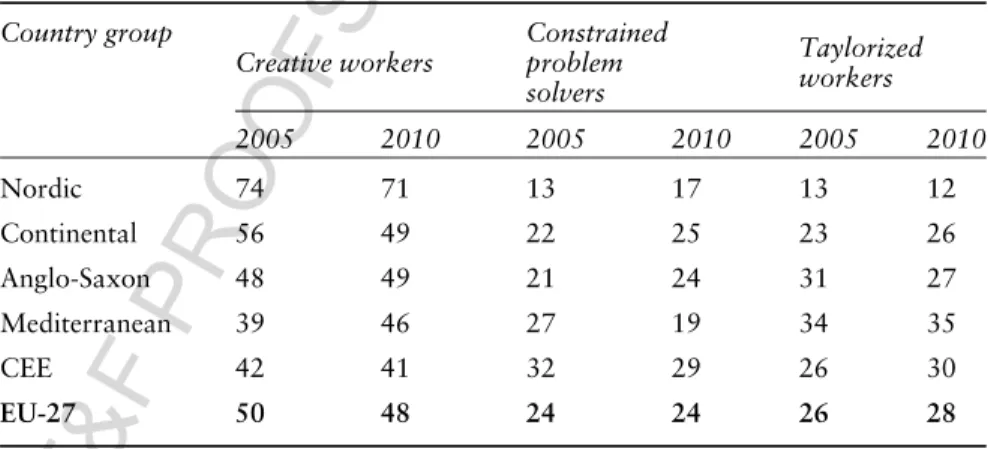
‘Taylorized workers’characterised by a limited scope for carrying out learning, problem solving or complex tasks during their work, as well as being unable to use their own ideas in most cases, or to do autonomous work. As Table 9.1 shows, in the EU-27 countries every second employee had creative work before and after the 2008financial crisis. Almost one quarter of employees carry out jobs that offer constrained creativity and a slightly higher share–however at an increasing rate – have Taylorized (routine) work. Globally, more than two thirds of European employees carry out work requiring various degrees of creativity (creative + constrained problem solver). Comparing the two periods (2005 vs. 2010), it is worth noting that there is a slight decrease in the share of creative workers (from 50% to 48%) in the European economy, no changes in the rate of constrained workers, and a slight increase also in the share of the routine or Taylorized work (from 26% to 28%) in the post-crisis period.
3 Types of workplaces in European comparison: visible country differences
Beside the general picture of creative and non-creative (Taylorized) work- places in the EU-27, there are visible differences between the country groups reflecting the particular set of their institutional context.5
Comparing the country groups, we may see that in the period both before and after the recent crisis, in particular the‘Nordic’and then the‘Continen- tal’ and the‘Anglo-Saxon’country groups have the highest share of creative workers in contrast with the ‘Mediterranean’ and ‘Central and Eastern European (CEE)’ countries. However, it is necessary to note that following the recent crisis, in the Nordic and particularly in the Continental country groups, the share of creative workers has declined. Comparing before and after the recent crisis period, the share of constrained problem solver workers has increased in the Nordic, Continental and Anglo-Saxon countries at the expense of the creative workers. In the CEE and especially in the Mediterra- nean countries the share of constrained problem solver workers decreased.
However, it is worth noting that the rate of creative workers has increased noticeably in the Mediterranean countries since the 2008 crisis.
The Taylorized workers are located at the other extreme of the scale. This type of non-creative work is present at a higher rate than the EU-27 average Table 9.1 Changing characteristics of creative work in EU-27
Variable 2005 (N=9,296) 2010 (N=12,161)
CW CPS TW AV CW CPS TW AV
Problem-solving activities in work
97 87 40 79 97 90 45 81
Learning new things in work
91 84 16 69 92 84 13 68
Undertaking com- plex tasks
83 81 8 63 85 78 6 61
Using one’s own ideas in work
76 23 29 51 71 16 24 45
Able to choose work methods
94 21 36 61 94 17 37 59
Able to choose order of tasks
92 13 33 57 94 16 36 59
Total share of occupied persons
50 24 26 100 48 24 28 100
CW= Creative workers, CPS= Constrained problem solvers, TW= Taylorized workers, AV=
Average. Following Lorenz and Lundvall, 2011:6), this table compares different types of work- places before and after the crisis.
both before and after the crisis in the Mediterranean and in the CEE country groups. The share of Taylorized work increased especially in the CEE country group and to a lesser extent in the Mediterranean countries, too, following the crisis. This means that the Mediterranean and the post- socialist new member states (CEE countries) did react to the challenges of the crisis, relying on ‘cost efficiency’ strategy, which consists in increasing the share of Taylorized work, instead of the‘knowledge efficiency’strategy, which consists in increasing the size of the creative workers or constrained problem solvers (see Table 9.2).
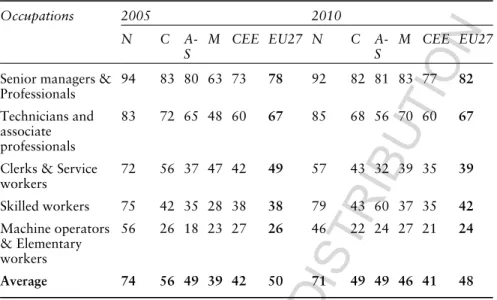
4 Share of types of workplaces by occupations
In this section we are going to briefly describe the share of different types of jobs by occupational groups. We also add cross-country and before/
after the crisis comparisons as further research dimensions to our analy- sis. Comparing the periods before and after the recent crisis, only minor changes took place in the distribution of creative workers by occupa- tional groups, namely: the share of creative workers in the occupation of
‘skilled workers’ became higher than its share in the category of ‘clerks and service workers’. Besides, we find the highest share of creative jobs in the occupational categories of ‘senior managers and professionals’ and
‘technicians and associate professionals’, while ‘machine operators and elementary workers’ can be characterised as the least creative occupa- tions (see Table 9.6A in Annex).
We argue that the differences between these occupational categories within a country may be seen as an important indicator for the inclusive character of innovation. Learning and creative possibilities cannot be limited to the jobs belonging to the top of the occupational hierarchy. On the other hand, it is
Table 9.2 Types of workplaces: country group comparison (per cent) Country group
Creative workers
Constrained problem solvers
Taylorized workers
2005 2010 2005 2010 2005 2010
Nordic 74 71 13 17 13 12
Continental 56 49 22 25 23 26
Anglo-Saxon 48 49 21 24 31 27
Mediterranean 39 46 27 19 34 35
CEE 42 41 32 29 26 30
EU-27 50 48 24 24 26 28
Source:own calculation
also obvious that a country in which the lower segment of occupational categories offers greater learning opportunities to employees will be able to utilise more gains from innovation. The analysis presented in this section was inspired by the work of Gallie and Zhou (2013) who analysed the determi- nants and consequences of employee involvement in European countries.
They found significant differences in employee involvement not only between occupational groups, but across countries, too. According to their results, employees from the upper segment of the occupational class category are more likely to be in high involvement organisation than employees from the lower level of occupational class hierarchy. What is more, the extent of these differences varied greatly by country groups6:
Occupational class differences were notably less great in the Continental and the Nordic country groups than in the other country groups. In the Continental and the Nordic groups, managers and professionals were almost 4 times more likely than non-skilled work- ers to be in high involvement organisations. But in the Southern group they were 7 times, in the East-Central group 8 times and in the East- North group 12 times more likely than the non-skilled to be in such organisations.
Gallie and Zhou (2013:32) The cross country comparison of the rate of creative workers by occupa- tion groups calls attention to the following patterns: the differences are the smallest in the Nordic and Continental countries followed by the CEE and Mediterranean country groups, while the largest differences were found in the Anglo-Saxon countries. Looking at the changes before (2005) and after (2010) the recent crisis, we may see decreasing differ- ences between various occupation categories in the Continental and Anglo-Saxon countries and a reverse tendency (in other words, growing differences) in the case of the Mediterranean and especially the CEE countries. The position of the Nordic countries remained almost the same (see Table 9.6A in Annex).
Regarding the occupational categories, a slight decrease of constrained problem solvers was registered in the following occupations between 2005 and 2010: senior managers and professionals, technicians and associate professionals, and skilled workers. The rate of constrained problem solvers increased among the clerks and service workers and no changes took place in the category of machine operators and elementary workers. Comparing the country groups, we may say that the rate of constrained problem solvers increased in the Nordic, Continental and Anglo-Saxon countries and decreased in the Mediterranean and CEE countries. Another interesting pattern: the share of this type of job was the highest before and after the recent crisis in the CCE country group compared to other country groups (see Table 9.7A in Annex).
As concerning Taylorized workers, we can see that their share is growing downwards in the occupational hierarchy. It is, however, striking that in the case of the Mediterranean countries, every fourth job in the top two occupational groups (senior managers and professionals; and technicians and associate professionals) was characterised by this least innovative work- ing arrangement in 2005. In response to the crisis, their share had signifi- cantly decreased by 2010. The trend was reversed in the case of clerks and service workers; their share significantly increased from 2005 to 2010 in the Mediterranean country group. It is also important to stress that the share of Taylorized workers among skilled workers has decreased to a remarkable extent in the Nordic, Continental and Anglo-Saxon country groups. The same is true for UK and Irish machine operators and elementary workers (see Table 9.8A in Annex).
5 Types of workplaces: sector differences
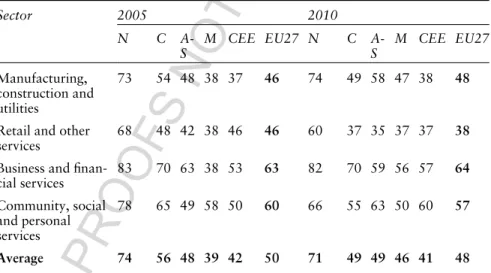
1 The share of creative workers by sectors in the EU-27 indicated the following rank of sectors (in periods both before and after the recent crisis):
2 ‘Business andfinancial services’,
3 ‘Community, social and personal services’, 4 ‘Manufacturing, construction, and utilities’, and 5 ‘Retail and other services’.
The leading role of business and financial services and community and personal services is not surprising. The business services or the‘Knowledge Intensive Business Services’ (KIBS) is the emblematic sector of the knowl- edge economy based on knowledge and learning intensity of work (Makó et al. 2011). In addition, we may observe a slight increase in the rate of creative workers in the manufacturing, construction, and utilities sector, and a decrease – to various degrees – in the retail and other services and community, social and personal services sectors in the European economy.
Evaluating sector level changes by country groups, the following shift took place. Surprisingly enough, in the Nordic countries the share of creative workers decreased in all sectors. The sharpest decline charac- terised the community, social and personal services sector. The only exception was the manufacturing, construction, and utilities sector in which a slight increase did happen from 2005 to 2010. In the Continental country group – with the exception of the business and financial services sector, in which no change was registered – in all sectors the rate of creative workers decreased, especially in the retail and other services and the community, social and personal services sectors. Interestingly enough, in the Anglo-Saxon country group the share of creative workers increased, particularly in the community, social and personal services sector and in
the manufacturing, construction, and utilities sector, but decreased in the retail and other services and in the business andfinancial services sectors.
Following the recent crisis, in the Mediterranean country group, a visible increase of creative workers has been taking place especially in the business and financial services and in the manufacturing sectors. On the other hand, in the retail and other services sector and particularly in the com- munity, social and personal services sector, the rate of creative jobs declined. In the CEE countries, the most remarkable increase in the share of creative workers took place in the community, social and personal services sector and in the business and financial services sector, with a minor increase in the manufacturing sector as well. A remarkable decrease of creative jobs took place in the retail and other services sector (see Table 9.9A in the Annex).
As concerning the constrained problem solvers, their share has increased since the recent crisis in all sectors in the Nordic country group. In the Continental countries, the share of this type of work has only increased in the manufacturing and retail sectors. On the contrary, in the Mediterranean countries their share decreased in all sectors. A similar pattern was identi- fied in the Anglo-Saxon and CEE country groups, with the exception of the retail and other services sector in which a slight increase took place (see Table 9.10A in Annex).
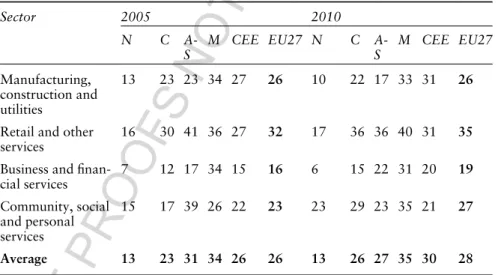
The share of Taylorized workers in Europe has slightly increased – from 26% to 28% – since the recent crisis (see Table 9.11A in Annex).
Besides this general trend, sector differences were indicated by the con- secutive waves of the EWCS (2005 and 2010). Firstly, the rate of the Taylorized or routine jobs did not change in the manufacturing, con- struction, and utilities sector: it seems to us that in this sector there are no more cost advantages originated from further rationalisation of labour processes – instead routine jobs are taken increasingly by smart robots. Secondly, both before and after the recent crisis, the highest share of this type of worker was employed in the retail and other services sector and the smallest proportion of them were found in the business and financial services sector. Thirdly, a slight shift was identified in the location of Taylorized workers: in both periods – as we mentioned earlier – instead of manufacturing, construction, and utilities, the retail and other services sector became the dominant employer of Taylorized workers. This sector was followed in 2005 by the manufacturing, con- struction and utilities sector and by the community, social and personal services sector; the last position in the sector ranking was occupied by that of business and financial services. Summing up sector level experi- ences in our study, we may say that – contrary to the mainstream view – the retail and other services sector became the most significant employer of Taylorized workers in Europe following the 2008 crisis.
Besides these general sector patterns it is necessary to indicate the role of country groups in sector differences. The lowest share of Taylorized
workers –in both periods– characterised the Nordic and the Continental countries. This type of jobs is found at a rate higher than the EU-27 average in the Mediterranean and CEE countries. In the post-crisis period, due to massive rationalisation, the retail and other services sector became the core sector for routine jobs. Other interesting changes took place in the business and financial sector, characterised by the lowest rate of Taylorized workers. After the recent crisis, in all country groups – except the Nordic and the Mediterranean countries – the share of Taylorized workers increased. This search for cost – instead of knowl- edge – efficiency is especially visible in the Anglo-Saxon and CEE countries.
6 Relations between entrepreneurship attitudes and types of workers: a country group comparison
A number of studies indicate that people start to create a business – with the well-known exception of start-ups – after having acquired valuable experiences (Storey and Greene, 2010, cited in Mascherini and Bisello, 2015:14). In our analysis we identified the learning and knowledge production capability with the workplaces of creative workers and constrained problem solvers. However, there is a shortage of studies comparing the learning capability of members of organisations (employ- ees) and the intensity of entrepreneurial attitudes. This section attempts to compare the results of the global survey on the intensity of entrepre- neurship – measured by the Global Entrepreneurship Development Index (GEDI-2012 in 83 countries) – carried out after the crisis of 2008, and the types of workplaces characterised by their creative and learning potentials in the EU-27.
For this purpose and in order to make our analysis simpler and more clear-cut, we have created a new, broad category of ‘potentially creative workers’ incorporating both creative workers and constrained problem solvers. It is worth keeping in mind that the main difference between these two groups of workers relied not so much on the importance of learning, problem-solving activities or task complexity, but rather the degree of autonomy in work (such as work method and task order). Comparing the rank of the GEDI-2012 index to the five country groups representing different combined shares of creative workers and constrained problem solvers, the following patterns of linkages were identified (see also Table 9.3):
1 The Nordic country group has the highest share of creative workers and constrained problem solvers (2010: 88%) and a clear leading edge role with the 2–11th position in the GEDI-2012 rank of countries.
2 The Continental countries with second highest share of creative work- ers and constrained problem solvers (2010: 74%) still have a leading
edge role with the 6–18th position in the GEDI-2012 rank of countries.
3 The Anglo-Saxon country group has the third highest rate of creative workers and constrained problem solvers (2010: 73%) and still has excellent GEDI-2012 scores: 7–17th position.
4 The CEE country group has the fourth highest rate of creative workers and constrained problem solvers (2012: 70%) but much weaker GEDI- 2012 scores: 20–38th position.
5 Surprisingly enough, the Mediterranean country group has the lowest share of creative workers and constrained problem solvers (2012:
65%) and has relatively the weakest position among the five country groups in relation to the GEDI-2012 rank of countries: 30–47th position.
In addition, it is worth noting that the share of workplaces lacking learning possibilities (such as those of the Taylorized workers) was the smallest in the first three country groups (from 12% to 27% in 2010), higher in the CEE (2010: 30%) and surprisingly enough highest in the Mediterranean (2010: 35%) country group.
In order to establish a more exact relationship between the share of creative workers and entrepreneurship, we divided the broad category of entrepreneurs into two subgroups. Following the dichotomy of Szerb et al. (2014) inspired by Reynolds et al. (2005), we distinguished so-called opportunity and necessity entrepreneurs. The distinction is based on the differences found in the motiva- tion to become an entrepreneur. In the case of the‘opportunity entrepreneurs’, the‘. . .main motives are the desire for independence and desire to work for Table 9.3 Country groups representing various rates of creativity of workers and the Global Entrepreneurship and Development Index (GEDI) rank of countries in 2012
Country group Rate of Creative Worker &
Constrained Problem Solvers (2010)
GEDI Rank Countries (2012)
Rate of Taylor- ized workers (2010)
Nordic countries 88% 2–11 12%
Continental countries
74% 6–18 26%
Anglo-Saxon countries
73% 7–17 27%
CEE countries 70% 20–38 30%
Mediterranean countries
65% 30–47 35%
Source:Szerb and Trumbull (2016:118); own calculation
themselves’, in the other case, the so-called ‘necessity’ entrepreneurs ‘are pushed into entrepreneurship because they have no other employment options’ (Mascherini and Bisello, 2015:13). According to a recent survey on entrepre- neurship (European Commission, 2012), there are significant differences in the outcomes of the two kinds of entrepreneurship, in terms of long-term job creation and the quality of these jobs, and thus in innovation and overall economic development. Opportunity entrepreneurs are expected to gain higher wages, more stable and durable employment, and to contribute more to (local) economic development.
In their analysis, Mascherini and Bisello (2015) distinguished between the two types of entrepreneurs. They found that young people in particular decided to be entrepreneurs as a result of an opportunity, however one third of new-business owners were necessity motivated. The share of necessity entrepreneurs among older new-business owners was found to be similar.
Our hypothesis is that if there is a correlation between creativity in the workplace and entrepreneurship, it will present in different ways in the case of the two types of entrepreneurship.
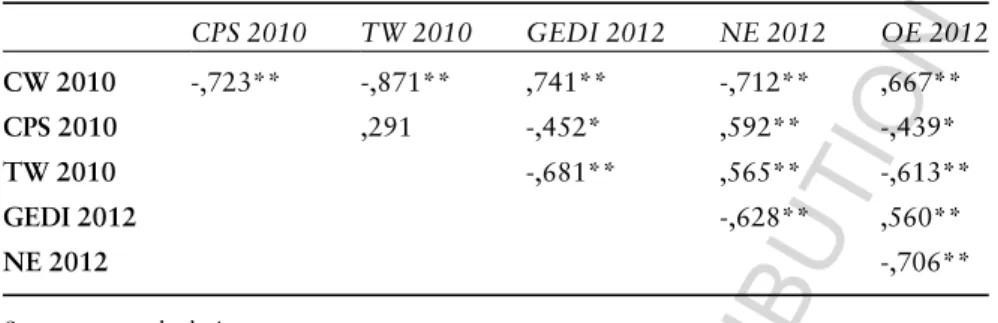
In order to capture the main interrelations between the types of work- places and entrepreneurship at European Union level, bivariate (Pearson) correlations were computed on aggregated national-level data (see Table 9.4). Our variables characterising the types of workplaces in national context (creative workers, 2010; constrained problem solvers, 2010; Taylorized workers, 2010) are derived from the aggregate national-level proportions of creative, constrained, and Taylorized work- ers of EU countries, based on our calculations presented in the previous section of this chapter. The variable indicating the entrepreneurship intensity (GEDI-2012) is based on the national values of the Global Entrepreneurship and Development Index (Szerb, 2010; Szerb and Trum- bull, 2016:118). As an indicator of the level of necessity and opportunity entrepreneurs in the European national economies (necessity entrepre- neurs 2012; opportunity entrepreneurs 2012), we use the national aggre- gate proportions derived from the report of the Flash Eurobarometer survey (no. 354) (European Commission, 2012:239).
Our results not only confirm our hypothesis, but they do so in an impressive manner. The share of creative workers strongly and posi- tively correlates with the share of opportunity entrepreneurs, and at the same time shows strong and negative correlation with the share of necessity entrepreneurs. In contrast, the share of Taylorized workers has a strong and positive correlation with the share of necessity entre- preneurs and shows a strong and negative correlation with the share of opportunity entrepreneurs. In other words, the share of opportunity entrepreneurs is higher in those countries in which employees have more autonomy and have more opportunity to use their own creativity.
It is interesting to note, however, that the rate of constrained problem solvers shows a similar pattern to the rate of Taylorized workers. It is
surprising because one may assume that its correlations will follow similar dynamics that we have seen in the case of creative workers.
This phenomenon needs deeper analysis, but at first glance we would say that this is because learning, problem solving and so on alone are not enough to catalyse opportunity entrepreneurship: autonomy is a sine qua non precondition of this type of entrepreneurship. Another possible interpretation is that the workplace of constrained problem solvers shows more common characteristics with Taylorized jobs than with the creative ones. According to this argument, Post-Fordism does not completely dissolve Taylorist/Fordist principles of work organisa- tion but it re-creates them in new and more flexible version of it (flexible Taylorism) (Makó, 2005). This is embedded in the well- known Post-Fordism vs. Neo-Fordism debate, which we won’t deal with in detail for the sake of brevity.
7 Lessons and future plans
There are a growing number of studies that stress ‘since the 2000s entre- preneurship has stagnated and even declined in the US and many European countries’ (Naudé, 2016:3). Among the many factors responsible for this process of erosion is the ageing of both the population and the business firms. As Naudé (2016:6) rightly notices ‘. . . older businessfirms [are] less innovative and less dynamic, and less likely to employ labour than younger firms’. However, besides the older age of the business firms or entrepre- neurs, it may be necessary to pay more attention to the learning/innovative capability of the human resources available in the presently operatingfirms in the European economy.
Table 9.4 Interactions between the types of workplaces and forms of entrepreneur- ship (Pearson correlation, N=25)
CPS 2010 TW 2010 GEDI 2012 NE 2012 OE 2012 CW 2010 -,723** -,871** ,741** -,712** ,667**
CPS 2010 ,291 -,452* ,592** -,439*
TW 2010 -,681** ,565** -,613**
GEDI 2012 -,628** ,560**
NE 2012 -,706**
Source:own calculation.
Legend: CW= Creative Workers; CPS= Constrained Problem Solvers; TW= Taylorized Workers;
NE= Necessity Entrepreneurship; OE= Opportunity Entrepreneurship
** significant at the 0.01 level
* significant at the 0.05 level
Firstly, the contributors of this chapter intended to stress the impor- tance of the variation in the creativity (autonomy), problem-solving and learning capability of the European workforce by countries, occupations and sectors – adopting and enlarging the approach of Lorenz and Lundvall (Lorenz and Lundvall, 2011). Secondly, the authors tried to call attention to the possible interrelations between the types of European workers, intensity and types (opportunity vs. necessity) of entrepreneur- ship (Nielsen et al., 2012; Lundvall, 2014).
Every second European employee occupies sa creative job position.
However, it is necessary to note that – following the recent crisis – a slight decline in the rate of creative workers and a slight increase in the share of Taylorized ones took place in the EU-27 countries. In the aftermath of the crisis, no changes were registered in the category of the constrained problem solvers. Besides this general picture, visible country group differences were mapped. For example, the Nordic countries – in spite of the crisis – have the highest share of creative workers in comparison with the Mediterranean and CEE countries.
Identifying the inclusivity of distribution of jobs characterised by creativity/problem-solving and learning capabilities, noticeable differ- ences were identified in the country groups surveyed. Again, the Nordic countries have the leading edge position. The smallest gap exists between the shares of creative workers in the highly skilled senior managers and professionals, and machine operators and elemen- tary workers in this country group. Conversely, the largest gap was found in the Anglo-Saxon countries. In addition, it is necessary to note that under the impact of the recent crisis, the differences in the rate of creative workers visibly increased in the Mediterranean and the CEE countries.
A significant shift took place in the sector level differences of the share of types of Taylorized workers. Following the crisis, instead of the manufacturing, construction and utilities sector, the most important employer of this type of workers is the retail and other services sector.
Another interesting shift happened in the ‘knowledge intensive service sector’: due to the intensive search for cost efficiency – again with the exception of the Nordic country group– the share of Taylorized workers increased. This pattern of change is especially true in the Anglo-Saxon and CEE countries.
These tendencies are even more important because the creativity and autonomy offered by workplaces to the employees have a significant and positive impact on entrepreneurship and are increasing the probability of the rate of opportunity entrepreneurs in the country. It is not surprising if we consider that entrepreneurs do not come out of nowhere, but usually build their businesses on their previous working experiences. Entrepreneurs being pulled into these activities by opportunity are stronger job creators than necessity-driven ones.
Although this recognition is an important one, its policy implications are less clear because it requires complex policy actions from different fields (for example education, innovation, economic development, finan- cial and labour law regulation, and so on), with interlinkages between them thoroughly taken into account during the implementation. As Ács et al. rightly noted: ‘Unfortunately, although high-growth entrepreneur- ship and entrepreneurial ecosystems are high on many policy agendas, there is fairly little understanding of how policy can foster them most effectively’(Ács et al., 2017:67). In terms of labour market policy implica- tions, we stress the importance of skill development, especially those soft or tacit entrepreneurial skills, like communication, leadership, team-, time- and project-management, strategic thinking, problem solving, decision making, and so on.
Other areas of policy intervention depend largely on the idiosyncratic characteristics of the different countries. In this context it is worth noting that the share of both opportunity entrepreneurs and creative workers strongly correlate with the overall economic development of a given country. Empirical evidence presented in this section suggests that there is a clear divide within the EU, which is far from being well-integrated in this regard. Instead, a relatively strong division can be detected moving from north-western towards south-eastern countries. It is also visible that the crisis just further increased these differences, Taylorized workers being most prevalent in Mediterranean and CEE countries. A possible research question is whether pre- and post-crisis differences are due to changes in the labour market or in the sectoral structure of the economy, and to what extent different labour market policies influenced these inequalities.
Acknowledgements
The research has been conducted as part of the National Excellence in Higher Education Program in Hungary (reference number of the contract:
20765-3/2018/FEKUTSTRAT)
Appendix
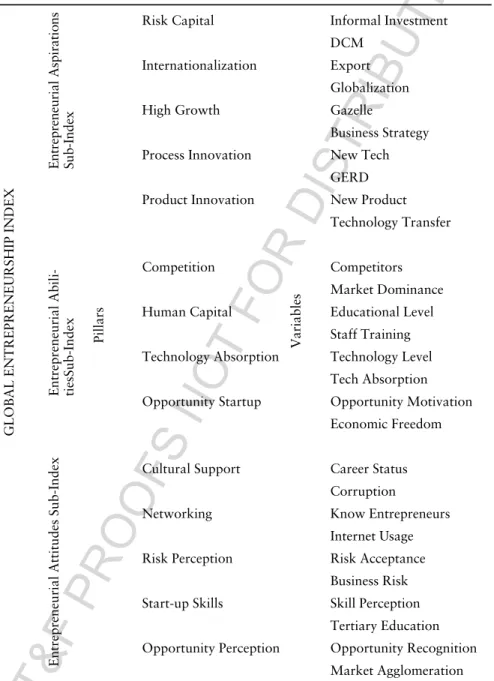
Table 9.5A The contents and the results of 14 factors. Shaping the entrepreneurship intensity in the world GEDI
GLOBALENTREPRENEURSHIPINDEX EntrepreneurialAspirations Sub-Index
Risk Capital
Variables
Informal Investment DCM
Internationalization Export Globalization
High Growth Gazelle
Business Strategy Process Innovation New Tech
GERD Product Innovation New Product
Technology Transfer
EntrepreneurialAbili- tiesSub-Index Pillars
Competition Competitors
Market Dominance Human Capital Educational Level
Staff Training Technology Absorption Technology Level
Tech Absorption Opportunity Startup Opportunity Motivation
Economic Freedom
EntrepreneurialAttitudesSub-Index
Cultural Support Career Status Corruption
Networking Know Entrepreneurs
Internet Usage Risk Perception Risk Acceptance
Business Risk Start-up Skills Skill Perception
Tertiary Education Opportunity Perception Opportunity Recognition
Market Agglomeration
Table 9.7A Share of constrained problem solvers by occupations and country groups (per cent)
Occupations 2005 2010
N C A-
S
M CEE EU27 N C A- S
M CEE EU27
Senior managers &
Professionals
4 15 11 12 17 13 7 10 11 11 17 11
Technicians and associate professionals
12 19 20 27 31 21 11 21 30 12 26 20
Clerks & Service workers
16 16 21 23 30 20 22 23 29 18 32 24
Skilled workers 14 35 41 37 38 36 15 39 28 29 34 33 Machine operators
& Elementary workers
17 27 25 31 35 29 27 31 31 21 33 29
Average 13 22 21 27 32 24 17 25 24 19 29 24
Legend:N= Nordic countries, C= Continental countries, A-S= Anglo-Saxon countries, M= Mediterranean countries, CEE= Central and Eastern European countries.
Table 9.6A Share of creative workers by occupations and country groups (per cent)
Occupations 2005 2010
N C A-
S
M CEE EU27 N C A- S
M CEE EU27
Senior managers &
Professionals
94 83 80 63 73 78 92 82 81 83 77 82
Technicians and associate professionals
83 72 65 48 60 67 85 68 56 70 60 67
Clerks & Service workers
72 56 37 47 42 49 57 43 32 39 35 39
Skilled workers 75 42 35 28 38 38 79 43 60 37 35 42 Machine operators
& Elementary workers
56 26 18 23 27 26 46 22 24 27 21 24
Average 74 56 49 39 42 50 71 49 49 46 41 48 Legend: N= Nordic countries, C= Continental countries, A-S= Anglo-Saxon countries, M= Mediterranean countries, CEE= Central and Eastern European countries.
Table 9.8A Share of Taylorized workers by occupations and country groups (per cent)
Occupations 2005 2010
N C A-
S
M CEE EU27 N C A- S
M CEE EU27
Senior managers &
Professionals
2 2 10 25 9 8 1 8 8 6 6 7
Technicians and &
associate professionals
4 10 16 25 10 12 4 11 15 18 15 13
Clerks & Service workers
12 28 42 30 28 31 20 34 39 43 34 36
Skilled workers 11 22 24 35 24 25 6 18 11 33 32 24 Machine operators
& Elementary workers
28 47 57 46 38 45 27 48 46 52 45 47
Average 13 23 31 34 26 26 12 26 27 35 30 28
Legend:N= Nordic countries, C= Continental countries, A-S= Anglo-Saxon countries, M= Mediterranean countries, CEE= Central and Eastern European countries.
Table 9.9A Share of creative workers by sectors and country group (per cent)
Sector 2005 2010
N C A-
S
M CEE EU27 N C A- S
M CEE EU27
Manufacturing, construction and utilities
73 54 48 38 37 46 74 49 58 47 38 48
Retail and other services
68 48 42 38 46 46 60 37 35 37 37 38
Business andfinan- cial services
83 70 63 38 53 63 82 70 59 56 57 64
Community, social and personal services
78 65 49 58 50 60 66 55 63 50 60 57
Average 74 56 48 39 42 50 71 49 49 46 41 48 Legend:N= Nordic countries, C= Continental countries, A-S= Anglo-Saxon countries, M= Mediterranean countries, CEE= Central and Eastern European countries.
Table 9.10A Share of constrained problem solvers by sectors and country group (per cent)
Sector 2005 2010
N C A-
S
M CEE EU27 N C A- S
M CEE EU27
Manufacturing, construction and utilities
14 24 29 28 35 27 16 29 25 20 30 26
Retail and other services
16 22 17 26 27 22 23 26 29 23 31 27
Business andfinan- cial services
10 18 20 28 32 21 12 15 19 13 24 16
Community, social and personal services
8 18 12 16 27 17 11 16 13 15 19 15
Average 13 22 21 27 32 24 17 25 24 19 29 24
Legend: N= Nordic countries, C= Continental countries, A-S= Anglo-Saxon countries, M= Mediterranean countries, CEE= Central and Eastern European countries.
Table 9.11A Share of Taylorized workers by sectors and country group (per cent)
Sector 2005 2010
N C A-
S
M CEE EU27 N C A- S
M CEE EU27
Manufacturing, construction and utilities
13 23 23 34 27 26 10 22 17 33 31 26
Retail and other services
16 30 41 36 27 32 17 36 36 40 31 35
Business andfinan- cial services
7 12 17 34 15 16 6 15 22 31 20 19
Community, social and personal services
15 17 39 26 22 23 23 29 23 35 21 27
Average 13 23 31 34 26 26 13 26 27 35 30 28 Legend:N= Nordic countries, C= Continental countries, A-S= Anglo-Saxon countries, M= Mediterranean countries, CEE
Notes
1 In this respect it is worth calling attention to the following: in the EU-28, only 6.5% of the total young population (between 15 and 29) were self-employed (Mascherini and Bisello, 2015:11).
2 We distinguishedfive country groups as follows:
1) Nordic countries: Sweden, Finland, and Denmark.
2) Anglo-Saxon countries: the United Kingdom and Ireland.
3) Continental countries: Germany, Netherlands, Austria, Luxembourg, France and Belgium.
4) Mediterranean countries: Spain, Portugal, Italy, and Greece.
5) Central and Eastern European (CEE) countries: Estonia, Latvia, Lithuania, Poland, Czech Republic, Slovakia, Hungary, Slovenia, Romania, and Bulgaria.
It is worth noting that all analysis presented in this chapter exclude Croatia, and country-group level analyses exclude Malta and Cyprus.
3 Analysis is based on the data-source of the 4th (2005) and 5th (2010) European Working Conditions Survey (EWCS). EWCS is a cross-sectional survey taken in everyfive years since 1990 organised by European Foundation for the Improvement of Living and Working Conditions (Eurofound, Dublin), covering the EU members and various other European countries (Eurofound, 2017).
4 A binary variable transformed from afive-level ordinal scale, as follows:‘Almost always’and‘Often’were recoded into‘yes’; and‘sometimes’,‘rarely’, and‘almost never’were recoded into‘no’.
5 In the further analysis and interpretation of the particular share of creative workplaces by country group we intend to use as explanatory variables some characteristics of the institutional arrangements in adopting the perspective of the Lorenz and Lundvall (2011) analysis and completing it too.
6 In their country groupings, the authors distinguished the following clusters of countries: (1) Continental (Austria, Belgium, France, Germany, Luxembourg and the Netherlands); (2) Nordic (Denmark, Finland and Sweden); (3) North- West (Ireland and the UK); (4) Southern (Greece, Italy, Portugal and Spain).
Within the (5) Eastern European countries three subgroups were distinguished:
(5a) East-Central European countries (Czech Republic, Hungary, Poland, Slovakia and Slovenia); (5b) East-North European countries (Estonia, Latvia and Lithuania) and (5c) East-South European countries of Bulgaria and Romania. The Mediterranean islands of Cyprus and Malta were not assigned to a group.
References
Ács, J. Z., Szerb, L., Autio, E., Lloyd, A. (2017) Global Entrepreneurship Index 2017. Washington, DC: The Global Entrepreneurship and Development Insti- tute, p. 100.
Deandreis, M. (2016) Technology, Open Data, Ecosystem and SMEs, The Value of Innovation for SMEs, 15th International Entrepreneurship Forum (IEF) Confer- ence, Venice, 14–16 December, 2016.
Eurofound (2017) European Working Conditions Surveys (EWCS). www.eurofound.
europa.eu/surveys/european-working-conditions-surveys
European Commission (2012) Flash Eurobarometer 354: Entrepreneurship in the EU and beyond, European Commission, Directorate-General for Communication, Brussells, p. 172.
Gallie, D., Zhou, Y. (2013) Work Organisation and Employee Involvement in Europe, Luxemburg: Publications Office of the European Union, p. 76.
Lorenz, E., Lundvall, B. A. (2011) Accounting for Creativity in the European Union: A multi-level analysis of individual competence, labour market structure, and systems of education and training,Cambridge Journal of Economics, Vol. 35, No. 2, pp.
269–294.
Lundvall, B. A. (2014) Deteriorating Quality of work undermines Europe’s innovation system and the welfare of European’s workers,EUWIN Newsletter, p. 6.
Makó, C. (2005) Neo-instead of post-Fordism: The Transformation of Labour Process in Hungary,International Journal of Human Resources, Vol. 2, No. 16, pp. 227–289.
Makó, C., Csizmadia, P., Illéssy, M., Iwasaki, I., Szanyi, M. (2011) Organizational Innovation and Knowledge Use Practice: Cross Country Comparison, (Hungarian versus Slovak Business Service Sector),Institute of Economic Research–Hitotsuba- shi University, Discussion Papers, B. Vol. 38, p. 214.
Mandl, I., Hurley, J., Ledermaier, S., Napierala, J. (2016) ERM Annual Report 2015: Job Creation in SMEs, Luxemburg: Publications Office of the European Union, p. 114
Mascherini, M., Bisello, M., IKEI Research & Consultancy (2015) Youth entrepre- neurhip in Europe: Values, Attitudes and Policies, Luxemburg: Publications Office of the European Union, p. 84.
McAfee, A., Brynjolfsson, E. (2016) Human Work in the Robotic Future Policy for the Age of Automation),Foreign Affairs, Vol. 95, No. 4, pp. 139–151.
Naudé, W. (2016) Is European Entrepreneurship in Crisis?CESifo DICE Report– Journal for Institutional Comparisons, Vol. 14, No.3, pp. 3–7.
Nielsen, P., Nielsen, R. N., Bamberger, S. G., Stamhus, J., Fonager, K., Larsen, A., Vinding A. L., Ryom, P., Omland, Ø. (2012) Capabilities for Innovation: The Nordic Model and Employee Participation.Nordic Journal of Working Life, Vol.
2, No. 4, pp. 85–115.
Reynolds, P., Bosma, N., Hunt, S., De Bono, N., Servais, I., Lopez-Garcia, P., Chin, N. (2005) Global Entrepreneurship Monitor: Data Collection Design and Implementation 1998–2002, Small Business Economics, Vol. 24, No. 3, pp.
205–231.
Szerb, L. (2010) Vállalkozások, vállalkozói elméletek, vállalkozások mérése és a Globális Vállalkozói és Fejlődési Index (GEDI), (Entrepreneurship, Entrepreneurial Theories, Measuring Entrepreneurship and the Global Entrepreneurship and Devel- opment Index, GEDI), Budapest: Hungarian Academy of Sciences, Doctoral Dissertation.
Szerb, L., Ács, J. Z., Autio, E. (2014) Entrepreneurship measure and entrepreneurship policy in the European Union: The Global Entrepreneurship Index perspective, ATINER, 11th Annual International Conference on SMEs, Entrepreneurship and
Innovation: Management–Marketing–Economics–Social Aspects, Athens, 28–31 July, 2014.
Szerb, L., Trumbull, W. N. (2016) The Development of Entrepreneurship in the European Transition Countries: Is Transition Complete?Strategic Change: Brief- ings in Entrepreneurial Finance, Vol. 25, No. 2, pp. 109–129.