Fresh water supply: Hungary Attila Havas
Institute of Economics, CERS, Hungarian Academy of Science 1 Overview
The first law on water supply in Hungary was the Act on Water Right 1885 (XXIII), which created the legal framework for the water sector.43 (Hegedüs et al., 2010) The water networks and water companies were nationalised in 1948 and run by the municipalities (at times at local and then again at county level). Information on needs was collected at the level of municipalities, with a decisive role played by the local bodies of the ruling party. Investment decisions were made by the Planning Office, in consultation with the Ministry of Finance, and the respective (national, regional, and local) bodies of the ruling party.
Water used to be provided free of charge before 1990 in flats (dwellings) rented from
municipalities: water supply had been included in the rent, which had in turn artificially been kept low as a compensation for low salaries. No one took ownership responsibilities, and thus the infrastructure – including the dwellings themselves as well as the various networks of electricity, gas, water, sewerage and telephone – had become obsolete in terms of technical quality and reliability. Further, they became insufficient in terms of geographical coverage.
People living in their own flats or houses always had to pay for water supply. Even though the rates used to be heavily subsidised these people often had to contribute to the investment costs, which incurred when the network was being extended to reach their dwellings.
A factor of marginalisation was living in those dwellings, which were not connected to the public water supply network, or living in settlements with poor or no public water supply. In the latter case, people were using water from fountains.
Avoiding health-related risks is a serious subject in the Hungarian water supply. Water was contaminated with arsenic in nearly 350 settlements (of the total 3,200) even in 2011, above 250 in 2012, and nearly 160 in 2013. Taking into account other hazardous ingredients, too, water quality was below the EU standards in 365 settlements in 2012.
43 For a summary of major developments in the governance system of the water sector (organisational and ownership structures, regulation, distribution of responsibilities) from the late 19th century up to 1990 see e.g. Hegedüs et al. (2010), pp. 1-3.
Figure 10: Number of settlements with above threshold level of arsenic in drinking water (by counties) (Source: ÁNTSZ [National Public Health and Medical Officer Service]: Ivóvíz minőség, 2013,
https://www.antsz.hu/data/cms65055/Ivovizminoseg2013.pdf)
In 2010 around 1.5 million people lived in 364 settlements effected by the problem of arsenic contamination.44 Various steps were taken in these settlements to supply healthy water at least for drinking and cooking. For example, the settlements were supplied healthy water by tank vehicles or bottles, and/or various types of filtering equipment were installed or distributed to households. To meet the EU standards, a national programme was launched and resulted in a decrease in the number of affected people by 2013. (Figure 11)
Figure 11: Number of people living in settlements with above threshold level of arsenic in drinking water (by counties) (Source: ÁNTSZ [National Public Health and Medical Officer Service]: Ivóvíz minőség, 2013,
https://www.antsz.hu/data/cms65055/Ivovizminoseg2013.pdf)
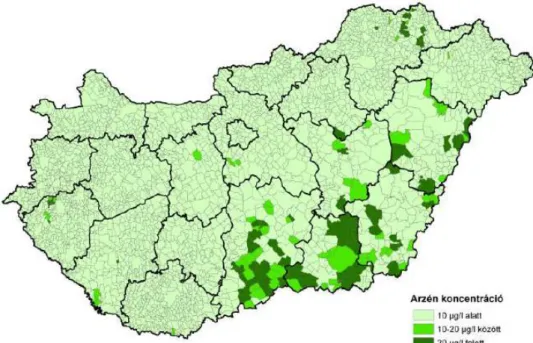
Due to geological factors, the affected settlements are concentrated in the South-East part of Hungary. (Figure 12)
44
http://zipp.hu/belfold/2010/02/22/arzenes_ivoviz_az_antsz_szerint_masfel_millio_ember_eri ntett
Figure 12: Geographic distribution of settlements with above threshold level of arsenic in drinking water (2013) (Source:
ÁNTSZ [National Public Health and Medical Officer Service]: Ivóvíz minőség, 2013, https://www.antsz.hu/data/cms65055/Ivovizminoseg2013.pdf)
Legend: below 10 µg/l; between 10-20 µg/l; above 20 µg/l)
Access to public water supply has improved to a noteworthy extent in Hungary since 1990:
79.2% of all settlements were supplied with public water in 1990, 99.4% in 1998, and 99.9%
in 2000. As for dwellings, this ratio increased from 70.1% in 1990 to 90.8% in 2013. There has been some difference between dwellings in towns and villages. As for the former, the share of dwellings supplied with public water in towns increased from 84.9% in 1990 to 95.0% in 2009; and then slightly decreased by 2013. The respective figures for the latter (dwellings in villages) are as follows: 93.9% in 1990; 96.7% in 2009; and 95.8% in 2013. The length of the public network has been extended by nearly 24%. (Table 7)
Table 7: Settlements and dwellings with public water supply, 1990-2013
Year
Settlements Dwellings Length of
the public
water network,
km
Per capita water consumption,
m3 supplied with public water
numbe r
% of all settlement
s
number
% of all dwellings in towns villages total
1990 2,431 79.2 3,302,930 84.9 93.9 70.1 52,419 55.8 1991 2,585 84.1 3,385,451 86.4 84.5 73.0 54,276 51.1 1992 2,717 87.9 3,445,566 87.5 94.7 75.3 55,309 49.4 1993 2,802 90.2 3,483,240 88.1 95.0 76.2 56,429 45.8 1994 2,880 92.5 3,524,560 88.8 94.5 78.6 57,399 43.0 1995 3,047 97.5 3,590,924 90.0 94.8 81.7 58,973 40.8 1996 3,084 98.7 3,627,996 90.5 94.7 82.5 59,709 38.4 1997 3,098 99.1 3,653,750 90.6 94.6 83.4 60,673 37.0 1998 3,113 99.4 3,686,983 91.1 94.6 84.5 61,252 36.7 1999 3,124 99.7 3,710,042 91.4 94.5 85.6 61,999 36.0 2000 3,131 99.9 3,751,770 92.1 95.3 86.1 62,285 38.0 2001 3,132 99.9 3,774,273 92.6 94.0 89.7 62,622 36.6 2002 3,132 99.9 3,814,868 93.0 95.4 88.0 63,149 37.5 2003 3,144 99.9 3,854,511 93.2 95.5 88.9 63,762 39.0 2004 3,144 99.9 3,909,916 93.7 95.8 89.4 64,355 36.8 2005 3,144 99.9 3,956,168 94.0 95.9 89.8 64,641 36.8 2006 3,144 99.9 3,996,223 94.3 96.1 90.3 64,941 36.8 2007 3,152 100.0 4,045,007 94.7 96.5 90.8 65,235 37.4 2008 3,152 100.0 4,083,630 94.9 96.6 91.0 65,194 36.0 2009 3,152 100.0 4,114,652 95.0 96.7 90.9 65,207 35.9 2010 3,152 100.0 4,127,155 94.9 96.6 90.9 66,002 34.1 2011 3,154 100.0 4,126,075 94.7 96.5 90.1 66,065 34.1 2012 3,154 100.0 4,150,484 94.3 95.6 90.9 65,425 34.4 2013 3,154 100.0 4,161,147 94.4 95.8 90.8 64,790 33.5
Source: Central Statistical Office, http://www.ksh.hu/docs/eng/xstadat/xstadat_annual/i_zrk001.html
Per capita consumption, in the meantime, has decreased considerably: from 55.8 m3 in 1990 to 33.5 m3 in 2013. This change has been fairly quick. The bulk of this decrease had already occurred by 1997. Comparing this year’s level to that of 1990, a drop by 33.8% is to be noted (or 84.5% of the fall observed in 2013 as compared to 1990). Experts have identified several reasons for this drastic contraction: (a) people have become price sensitive45 and thus have reduced their water consumption and/ or turned to taking water from (legal or illegal) fountains; (b) better off people began started drinking bottled water;46 and (c) the waste of water (leakage) might have been reduced by the modernisation of infrastructure.
45 As already mentioned, water used to be provided free of charge before 1990 in flats (dwellings) that were rented from municipalities. The costs for water supply used to be included in the rent.
46 Water used by businesses is not accounted for in this figure.
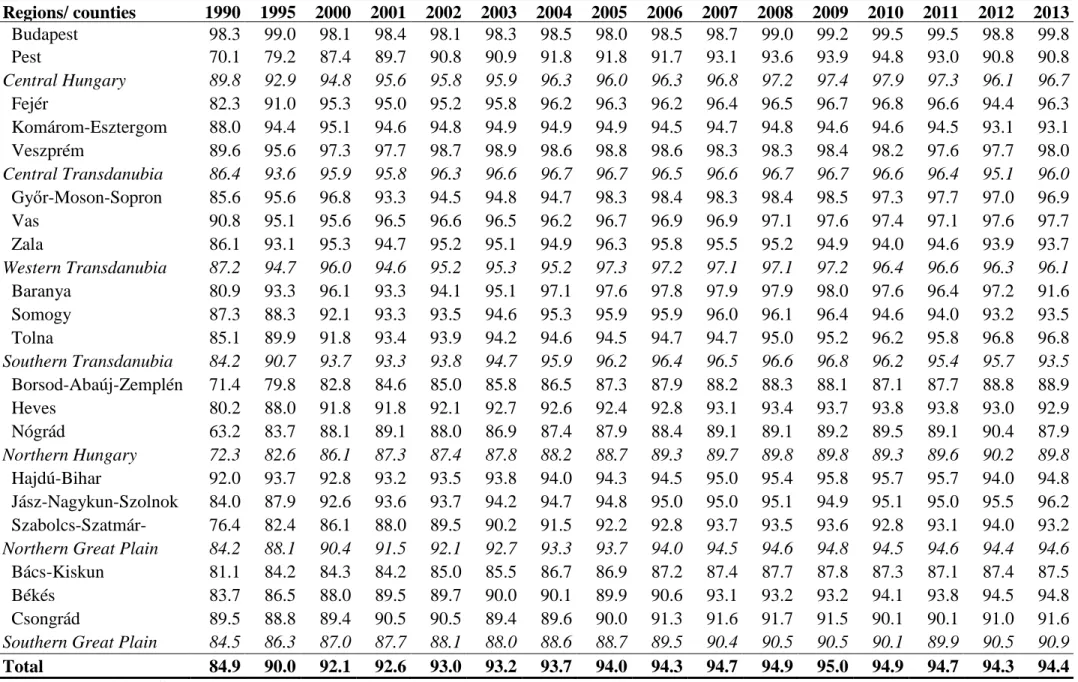
Nearly all dwellings in Budapest were connected to the public water utilities in 1990 already, while the national average was just below 85%, reaching 94.4% by the end of 2013. Regional data (by counties) indicate quite a wide gap: in Nógrád county a mere 63.2% of dwellings were connected to the public water utilities in 1990, in Pest 70.1%, and Borsod-Abaúj- Zemplén 71.4%. At the end of 2013 the respective ratios were 87.9%, 90.8%, and 88.9%
(Table 11).
Act LXV on Local Governments, passed in 1990, stipulated water provision and sewage management to become functions of the local government. The operation was organised in different ways. While the water supply services are (or for a certain period were) run by a public-private partnership in several cities, in other municipalities these services remained in public hands (e.g. Debrecen). Overall, these issues have mainly been discussed in closed sessions by politicians and experts, with hardly any involvement of the public. The discussions and decisions had of course been reported on by the media. The main
considerations were financial in their nature and focused on topics such as the funds that would be needed to modernise and extend the infrastructure of public water supply.
Maintaining a vast – and, in many cases, ‘aging’ – network is quite a costly endeavour on its own, let alone the pressing need for extension and modernisation. Publicly owned companies did not have sufficient funds to finance these tasks in the early 1990s.47 Thus privatisation seemed inevitable in many cases and indeed began in 1994. (Boda et al., 2008; Hegedüs et al., 2010) One of the important issues was the question of what to sell as in whether this should include the management rights only or beyond that the assets (the pipelines and equipment) as well.
As an overall assessment, privatisation has improved the efficiency of waterworks. (Boda et al., 2008) Yet, FIDESZ – the dominant government party since 2010, also governs Budapest since 2010, and used to be in majority in Szeged in 1998-2002 – boasts a populist, ‘freedom fighter’, anti-capital, and nationalistic, at some points even xenophobic stance is against foreign capita in general,48 and thus has made all the efforts to reverse privatisation in this sector. Further, sectoral taxes like those on pipelines have been introduced to increase the financial burden of investors, thereby driving them out of Hungary. The case of the Pécs Waterworks is an extreme example of these developments. In the night of October 5, 2009 a security firm, commissioned by the municipality, occupied the headquarters of the
waterworks in order to physically prevent the company from continuing its services.49 This resulted in the launch of court cases by the dozen (!) with the foreign investors and the municipality suing each other.
47 „Through the 1980s the companies had to face increasing financial difficulties because of the depressed fees and decreasing subsidies. By the nineties the sector ended up in a very difficult financial situation: the revenues from the collected user charges did not even cover the operational costs, while significant investments were needed both in the water and the sewerage sectors.” (Hegedüs et al., 2010, p. 3)
48 Hungarian and foreign dailies and weeklies have published thousands of articles on these issues. For a more academic, comprehensive, summary, see, e.g. Kornai (2015).
49 For further details on this case, covering the developments up to 2009, see e.g. Hegedüs et al., 2010: Box 1).
Privatisation did not have any direct effect on the marginalised since prices always had been and remained to be set by the municipalities instead of the privatised waterworks. The price formula is specified usually in the concession contract and contains operational costs (taking into account inflation and exchange rate fluctuation), plus a management fee.
For other reasons, however, access to piped water has been uneven by income groups. In 1992 75.5% of households in the lowest income decile of the population had access to piped water, while that ratio was 97.6% for the households in the highest decile. That gap has been
narrowed by 2003: 80.7% vs. 99.4%. (Table 8)
Boda et al. (2008, p. 181) claim that this inequality has not been caused by physical and spatial marginalisation of social groups (or regions). Rather, it is due to the limited financial capacities of people to pay for the costs of connection. “In other words, connection charges hamper access and not necessarily the consumption bills.”
Table 8: Proportion of dwellings supplied with piped water by income groups (%)
Source: Central Statistical Office (Table 7.1 in Boda et al., 2008)
2 Water supply in Budapest
After the privatisation on 1 January 1994, the water supply services of Budapest (Fővárosi Vízművek Zrt.; or Budapest Waterworks) was run by a joint venture until 29 June 2012. The joint venture was owned by the municipality and two private investors, that is, SUEZ
Environnement S.A. and RWE Aqua GmbH. (Table 9) The municipality retained majority ownership, but operation was the duty of the private investors who hence held the
management rights. For instance, the Board of Directors was chaired by a French director until 29 June 2012 and there was a German member in the Board. Yet, there were six Hungarian members, too.50 Until 29 June 2012 the general manager was a Hungarian (who became a deputy general manager for finance on 30 June 2012) while the two deputy general managers for operations and technical affairs and for finance were foreigners.
Table 9: The ownership structure of Budapest Waterworks, 1 January 1994 – 29 June 2012
Shareholders Ownership (%)
Budapest City Council 73.60
Hungáriavíz Zrt.* 23.65
SUEZ Environnement S.A. 0.87
RWE Aqua GmbH 0.84
Budakeszi Municipality 0.24
Budaörs Municipality 0.57
Halásztelek Municipality 0.11
Szigetmonostor Municipality 0.09 Szigetszentmiklós Municipality 0.03
* Hungáriavíz Zrt. was owned by SUEZ Environnement S.A. and RWE Aqua GmbH.
Source: Budapest Waterworks, Annual Report, 2012
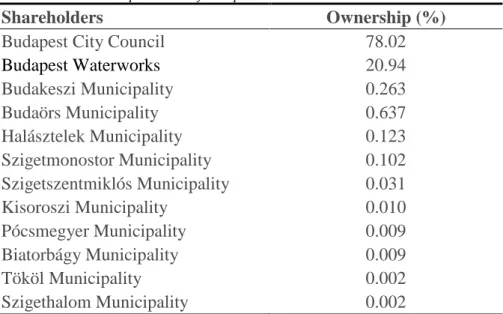
The foreign investors divested their investments on 29 June 2012, and since then the company is in the hands of domestic (and public) owners. (Table 10)
Table 10: The ownership structure of Budapest Waterworks since 29 June 2012
Shareholders Ownership (%)
Budapest City Council 78.02
Budapest Waterworks 20.94
Budakeszi Municipality 0.263
Budaörs Municipality 0.637
Halásztelek Municipality 0.123
Szigetmonostor Municipality 0.102 Szigetszentmiklós Municipality 0.031
Kisoroszi Municipality 0.010
Pócsmegyer Municipality 0.009
Biatorbágy Municipality 0.009
Tököl Municipality 0.002
Szigethalom Municipality 0.002
Source: http://vizmuvek.hu/hu/fovarosi-vizmuvek/tarsasagi-informaciok/fovarosi_vizmuvek/tulajdonosi-szerkezet; accessed on 13 March 2015
50 Annual Report, 2012. In 2011, too, there were six Hungarian members of the 8-strong Board. (Annual Report, 2011) In contrast, Hegedüs et al. (2010), p. 9, claim that the foreign investors had a permanent majority on the board, i.e. 4 out of 7 seats. A possible explanation is that the foreign owner nominated Hungarian members to the Board.
An interview conducted with a former employee suggests that the foreign investors had introduced modern management techniques, upgraded the infrastructure and regularly retrained the employees. Study tours abroad had become significantly more frequent than before, and since 2012 (when the foreign investors left) have become far less frequent again.
Further, annual bonuses are not being paid any more and other additional forms of remuneration (e.g. via cafeteria) have been cut back too.
The situation of the marginalised has not been affected directly either by the privatisation or the change of the ownership structure in 2012. They, however, suffer from a combination of several factors. Usually they live in run-down blocks of flats where the water pipes are out- dated, and thus leakages are ‘normal’. What is worse, in many cases water meters cannot be installed, and thus consumption cannot be measured by flats, given the technical condition of the pipes. Replacing the pipes is rather costly and can be done only gradually, at best. As a consequence, insufficient attention is paid to control consumption or notice and stop waste.
Thus, tenants in these houses are prone to pay a higher water bill going along with thus increased costs for sewage. Further, toilets are shared facilities in many of these houses (not installed inside flats). Again, not enough – if any – attention is being paid to maintain them, to control water consumption and stop leakages. The bill for (unnecessarily) high(er) water consumption is to be paid by all tenants, regardless of their actual use of the toilets and individual water consumption.
In sum, several – in many cases interrelated – factors are at play influencing the situation of the marginalised. Namely they are: housing, the quality of infrastructure, access to various services (water, electricity, gas, heating, etc.), job opportunities (i.e. the ability to earn regular, sufficient income and thus pay the bills), education, social policies and so on. In other words, it would not be sound to analyse access to water in isolation from these other factors.
3 Water supply in Szeged
In 1994, the operation of the water supply services was privatised. This agreement was renegotiated in 2001. The municipality demanded to start these negotiations. As a result of heated discussions, during which e.g. legal actions were also used as weapons, several major points of the original contract were amended. First, the foreign investor now is not entitled a management fee anymore. Second, the foreign investor lost its formerly exclusive rights to perform maintenance, reconstruction and other building (investment) activities via a separate company.51 Third, the company was transformed from a limited liability company (Ltd.) into a joint stock company and the municipality also increased its influence in the board.52 The managing director is still appointed by the foreign investor, but he now is a Hungarian citizen at the time of writing.
51 These capacities were ’internalised’, i.e. employees of that separate company are now employed by the Szeged Waterworks. (Horváth and Péteri (2012)) From a different angle, now there is no incentive to ’externalise’ profits by making contracts with a separate firm at inflated prices.
52 These three elements are mentioned in a written reply by Szeged Waterworks, provided in Hungarian. (24 March 2015)
Several Hungarian accounts, co-authored by Gábor Péteri, have presented this case as a success story, due to mutual learning. (Hegedüs et al., 2013; Horváth and Péteri, 2012)
Hungarian political weeklies, in contrast, tend to emphasise conflicts over appropriating those elements of profits that stem from investment activities (i.e. not from the basic service
provision). These tensions are partially disguised, partially motived by party political motivations. (e.g. Magyar Narancs, a series on Szeged, October – December 2000) 4 Water supply in Debrecen
In 1923, a lighting company took over the operation of the water supply in the city given the electricity needed for pumping water. This was a municipal company.53
53 Interview with the managing director of Debrecen Waterworks; see also Gy (1976), pp.
171-172, 210-212.
Table 11: Ratio of dwellings connected to the drinking water-conduit network (%)
Regions/ counties 1990 1995 2000 2001 2002 2003 2004 2005 2006 2007 2008 2009 2010 2011 2012 2013 Budapest 98.3 99.0 98.1 98.4 98.1 98.3 98.5 98.0 98.5 98.7 99.0 99.2 99.5 99.5 98.8 99.8 Pest 70.1 79.2 87.4 89.7 90.8 90.9 91.8 91.8 91.7 93.1 93.6 93.9 94.8 93.0 90.8 90.8 Central Hungary 89.8 92.9 94.8 95.6 95.8 95.9 96.3 96.0 96.3 96.8 97.2 97.4 97.9 97.3 96.1 96.7 Fejér 82.3 91.0 95.3 95.0 95.2 95.8 96.2 96.3 96.2 96.4 96.5 96.7 96.8 96.6 94.4 96.3 Komárom-Esztergom 88.0 94.4 95.1 94.6 94.8 94.9 94.9 94.9 94.5 94.7 94.8 94.6 94.6 94.5 93.1 93.1 Veszprém 89.6 95.6 97.3 97.7 98.7 98.9 98.6 98.8 98.6 98.3 98.3 98.4 98.2 97.6 97.7 98.0 Central Transdanubia 86.4 93.6 95.9 95.8 96.3 96.6 96.7 96.7 96.5 96.6 96.7 96.7 96.6 96.4 95.1 96.0 Győr-Moson-Sopron 85.6 95.6 96.8 93.3 94.5 94.8 94.7 98.3 98.4 98.3 98.4 98.5 97.3 97.7 97.0 96.9 Vas 90.8 95.1 95.6 96.5 96.6 96.5 96.2 96.7 96.9 96.9 97.1 97.6 97.4 97.1 97.6 97.7 Zala 86.1 93.1 95.3 94.7 95.2 95.1 94.9 96.3 95.8 95.5 95.2 94.9 94.0 94.6 93.9 93.7 Western Transdanubia 87.2 94.7 96.0 94.6 95.2 95.3 95.2 97.3 97.2 97.1 97.1 97.2 96.4 96.6 96.3 96.1 Baranya 80.9 93.3 96.1 93.3 94.1 95.1 97.1 97.6 97.8 97.9 97.9 98.0 97.6 96.4 97.2 91.6 Somogy 87.3 88.3 92.1 93.3 93.5 94.6 95.3 95.9 95.9 96.0 96.1 96.4 94.6 94.0 93.2 93.5 Tolna 85.1 89.9 91.8 93.4 93.9 94.2 94.6 94.5 94.7 94.7 95.0 95.2 96.2 95.8 96.8 96.8 Southern Transdanubia 84.2 90.7 93.7 93.3 93.8 94.7 95.9 96.2 96.4 96.5 96.6 96.8 96.2 95.4 95.7 93.5 Borsod-Abaúj-Zemplén 71.4 79.8 82.8 84.6 85.0 85.8 86.5 87.3 87.9 88.2 88.3 88.1 87.1 87.7 88.8 88.9 Heves 80.2 88.0 91.8 91.8 92.1 92.7 92.6 92.4 92.8 93.1 93.4 93.7 93.8 93.8 93.0 92.9 Nógrád 63.2 83.7 88.1 89.1 88.0 86.9 87.4 87.9 88.4 89.1 89.1 89.2 89.5 89.1 90.4 87.9 Northern Hungary 72.3 82.6 86.1 87.3 87.4 87.8 88.2 88.7 89.3 89.7 89.8 89.8 89.3 89.6 90.2 89.8 Hajdú-Bihar 92.0 93.7 92.8 93.2 93.5 93.8 94.0 94.3 94.5 95.0 95.4 95.8 95.7 95.7 94.0 94.8 Jász-Nagykun-Szolnok 84.0 87.9 92.6 93.6 93.7 94.2 94.7 94.8 95.0 95.0 95.1 94.9 95.1 95.0 95.5 96.2 Szabolcs-Szatmár-
Bereg
76.4 82.4 86.1 88.0 89.5 90.2 91.5 92.2 92.8 93.7 93.5 93.6 92.8 93.1 94.0 93.2 Northern Great Plain 84.2 88.1 90.4 91.5 92.1 92.7 93.3 93.7 94.0 94.5 94.6 94.8 94.5 94.6 94.4 94.6 Bács-Kiskun 81.1 84.2 84.3 84.2 85.0 85.5 86.7 86.9 87.2 87.4 87.7 87.8 87.3 87.1 87.4 87.5 Békés 83.7 86.5 88.0 89.5 89.7 90.0 90.1 89.9 90.6 93.1 93.2 93.2 94.1 93.8 94.5 94.8 Csongrád 89.5 88.8 89.4 90.5 90.5 89.4 89.6 90.0 91.3 91.6 91.7 91.5 90.1 90.1 91.0 91.6 Southern Great Plain 84.5 86.3 87.0 87.7 88.1 88.0 88.6 88.7 89.5 90.4 90.5 90.5 90.1 89.9 90.5 90.9
References
Boda, Z.; Scheiring, G.; Lobina, E. and Hall, D. (2008). 'Hungary', in N. Prasad (Ed.), Social policies and private sector participation in water supply. Beyond regulation. 178–202.
Basingstoke [England], New York: Palgrave Macmillan.
Gy, R. (Ed.) (1976). Debrecen iparának története a kapitalizmus kialakulásától napjainkig.
Debrecen.
Hegedüs, J.; Papp, M. and Péteri, G. (2010). Hungary: new stage of private sector participation. Annuaire 2010 des Collectivités Locales. Paris: CNRS, GRALE.
Hegedüs, J.; Péteri, G.; Tönkő, A.; Papp, M.; Pienaru, A. and Papa, A. (2013). "Effects of Governance Models on Affordability, Sustainability and Efficiency of the Water Services in Three Transition Countries (Armenia, Hungary, Romania) ". GDN Working Paper 83.
Horváth, M. and Péteri, G. (2012). 'Nem folyik az többé vissza: Az állam szerepének alakulása a víziközmű-szolgáltatásban. (On the role of the state in water supply)', in P.
Valentin, F. Kiss and C. Nagy (Eds), Verseny és szabályozás. 177–200. Budapest: MTA KRTK KTI.
Kornai, J. (2015). Hungary’s U-Turn. Capitalism and Society, 10(2), Article 1. Available at https://drive.google.com/file/d/0BwluZDKpQmyPWVhYM0s5Wk5IUFk/view?pli=1.
![Figure 10: Number of settlements with above threshold level of arsenic in drinking water (by counties) (Source: ÁNTSZ [National Public Health and Medical Officer Service]: Ivóvíz minőség, 2013,](https://thumb-eu.123doks.com/thumbv2/9dokorg/1398540.116939/2.892.124.701.113.358/settlements-threshold-drinking-counties-national-medical-ivóvíz-minőség.webp)