Susceptibility Regions Using Bayesian Network Based Bayesian Multilevel Analysis of Relevance
Ildiko´ Ungva´ri1., Ga´bor Hulla´m2., Pe´ter Antal2, Petra Sz. Kiszel1, Andra´s Ge´zsi1, E´va Hadadi1, Viktor Vira´g1, Gergely Hajo´s2, Andra´s Millinghoffer2, Adrienne Nagy3, Andra´s Kiss3, A´ gnes F. Semsei4, Gergely Temesi5, Be´la Melegh6, Pe´ter Kisfali6, Ma´rta Sze´ll7, Andra´s Bikov8, Gabriella Ga´lffy8, Lilla Tama´si8, Andra´s Falus1,4, Csaba Szalai3,4,5*
1Department of Genetics, Cell and Immunobiology, Semmelweis University, Budapest, Hungary,2Department of Measurement and Information Systems, University of Technology and Economics, Budapest, Hungary,3Heim Pal Children Hospital, Budapest, Hungary,4Inflammation Biology and Immunogenomics Research Group, Hungarian Academy of Sciences, Semmelweis University, Budapest, Hungary,5Csertex Research Laboratory, Budapest, Hungary,6Department of Medical Genetics, University of Pe´cs, Pe´cs, Hungary,7Dermatological Research Group, Hungarian Academy of Sciences, Szeged, Hungary,8Department of Pulmonology, Semmelweis University, Budapest, Hungary
Abstract
Genetic studies indicate high number of potential factors related to asthma. Based on earlier linkage analyses we selected the 11q13 and 14q22 asthma susceptibility regions, for which we designed a partial genome screening study using 145 SNPs in 1201 individuals (436 asthmatic children and 765 controls). The results were evaluated with traditional frequentist methods and we applied a new statistical method, called Bayesian network based Bayesian multilevel analysis of relevance (BN-BMLA). This method uses Bayesian network representation to provide detailed characterization of the relevance of factors, such as joint significance, the type of dependency, and multi-target aspects. We estimated posteriors for these relations within the Bayesian statistical framework, in order to estimate the posteriors whether a variable is directly relevant or its association is only mediated. With frequentist methods one SNP (rs3751464 in theFRMD6gene) provided evidence for an association with asthma (OR = 1.43(1.2–1.8); p = 361024). The possible role of theFRMD6gene in asthma was also confirmed in an animal model and human asthmatics. In the BN-BMLA analysis altogether 5 SNPs in 4 genes were found relevant in connection with asthma phenotype: PRPF19 on chromosome 11, and FRMD6, PTGER2 and PTGDR on chromosome 14. In a subsequent step a partial dataset containing rhinitis and further clinical parameters was used, which allowed the analysis of relevance of SNPs for asthma and multiple targets. These analyses suggested that SNPs in theAHNAK andMS4A2genes were indirectly associated with asthma. This paper indicates that BN-BMLA explores the relevant factors more comprehensively than traditional statistical methods and extends the scope of strong relevance based methods to include partial relevance, global characterization of relevance and multi-target relevance.
Citation:Ungva´ri I, Hulla´m G, Antal P, Kiszel PS, Ge´zsi A, et al. (2012) Evaluation of a Partial Genome Screening of Two Asthma Susceptibility Regions Using Bayesian Network Based Bayesian Multilevel Analysis of Relevance. PLoS ONE 7(3): e33573. doi:10.1371/journal.pone.0033573
Editor:Aaron Alain-Jon Golden, Albert Einstein College of Medicine, United States of America ReceivedJuly 12, 2011;AcceptedFebruary 15, 2012;PublishedMarch 14, 2012
Copyright:ß2012 Ungva´ri et al. This is an open-access article distributed under the terms of the Creative Commons Attribution License, which permits unrestricted use, distribution, and reproduction in any medium, provided the original author and source are credited.
Funding:This study was supported by OTKA (Hungarian Scientific Research Fund): K81941 (Dr. Szalai); TS/2 044707 (Dr. Falus); and ETT (Ministry of Health, Hungary) 415/2009 (Dr. Szalai), OTKAPD (Hungarian Scientific Research Fund):76348 (Dr. Antal), Bolyai Grant (Hungarian Academy of Science): (Dr. Antal) and NKTH (National Research and Technology) TECH_08-A1/2-2008-0120: (Dr. Falus). This work is connected to the scientific program of the Development of quality- oriented and harmonized R+D+I strategy and functional model at BME project. This project is supported by the New Sze´chenyi Plan (Project ID: TA´MOP-4.2.1/B- 09/1/KMR-2010-0002). Web pages for the funding organizations: OTKA: http://www.otka.hu/ NKTH: www.nih.gov.hu ETT: http://www.ett.hu/palyazat.htm Bolyai Grant: http://www.bolyaitestamentum.hu/?m=24 The funders had no role in study design, data collection and analysis, decision to publish, or preparation of the manuscript.
Competing Interests:As a part time job, Dr. Szalai is the head of Csertex Research Laboratory, which is a property of the Csertex Ltd which has two parts, one is a commercial company, the other one is a research laboratory, where basic researches are carried out, mainly about asthma and bioinformatics. This does not alter the authors’ adherence to all the PLoS ONE policies on sharing data and materials.
* E-mail: genomika.cs@gmail.com
.These authors contributed equally to this work.
Introduction
Asthma is a multifactorial disease influenced by wide range of genetic and environmental factors. Despite the numerous genetic studies carried out to gain insight into its complexity, our understanding of the nature and consequences of the genetic variations remains limited. Several potentially important genomic regions have already been identified but the causal alterations
which could be responsible for the observed linkages are sometimes not discovered or more frequently the results of the association studies cannot be confirmed by other studies. One of the disputed genomic regions in asthma is the chromosome 11q13 where positive linkage to atopy was first reported by Cookson et al. [1]. Subsequent association tests carried out on this region revealed the importance of the genesMS4A2(earlier FceRI-borb chain of the high-affinity receptor for IgE), SCGB1A1 (earlier
uteroglobin or Clara cell secretory protein (CC16)), glutathione S- transferase pi(GSTP1)andGPR44(earlier CRTH2) in asthma and asthma related phenotypes [1,2,3,4].
Another frequently investigated asthma-related genomic region is the chromosome 14q22. Its attendance in the asthma development has been suggested by different whole-genome linkage studies [5]. Since then several genes have been shown to be involved in asthma-related processes in this region. These are genes for prostanoid transmembrane receptors, such as the prostaglandin-D2 receptor (PTGDR), the prostaglandin-E2 recep- tor (PTGER2) and the gene for galectin-3 (LGALS3) [6,7,8].
Despite the fact that associations of these regions and genes to asthma phenotypes were found earlier, none of them was confirmed subsequently by genome-wide association studies (GWAS) and meta-analyses [9,10,11].
This frequent phenomenon of genetic association studies has been explained by several theories, like the insufficient phenotypic descriptors (e.g. oversimplified case-control approach), insufficient observations (e.g. the negligence of rare genetic and epigenetic variants), ethnic differences between the study populations, confounding factors (population stratification and admixture), conventional design errors (small sample size, the multiple testing problem, small minor allele frequencies, curse of dimensionality, bias-variance dilemma, model complexity and significance, etc.), the inappropriate approach towards complex traits (i.e. disregard- ing the role of high-number of weak factors, gene-gene interactions, pathway-based interpretation), and the high redun- dancy of predictors (e.g. the discovery of non-causal, transitively associated descriptors) [12].
To overcome several of these limitations, probabilistic graphical models (PGMs) were proposed. Thanks to their ability to efficiently and accurately represent complex networks, PGMs represent powerful tools to dissect the genetic susceptibility of complex diseases. Bayesian networks are a popular class of PGMs, because they provide a clear, graphical semantics for representing a complete dependency-independency map of the domain.
Therefore, the graphical representation presents a crucial advantage to allow the distinction between direct (causal) and indirect (due to LD) SNP-phenotype dependencies, thus ensuring a precise mapping of causal mutations. Additionally, BNs have the advantage of being able to efficiently deal with SNP–SNP interactions impacting the phenotype, a situation that is called epistasis.
Due to the high computational complexity and particularly because of the high sample (statistical) complexity, the learning of complete Bayesian network models is computationally prohibitive.
To cope with complexity several ‘local’ approaches have emerged which limit their scope, and focus on the identification of strongly relevant variables, and possibly their interaction and causal structure. Thus, they omit a global and detailed characterization of relevance relations [13].
Other approaches apply a resampling scheme (i.e. bootstrap) or the Bayesian statistical framework to cope with the relatively small sample size, and to provide uncertainty and robustness measures for various model properties [14,15,16]. Although these methods have a much higher computational complexity than local causal identification approaches, their main advantage is that the modeling is not restricted, thus global characterization of the dependencies in the domain is possible. In fact, these approaches provide an overall characterization of the domain without the use of dedicated target variables [15].
Specifically within the Bayesian statistical framework the uncertainty of the validity of a discrete hypothesis given the observations is expressed by a probability, which is interpreted as
an a posteriori belief in the hypothesis (e.g. above 0.5 it is more probable than not, see [17]). On the contrary, a p-value for a hypothesis in the frequentist approach is defined using the concept of repeatability and used indirectly through rejection to confirm a hypotheses.
Previously, we investigated the applicability of Bayesian networks using the Bayesian framework to learn the relevant variables with respect to a set of target variables. This could be seen as the Bayesian interpretation of the feature subset selection problem. We reported Monte Carlo methods to efficiently estimate posteriors over structural model properties, such as Markov blanket sets and Markov blanket graphs, which represent the strongly relevant variables and their interactions [18]. Based on these basic concepts we introduced a new statistical methodology, named Bayesian network based Bayesian multilevel analysis of relevance (BN-BMLA), which supports association analysis by estimating posteriors of strong relevance. In the context of genetic association studies, strongly relevant variables with respect to a phenotype represent the genetic and phenotypic factors that directly influence the phenotype (e.g. disease susceptibility). Strongly relevant variables statistically isolate the target variable from all other variables. However, the standard concept of pairwise association is not identical with the concept of strong relevance. First, if the dependency of a SNP to the phenotype is indirect due to LD with the causal SNP, then it is (transitively) associated but not strongly relevant to the phenotype.
Second, if a SNP has no main effect on the phenotype, but has an epistatic effect along with an other factor, then this SNP is not associated (according to the prevailing terminology), but strongly relevant to the phenotype (i.e. it is in pure interaction with the phenotype). Therefore, strong relevance indicates either a strong, direct association or a pure interactionist relevance. See Figure S1 for further comparison of the concept of association and strong relevance.
Additionally, posteriors for strong relevance and partial strong relevance for subsets of variables can also be computed. The concept of partial strong relevance, that a set ofkpredictors are strongly relevant, is particularly useful, because it defines a hierarchical, embedded hypotheses space with varying complexity.
For a given domain and sample size the posteriors over k-(strong)- relevance can be used to determine the sufficiency of the data and these posteriors can also be used to investigate statistical interactions [19]. These model properties with varying complex- ities support the overview, the post hoc interpretation, and the offline meta-analysis of weakly significant results [20]. We tested the BN-BMLA method in a case-control setup using artificial datasets for identifying interactions and conditional relevance and it was proven to be superior over other multivariate methods using conditional models designed to detect associations between genotypic variables and the target variable [21].
In this paper we report results of the BN-BMLA statistical method on real-world genotype data from our partial genome screenings of the 11q13 and 14q22 regions in asthmatic patients and controls. We apply and demonstrate the unique ability of BN- BMLA to provide (1) a complete overview about partial multivariate relevance (i.e., posteriors of partial relevance of k predictors for varying k), (2) an overview about various types of dependencies between a predictor and a target based on global characterization (i.e., posteriors that a predictor is directly or transitively dependent, or is in pure interaction), and (3) a joint characterization of relevance for multiple target variables (i.e. to model the dependencies of the targets). We compare these results with results from traditional frequentist methods, and discuss the relevant candidate genes and their interactions from the aspect of
association with asthma in our population. Among the newly identified genes FRMD6 showed the strongest association with asthma, and we confirmed the possible role of this gene in the disease in an animal model and in human asthmatics.
Methods Subjects
The study population comprised 1201 unrelated individuals of Hungarian (Caucasian) population. Approximately, 5% of tested subjects were probably of Gypsy origin (estimation based on state population statistics).
Four hundred and thirty six asthmatic children, age 3–18 were recruited to the study. All the asthmatic children had specialist physician-diagnosed asthma with the following characteristics: (1) recurrent breathlessness and expiratory dyspnea requiring treat- ment; (2) physician diagnosed wheeze; (3) reversibility of the wheezing and dyspnea by bronchodilator treatment measured as forced expiratory volume 1 s (FEV1) by a spirometer. All the asthmatics (or their parents) were instructed to record their symptoms accurately for 2 weeks, the treatment, and the peak expiratory flow (PEF) twice daily (in the evening and in the morning). PEF 100% was determined by calculation from the personal best value and the expected value according to the height of the patient.
If the patient is younger than 5 years old, the determination of lung function tests (PEF or FEV1) is usually not possible. In that case the diagnosis and classification of the disease were made according to the frequency and severity of other symptoms.
The treatment of the patients remained unchanged before the blood was drawn. None of the asthmatic had experienced an exacerbation or a respiratory infection for at least 4 weeks as indicated by increased symptoms.
The control children were randomly selected from outpatients from the Orthopaedic Department in the Budai Children’s Hospital and from the Urological Department of Heim Pal Hospital, Budapest. Children in the control group had mild musculoskeletal alterations (like pes planus or scoliosis), phimosis, or other small urogenital problems, showed no symptoms of asthma and required no medication. The adult controls were blood donors without asthma, and according to questionnaires they had not experienced asthma symptoms earlier. The control group comprised 765 subjects (mean age: 19612 years, 405 males/360 females).
In this paper we also demonstrate the ability of the BN-BMLA method to predict various types of dependencies from small amount of available data. For this purpose we applied the method to three embedded datasets: (1) the asthma status was known in all cases (1201 subjects, ‘‘A’’ dataset); (2) in all asthmatics (436) and in 664 controls, altogether in 1100 cases the status of rhinitis was also known (‘‘RA’’ dataset). Rhinitis was diagnosed in 278 asthmatics (64.0%), and in 233 controls (35.1%). Rhinitis was defined by troublesome sneezing or blocked or runny nose severely affecting the well being of the patient in periods without common cold or flu. Only those subjects were involved in this dataset whose rhinitis status was verified by specialists; (3) in 200 children (106 asthmatics and 94 controls) the status of rhinitis and the serum levels of total IgE and eosinophil were known (‘‘CLI’’ dataset, Table 1).
For the measurement of gene expression level in induced sputum, 31 adults between 19 to 61 years old were enrolled in the study, but 10 of them were excluded from the analysis because the qualities of the sputum samples were not appropriate. The study population comprised of 12 asthmatic patients (5 males and 7 females; mean age 36.3613.0 years) and 9 controls (4 males and 5
females; mean age 29.364.9 years). The 12 asthmatic patients had mild atopic stable asthma, no other lung diseases and no lower respiratory tract infection. Patients were required to have FEV1 of greater than 70% of predicted, baseline methacholine PC20 (the provocative concentration of methacholine causing a 20% fall in FEV1) of less than 16 mg/ml. The 9 healthy volunteers were recruited from the staff and students of the participating Hungarian universities. They gave no history of respiratory diseases, had a FEV1/FVC.80% and normal methacholine airway responsiveness (PC20.16 mg/ml).The included groups did not differ statistically regarding age, sex, smoking status and allergy.
The study was conducted according to the principles expressed in the Declaration of Helsinki, and approved by the Ethics Committee of the Hungarian Medical Research Council (ETT TUKEB; http://www.ett.hu/tukeb/tukeb.htm). Written informed consent was obtained from all patients or from the parents or guardians of the minors involved in the study.
Laboratory analysis
Genomic DNA was extracted from peripheral blood using DNA blood isolation midi kit (Qiagen, Valencia, CA).
Multiplex PCR and SNP genotyping for 144 SNPs were performed using 48- and 12plex genotyping assays on GenomeLab SNPstream genotyping platform (Beckman Coulter Inc. Fullerton, CA) using single-base primer extension technology. In addition, SNP rs545659 was genotyped using TaqMan SNP Genotyping Assay (Applied Biosystems, Warrington, UK) on an Applied Biosystems 7900 Real Time PCR System as per instructions of the manufacturer. Some samples were genotyped in duplicate in the same and in different plates. Only those SNPs where the genotyping call rate was .90% were included in the analysis.
Some SNPs genotyped on GenomeLab SNPstream genotyping platform were also genotyped using TaqMan SNP Genotyping Assays. No difference between the results of the two methods was revealed.
Total serum IgE levels were determined by 3gAllergy blood tests in Immulite 2000 Immunoassay System (Siemens Healthcare Diagnostics; Deerfield, IL USA).
The eosinophil cell counts were measured by Coulter MAXM Analyser.
RNA was isolated with the Qiagen Mini RNeasy kit (Maryland, USA). RNA was transcribed to cDNA with the High Capacity cDNA Reverse Transcription Kit (Applied Biosystems, Foster City, CA). Real-time quantitative PCR was performed for the genes found to be relevant in asthma in our analyses (FRMD6, PTGDR,PTGER2,MS4A2,AHNAK,PRPF19,TXNDC16) andb- actin using an ABI 7900HT Fast Real-Time PCR System (Applied Table 1.Some characteristics of the study subjects belonging to the CLI dataset.
Clinical and biological characteristics Asthmatics Controls
Number 106 94
Age, years 11.566.1 13.064.2
Gender, male/female 63/43 55/39
Rhinitis (%) 66.0 31.9
Total IgE kU/l 260.46111 94.6663
Eosinophil cell count 106/ml 0.3460.25 0.1460.07 doi:10.1371/journal.pone.0033573.t001
Biosystems, Foster City, CA) and TaqMan Gene Expression Assays. Relative gene expression was determined by the comparative CT method (ddCT) withb-actin as the endogenous control.
Sputum induction and analysis
Sputum was collected from 20 asthmatic and 11 healthy volunteers. The participants inhaled 4.5% saline solution gener- ated by a De Vilbiss Nebulizer (Ultra-NebTm 2000 model 200HI) for 5 minutes after pre-treatment with 400mg of inhaled salbutamol. Induction was performed three times and the pulmonary function was measured each time after the sputum induction. All portions that macroscopically appeared free of salivary contamination were selected. Samples were diluted with phosphate buffered saline containing 0.1% dithiotreitol (Sigma, St Louis, MO, USA), portions were agitated with a vortex and placed on a bench rocker for 30 minutes. Samples were filtered through a 40mm Falcon cell strainer, and centrifuged at 1500 rpm for 10 minutes. The cell pellet was resuspended in 1 ml PBS and viability (Trypan blue exclusion method) was determined using Burker chamber. After differential cell count, cells were stocked on lyses buffer at280uC until use.
SNP selection
SNPs in chromosome region 11q12.2-q13.1 and 14q22.1-22.3 were selected using HapMap data analyzed with Haploview 4.1 (http://www.hapmap.org). Our gene coverage pipeline included tag SNPs for all of the detected haplo blocks with minor allele frequency .0.05 and selected at an r2 of 0.8 for the CEU population. In addition to using LD criteria, we also added SNPs based on spacing across the region and their estimated functionality. In this manner we selected 145 SNPs in the given regions of Chr 11 and Chr 14 (68 and 77 SNPs, respectively) for genotyping. See Table S1 for detailed information on the examined SNPs.
Statistical methods
Frequentist methods. Allele frequencies were calculated by allele counting. Data were analyzed using MedCalc 5.0 and SPSS 11.5 programs. Hardy-Weinberg equilibrium was tested by using a x2goodness-of-fit test. x2 test was used to test for differences in allele distribution between the groups. Logistic regression adjusted for age and sex was applied to assess the effect of the genetic background to dichotomous clinical characteristics. Confidence intervals were calculated at the 95 percent level. Estimated haplotype frequency was calculated by Haploview 4.1: http://
www.broad.mit.edu/mpg/haploview/. Haplotype-specific ORs were estimated using conditional logistic regression to model the log odds of disease as a function of the individuals’ haplotype probabilities. Normalized gene expression levels were compared by t-test. Power analysis was carried out by genetic power calculator (http://pngu.mgh.harvard.edu/,purcell/gpc [22].
In order to facilitate a multivariate based frequentist analysis we applied multivariate logistic regression and multifactor dimension- ality reduction (MDR). MDR is a nonparametric and genetic model-free data mining method for detecting nonlinear interac- tions among discrete genetic and environmental variables [23].
BN-BMLA method. A Bayesian Network (BN) is a directed acyclic graph (DAG) that represents a joint probability distribution of a set of random variables{X1, X2, …, Xn}. These refer to the observed or measured factors (e.g. SNPs, clinical parameters) from a specific domain. A node of the graph represents a variable and an edge between two nodes represents a direct dependency between the variables.
Learning a BN structure (i.e. the dependence relations of the variables) is finding a DAG that best describes the dataset. In most cases, where the amount of available data is modest relative to the number of variables there are likely to be many models that have non-negligible posteriors. However, there might be certain structural features, e.g. the presence of an edge, that we can extract reliably. A central structural feature is related to the concept of strong relevance of a single variable or a set of variables.
For the definition of Markov blanket sets (MBS), see [24], for strong relevance, see [25], for Markov blanket membership (MBM), see [26] and for their relation, see [27].
WithBayesian learningwe can estimate the strength with which the data indicates the presence of a certain feature by estimating its a posteriori probability (Eq. (1)):
P(fDD)~X
G
P(GDD)f(G)
whereGrepresents a BN structure,Dis the dataset, andf(G) is 1 if the feature holds inGand 0 otherwise (for an overview, see [28].
For example, we refer top(MBS =s|D) as the MBS posterior ofs.
Bayesian learning. To calculate the first term of the summation in Eq.(1) we use Bayes rule, and we have that
P(GDD)!P(DDG)P(G):
The term P(D|G) is the marginal likelihood of the data given structureG, and the termP(G) is the prior probability of a structure G. We used uniform prior over structures in our experiments.
Assuming that the dataset D is complete (i.e., there are no missing values), the variables are multinomial with a Dirichlet parameter prior for every possible instantiations of their parents, and the prior P(G) satisfies parameter independence, parameter modularity, and structure modularity then the marginal likelihood has an efficiently computable closed form [29].
Bayesian model averaging. As it is mentioned before, our goal was to compute the posterior probability of a feature (i.e., Eq.(1)). Because the number of BN structures is super-exponential in the number of random variables in the domain, exact summation of all possible structuresGis computationally intractable (see [29,30].
We used Metropolis Coupled Markov Chain Monte Carlo (MC3) [31] methods for the approximation of Eq.(1). We defined parallel Markov chains over the space of DAGs, whose stationary distribution were the posterior distribution P(G|D). We then generated samples by doing random walks in these chains, and used them to estimate Eq. (1) (for convergence and confidence diagnostics, see [32].
Each step in a Markov Chain corresponds to local transforma- tions of the DAG, called operators [33,34]. Following Castello, we used three operators: (1) adding an edge to the DAG, if it does not violate the acyclic constraint, (2) reversing an edge, if it does not violate the acyclic constraint and (3) removing an edge from the DAG. The probability of the operator selection was uniform.
We ran the MCMC sampler with a burn-in period of 106steps and then collected 56106samples. We restricted the space of the possible structures limiting the number of parents per node to 8.
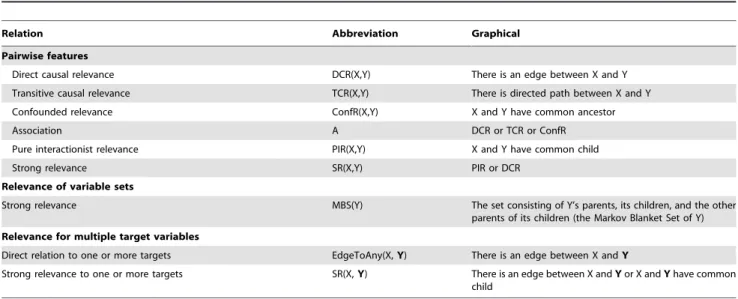
We computed a posteriori probabilities for structural features summarized in Table 2.
See Figure 1 for a graphical example.
In a post-processing step, we introduced the concept ofk-MBS as theksized subset of the strongly relevant variables [19]. The a posteriori probability of the sub-relevance of ak-sized setsis
p(sDD)~P(MBS(Y)~sDD)zX
s5s’
P(MBS(Y)~s’DD),
where the terms are the exact MBS posterior of the setsand the MBS posterior for all its superset.
The concept ofk-MBS was motivated by the observation that typically the most probable strongly relevant variable sets often share a significant common part. This partial multivariate approach provides an intermediate and scalable complexity for the analysis. Note that the cardinality of the k-MBS features is O(nk) and the aggregation involves optionally 2n MBS subsets, which is limited by the number of the DAG structures visited in the MCMC run, i.e. by the number of steps, which is typically 56106, resulting in 104different DAGs and MBS sets.
Posterior values are between 0 and 1, where 0 indicates no relevance, 1 indicates 100% relevance between a predictor and a target variable. In our study we consider a variable relevant when its posterior is greater than or equal 0.5.
Results
Frequentist analysis
From the 145 genotyped SNPs 5 SNPs were monomorphic (MAF = 0), 5 deviated from Hardy-Weinberg equilibrium in controls (p,0.005) and 33 had poor genotyping results (poor genotype clusters or low call rates) and were not considered for further analyses leaving 102 SNPs (59 in 14q22.1-22.3 and 43 in 11q12.2-q13.1) for frequentist and BN-BMLA analyses.
Table S2 shows the minor allele and genotype frequencies in asthmatic and control patients. Table S3 presents the statistical evaluation for association of SNPs with asthma at allele and genotype levels.
When allele frequencies were considered, one SNP (rs3751464) in theFRMD6gene provided an evidence for an association with asthma (OR = 1.43 (1.18–1.75); p = 361024). Only this SNP could withstand the correction for multiple testing. Because 102 SNPs were considered, the Bonferroni corrected significance level was 561024. This result is compatible with a power analysis which showed that the power of frequentist statistical tests are less than 0.2 for OR below 1.3 at sample size of 1200 (complete dataset).
When the genotype frequencies were considered, the CC genotype of the SNP rs17831682 provided strong evidence for an association (P = 3.961024), indicating a recessive model. This SNP is located in the 39UTR of thePTGDRgene and considered as an exonic splicing enhancer (Genecards). Haplotypes were construct- ed from the investigated SNPs (Figure S2). The permutation based Table 2.Structural features that indicate different dependence types between the variables.
Relation Abbreviation Graphical
Pairwise features
Direct causal relevance DCR(X,Y) There is an edge between X and Y
Transitive causal relevance TCR(X,Y) There is directed path between X and Y
Confounded relevance ConfR(X,Y) X and Y have common ancestor
Association A DCR or TCR or ConfR
Pure interactionist relevance PIR(X,Y) X and Y have common child
Strong relevance SR(X,Y) PIR or DCR
Relevance of variable sets
Strong relevance MBS(Y) The set consisting of Y’s parents, its children, and the other
parents of its children (the Markov Blanket Set of Y) Relevance for multiple target variables
Direct relation to one or more targets EdgeToAny(X,Y) There is an edge between X andY
Strong relevance to one or more targets SR(X,Y) There is an edge between X andYor X andYhave common child
doi:10.1371/journal.pone.0033573.t002
Figure 1. Illustration of different dependency types between variables in a Bayesian Network structure. Pairwise relevance relations: Direct causal relevance (e.g., Y1 and SNP1 have common edge), Transitive causal relevance (e.g., there are two directed paths between Y3 and SNP5), Confounded relevance (e.g., Y2 and SNP3 have a common ancestor SNP1), Association (e.g., Y1 and SNP1, because SNP1 is directly related to Y1; Y3 and SNP5, because SNP5 is transitively related to Y3; Y2 and SNP3, because they are in a confounded relation), Pure interactionist relevance (e.g., Y1 and SNP7 have common child), Strong relevance (e.g., Y1 and SNP1, because SNP1 is directly related to Y1; Y1 and SNP7, because they are in pure interaction).Relevance of variable sets: Strong relevance (e.g., the variable set consisting of Y2’s parents, its children, and the other parents of its children is {Y1, SNP9, Y3, SNP7}).Relevance for multiple target variables: Strong relevance to one or more targets (e.g., the variable set consisting of {Y1,Y2,Y3}’s parents, its children, and the other parents of its children is {SNP1, SNP4, SNP7, SNP9}).Red nodes: potential target variables,Green nodes: SNP variables.
doi:10.1371/journal.pone.0033573.g001
association test of Haploview indicated two haplotypes consisting of two SNPs (rs3751464 and rs17666653) in theFRMD6gene for association with asthma. The TC haplotype increased the susceptibility to asthma (OR = 1.41 (1.07–1.87); permutation p value 0.048), while the CC haplotype reduced it (OR = 0.73 (0.57–
0.92); permutation p = 0.02) constructed from rs3751464 and rs17666653, respectively. The haplotype frequencies were for TC:
0.191 and 0.251 and for CC 0.606 and 0.528, in controls and cases, respectively. The rs17666653 is located in intron 4 of the FRMD6gene.
Bayesian network based Bayesian multilevel analysis of relevance
Sufficiency of the data. In the Bayesian context we first investigated the sufficiency of the sample size of all datasets (A:
1201, RA: 1100, CLI: 200) for performing a full-scale multivariate analysis to identify the set of relevant variables. This confirmed the necessity of a partial multivariate approach, because there was neither a dominant set nor a set of highly significant sets for the A/
RA and especially not for the CLI datasets (Figure S3).
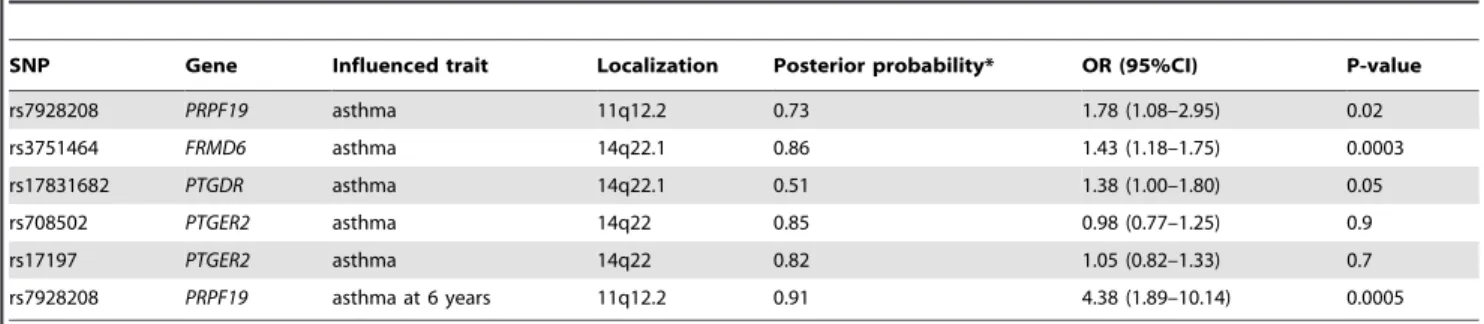
Strong univariate relevance. The most relevant SNPs and genes (i.e. with high posteriors for strong relevance with respect to asthma) according to the BN-BMLA are presented in Table 3. In the last column the p values and odds ratios calculated with logistic regression are also shown. Altogether 5 SNPs in 4 genes were found relevant in connection with asthma phenotype:PRPF19on chromosome 11, and FRMD6, PTGER2 and PTGDR on chromosome 14. The SNP rs7928208 in the gene PRPF19 is also associated with early childhood asthma (in case of children under 6 years).
Table 4 summarizes the posterior probability of strong relevance for the most relevant SNPs for asthma and for multiple targets, in case of RA and CLI data sets. By multiple targets we mean rhinitis+asthma (RA data set) and IgE level+eosinophil level+rhinitis+asthma (CLI data set) respectively. In case of the RA data set two SNPs in the AHNAK gene gave the strongest correlation with the phenotype asthma+rhinitis. Interestingly, a SNP in the most studied gene of the 11q13 region, theMS4A2, the gene for the high affinity IgE receptor b subunit showed an association when the CLI data was considered.
Partial multivariate relevance. The multivariate analysis of strong relevance (i.e. the posterior probabilities of Markov blanket sets with asthma as a target, for details see Methods) indicated a very flat posterior distribution. This means that there are several possible strongly relevant sets with low posteriors instead of a dominant set with a high posterior. On the other hand, the aggregation of the multivariate results into univariate conclusions, i.e. strong univariate relevance (described previously)
indicated that model averaging can unhinge significant results.
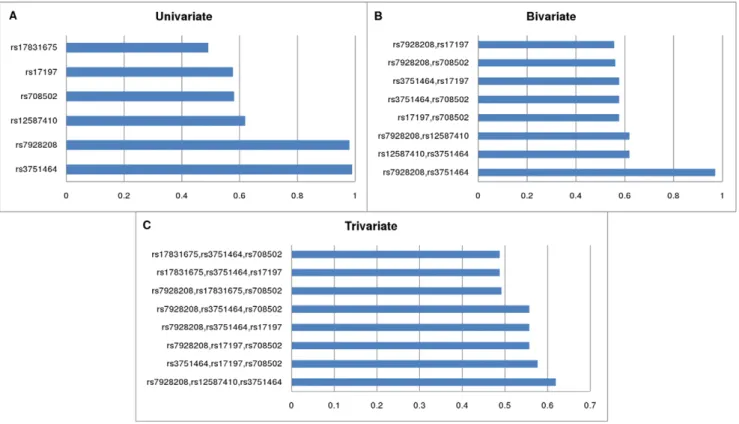
Furthermore, it is also possible to aggregate multivariate results into partial multivariate results (i.e.k-sized subsets, as detailed in the Methods section),
This allows the investigation of SNP-SNP interactions, because a subset with a high posterior can indicate that these SNPs have a joint effect on the susceptibility of asthma (for a detailed investigation of interactions, see [19]. Results for partial relevance are systematically presented in Figure 2 showing the highest posteriors for various subset sizes (k). In this case the ‘‘A’’ dataset was evaluated using asthma as a target variable. The high posteriors fork= 1,2,3,4 indicate that the data is sufficient to infer that these variables are jointly strongly relevant, but above that level (k$5) as shown in Figure S4 the multivariate results are weakly significant.
We applied the MDR method on the ‘‘A’’ dataset for model sizes (k = 1,2,3,4) using an exhaustive evaluation. The results confirmed the strong significance of rs3751464 of FRMD6, because it was the most frequent part of the models. However, the difference in model scores within a certain model size was low.
The range of scores for the 20 highest scoring models containing 1, 2, 3, and 4 variables were 0.548–0.521, 0.561–0.556, 0.592–0.586, and 0.639–0.630 respectively. Furthermore, the 20 highest scoring models of each size (1–4) contained 51 different SNPs altogether, which also confirms the low power of MDR in case of this data set.
In contrast to the approach followed in BN-BMLA, model averaging was not possible because of the frequentist nature of the MDR score (compare with Eq.1.). Manual investigation of MDR results indicated that the following SNPs were often parts of the highly significant models: rs3751464 inFRMD6, rs17831675 and rs17831682 inPTGDR, rs708502 and rs708486 inPTGER2.
We also performed logistic regression analysis on the ‘‘A’’ data set with SPSS using PIN = 0.05 as the probability threshold for variable entry, and POUT = 0.1 as the threshold of removing a variable from the model. The forward variable selection method confirmed the strong significance of rs3751464 in FRMD6 (exp(B) = 1.51, C.I. 95%: [1.23–1.86], p-value,0.001) and rs7928208 in PRPF19 (exp(B) = 0.56, C.I. 95%: [0.33–0.92], p- value = 0.024). The logistic regression with backward variable selection method was also applied for the 10 most significant variables and their interactions indicated by BN-BMLA. It confirmed the strong significance of rs3751464 (FRMD6), rs708502 (PTGER2), and rs7928208 (PRPF19) and their interac- tions (see detailed analysis in Gene-gene interactions Section).
Gene-gene interactions. The k-MBS concept from BN- BMLA represents the joint relevance of k variables. However, their effects can be linear or non-linear at some scale, which is indicated by the absence or presence of interaction terms in appropriate statistical models. Furthermore, (non-linear) Table 3.Properties of the most relevant SNPs including posteriors for strong relevance with respect to asthma.
SNP Gene Influenced trait Localization Posterior probability* OR (95%CI) P-value
rs7928208 PRPF19 asthma 11q12.2 0.73 1.78 (1.08–2.95) 0.02
rs3751464 FRMD6 asthma 14q22.1 0.86 1.43 (1.18–1.75) 0.0003
rs17831682 PTGDR asthma 14q22.1 0.51 1.38 (1.00–1.80) 0.05
rs708502 PTGER2 asthma 14q22 0.85 0.98 (0.77–1.25) 0.9
rs17197 PTGER2 asthma 14q22 0.82 1.05 (0.82–1.33) 0.7
rs7928208 PRPF19 asthma at 6 years 11q12.2 0.91 4.38 (1.89–10.14) 0.0005
*Strong relevance.
doi:10.1371/journal.pone.0033573.t003
interactions can be epistatic, i.e. a SNP has no main effect on the phenotype, but has an effect along with an other factor. As can be seen in the last column of Table 3, the distribution of the two SNPs in thePTGER2 gene does not differ between the asthmatic and control groups. It implies that these SNPs do not influence asthma
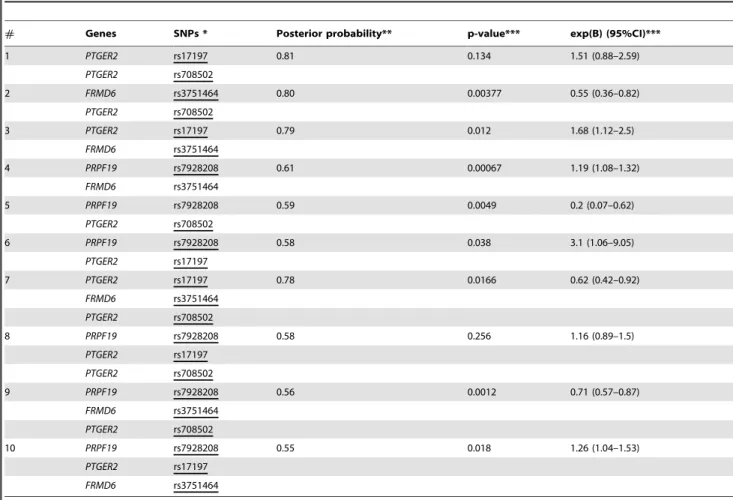
risk alone, only in interaction with other variables, in this case with other SNPs. Table 5 presents the most probable gene-gene (SNP- SNP) joint relevances and interactions for asthma as a target variable. In this evaluation significant interactions between 2 and 3 SNPs were revealed. The table shows the p-values and the
Figure 2. The most probable univariate (MBM), bivariate (2-MBS), trivariate (3-MBS) subsets of variables (Asthma dataset).Relevant SNPs having high or moderately high posteriors, i.e. high probability of being a member of the Markov blanket (MBM) of the target variableAsthma (A). Relevant SNP sets of size 2 (B); and of size 3 (C) indicating partial strong relevance. 2-MBS and 3-MBS denote the k = 2 and k = 3 sized subsets of Markov blanket sets. A highk-MBS posterior of a set of SNPs indicates their joint relevance and possible interactions between the SNPs.
doi:10.1371/journal.pone.0033573.g002
Table 4.The posterior probability of strong relevance for the most relevant SNPs in case of RA and CLI data.
RA* CLI**
Gene SNP Asthma Multitarget Asthma Multitarget
AHNAK rs11231128 0.801 0.826 0.394 0.684
AHNAK rs11827029 0.798 0.810 0.426 0.774
FRMD6 rs3751464 0.324 0.280 0.039 0.267
MS4A2 rs569108 0.098 0.151 0.441 0.787
PRPF19 rs7928208 0.801 0.781 0.145 0.449
PTGDR rs17831675 0.371 0.365 0.424 0.669
PTGDR rs17831682 0.542 0.598 0.466 0.703
PTGER2 rs12587410 0.367 0.348 0.772 0.922
PTGER2 rs17197 0.380 0.371 0.596 0.881
PTGER2 rs708498 0.248 0.206 0.557 0.688
TXNDC16 rs1565970 0.754 0.717 0.235 0.484
*RA – Asthma: RA dataset, Asthma as target.
RA – Multitarget: RA dataset, Asthma and Rhinitis as targets.
**CLI – Asthma: CLI dataset, Asthma as target.
CLI – Multitarget: CLI dataset, IgE level-Eosinophil level-Rhinitis-Asthma as targets.
doi:10.1371/journal.pone.0033573.t004
corresponding odds ratios for the interaction terms in logistic regression calculated with SPSS using the enter method. The most relevant interactions include intrachromosomal (e.g. rs708502 in PTGER2 and rs3751464 in FRMD6) and interchromosomal interactions: rs7928208 in PRPF19 (chr. 11) with rs708502 in PTGER2 (chr. 14) and rs7928208 in PRPF19 (chr. 11) with rs3751464 inFRMD6(chr. 14). Interestingly, the joint interaction of these three variables is also significant (exp(B) = 0.72, C.I. 95%:
[0.58–0.89], p-value = 0.002) which is indicated by the logistic regression backward method (described in the previous section).
According to these results, the most significant SNP in this study is the rs3751464 in theFRMD6gene. It influences the asthma risk both alone and in interactions with other SNPs inPRPF19and PTGER2genes. In all the interactions with the minor rs3751464 TT genotype significantly increase the asthma risk, while interactions with the more frequent CC genotype decrease the asthma risk (data not shown).
Detailed characterization of association relations. The association of a genetic variant to a phenotypic feature can have multiple types. First, because of the dependency of the genetic factors (due to linkage disequilibrium or evolutionary patterns), the markers typically found in genetic association studies are rarely directly associated to the phenotype. In these cases, the association is transitive, i.e. it is mediated by the causal SNP. For example, in case of PTGDR, the posterior of association of the SNPs (rs17831675, rs17831682, and rs803012) to asthma are larger
than 0.9, but rs803012 can be excluded as strongly relevant, because its posterior of strong relevance is lower than 0.005, which indicates its non-causal, non-functional role. Second, in case of multiple targets, which originate potentially from a complex dependency model, the association can be mediated by phenotypic variables. For example in case of the asthma a possible dependency model is shown in Figure 3, in which a SNP affecting IgE might be both directly and transitively associated with asthma.
To evaluate the global characterization of association types shown in Table 2, we computed the a posteriori probability Table 5.Gene-gene (SNP-SNP) joint relevance and interactions for asthma susceptibility.
# Genes SNPs * Posterior probability** p-value*** exp(B) (95%CI)***
1 PTGER2 rs17197 0.81 0.134 1.51 (0.88–2.59)
PTGER2 rs708502
2 FRMD6 rs3751464 0.80 0.00377 0.55 (0.36–0.82)
PTGER2 rs708502
3 PTGER2 rs17197 0.79 0.012 1.68 (1.12–2.5)
FRMD6 rs3751464
4 PRPF19 rs7928208 0.61 0.00067 1.19 (1.08–1.32)
FRMD6 rs3751464
5 PRPF19 rs7928208 0.59 0.0049 0.2 (0.07–0.62)
PTGER2 rs708502
6 PRPF19 rs7928208 0.58 0.038 3.1 (1.06–9.05)
PTGER2 rs17197
7 PTGER2 rs17197 0.78 0.0166 0.62 (0.42–0.92)
FRMD6 rs3751464
PTGER2 rs708502
8 PRPF19 rs7928208 0.58 0.256 1.16 (0.89–1.5)
PTGER2 rs17197
PTGER2 rs708502
9 PRPF19 rs7928208 0.56 0.0012 0.71 (0.57–0.87)
FRMD6 rs3751464
PTGER2 rs708502
10 PRPF19 rs7928208 0.55 0.018 1.26 (1.04–1.53)
PTGER2 rs17197
FRMD6 rs3751464
*Interaction terms were forced into logistic regression using the enter method. The main effects entered are indicated with underscore.
**Posterior probability of joint relevance.
***P-value and exp(B) values corresponding to the interaction terms in logistic regression using continuous variables.
doi:10.1371/journal.pone.0033573.t005
Figure 3. A possible dependency model in asthma.An example for a possible transitive association between IgE and Asthma. Although there is a possible direct relationship, IgE level may relate to asthma indirectly via eosinophil or a presence of allergy.
doi:10.1371/journal.pone.0033573.g003
whether a variable is directly relevant or its association is only mediated in cases where the rhinitis status was known (RA dataset;
Table 6). Additionally, we computed whether a variable is in pure interaction or its association is pure confounded.
Here we present some examples how the results in Table 6 can be interpreted. The posterior that rs7928208 (PRPF19) is transitively associated to asthma is 0.822, and the posterior for a
‘‘direct’’ relation, which is not blocked by any other variable, is similarly high (0.718; RA dataset, asthma as a target variable). On the contrary, the posterior that, rs569108 inMS4A2is transitively associated with asthma is 0.633, but the posterior for a ‘‘direct’’
relation is only 0.087. Another interesting example is rs11231128 in AHNAK. The posterior that it is transitively associated with asthma is 0.535, the posterior that it is strongly relevant is 0.736, and the posterior for a ‘‘direct’’ relation is only 0.029, The higher probability of strong relevance compared to the posterior for a transitive relation indicates a pure interaction (0.708), which suggests that this SNP is relevant only if the rhinitis status is known. Furthermore, when rhinitis status was excluded from the data set the strong relevance of rs11231128 for asthma vanished (data not shown). This shows that this SNP is strongly relevant through interaction with rhinitis.
Association to multiple targets. To decompose the relevance of genetic factors for various phenotypes we computed and compared the posteriors for the strongly relevant variables with respect to each target variable, namely IgE, and eosinophil levels, rhinitis and asthma (CLI dataset), which participate in a complex causal model with multiple paths. Posteriors of the decomposed relevance for multiple target variables are presented in Table 7.
We would like to demonstrate how the results in Table 7 can be interpreted through an example. Following the earlier discussion of rs569108 inMS4A2, the results on the CLI data indicate that this SNP is strongly relevant to some of the CLI targets with a posterior of 0.77. In case of rs708498 in PTGER2the difference between the posteriors is more significant. The posteriors for strong relevance with respect to IgE, eosinophil level, rhinitis and asthma is 0.09, 0.04, 0.05,0.61, which clearly indicates that a relationship between rs708498 and asthma is more probable than
a relationship with any other targets. Furthermore, the posterior probability that rs708498 is strongly relevant exclusively to IgE, eosinophil level, rhinitis or asthma are 0.03, 0.01,0.02, 0.50, which shows that it is more probable that this SNP is exclusively related to asthma than to any other phenotype. This is also supported by the posteriors that this SNP is strongly relevant to other targets, but not to IgE,eosinophil level, rhinitis or asthma: 0.58, 0.64, 0.62, and 0.07, with the lowest posterior for asthma in this respect.
Finally, the posterior for rs708498 being a relevant SNP for multiple phenotypes (0.67) is relatively close to the posterior of strong relevance for asthma (0.61), which shows that relations to other targets are negligible.
Figure 4 displays the posteriors for strong relevance detailed in Table 7 providing an overall view on strong relevance with respect to the targets in CLI data set on the level of genes. It indicates that PTGER2(rs12587410, rs17197, rs1254600, rs708498) is related to asthma with a higher probability, whereasPTGDR (rs17831682, rs17831675, rs17125273) is slightly more relevant with respect to IgE levels, though the difference between posteriors for strong relevance of different targets is lower in the latter case.
The fact that the average posterior for strong relevance in case of the most relevant SNPs is moderate (in case of asthma as a target) or low (in case of IgE, eosinophil and rhintis) indicates that the CLI data set is at its limit in terms of data sufficiency. In fact, this resembles the flat posterior case mentioned previously.
However, even in this case, the results provided by the BN- BMLA method at least allow a restricted analysis of the domain.
Furthermore, in case of multiple targets, the joint strong relevance (multi-target relevance) approach provides a more robust poste- rior.
Figure 4 also shows the relationship between the strong multi- target relevance and its approximation based on single target posteriors. The former accounts for the interdependencies between targets, while the approximation treats the targets as independent factors. Therefore, in domains that contain a complex dependency model, the multi-target approach is more viable, since the assumption of independency will not hold. Thus the approximation for a joint relevance based on independently treated posteriors of targets will yield inaccurate results.
Table 6.The a posteriori probability that a SNP is directly relevant (D-Relevant), associated, strongly relevant (S-Relevant), transitive or in pure interaction with asthma using the RA data set.
GENE SNP Associated D-Relevant S-Relevant Interaction Transitive
AHNAK rs11231128 0.643 0.029 0.736 0.708 0.535
AHNAK rs11827029 0.868 0.021 0.728 0.707 0.399
FRMD6 rs3751464 0.862 0.284 0.300 0.016 0.331
MS4A2 rs569108 0.653 0.087 0.111 0.024 0.633
PRPF19 rs7928208 0.878 0.718 0.843 0.125 0.822
PTGDR rs17831675 0.923 0.326 0.362 0.035 0.747
PTGDR rs17831682 0.923 0.524 0.578 0.000 0.863
PTGDR rs803012 0.973 0.000 0.002 0.002 0.539
PTGER2 rs1254600 0.970 0.088 0.090 0.000 0.353
PTGER2 rs1254601 0.989 0.013 0.046 0.033 0.126
PTGER2 rs12587410 0.618 0.157 0.405 0.248 0.522
PTGER2 rs17197 0.970 0.350 0.354 0.004 0.604
PTGER2 rs708498 0.983 0.002 0.227 0.225 0.108
TXNDC16 rs1565970 0.309 0.008 0.722 0.713 0.189
doi:10.1371/journal.pone.0033573.t006
Analysis of gene expression in mice and men
Earlier we have carried out measurements of gene expression levels by Agilent Whole Mouse Genome Oligo Microarray 4644 K chips in the lungs of mice with allergic airway inflammation and control mice (GSE11911 record number in GEO database) [35]. All of the genes found to be relevant in the present study were expressed in the lung of the mice. We
compared the expression level of the genes in the lungs of mice with OVA-induced allergic airway inflammation and control mice.
Altogether, 1134 transcripts showed.2.0-fold statistically signif- icant differential expression [35], but none of the relevant genes in this study showed this level of difference. However, in all mice with OVA-induced experimental asthma the expression level of FRMD6was consequently lower (in average with 1.52 fold). From Table 7.The posterior probability of strong relevance of predictors for each target and for a multi-target case based on the CLI data set.
Exist Only Other than
GENE SNP IgE Eos Rhi Ast AP IgE Eos Rhi Ast IgE Eos Rhi Ast MT
PTGER2 rs1254600 0.08 0.12 0.15 0.31 0.52 0.04 0.07 0.08 0.21 0.44 0.40 0.38 0.21 0.46 PTGER2 rs12587410 0.31 0.38 0.53 0.81 0.96 0.02 0.02 0.04 0.16 0.65 0.58 0.43 0.15 0.91
PTGER2 rs17197 0.08 0.17 0.22 0.73 0.84 0.01 0.03 0.05 0.43 0.76 0.67 0.62 0.11 0.85
PTGER2 rs708498 0.09 0.04 0.05 0.61 0.68 0.03 0.01 0.02 0.50 0.59 0.64 0.62 0.07 0.67
PTGDR rs17125273 0.17 0.13 0.15 0.10 0.45 0.12 0.08 0.10 0.06 0.27 0.32 0.30 0.35 0.31 PTGDR rs17831675 0.52 0.41 0.48 0.44 0.92 0.09 0.06 0.08 0.06 0.40 0.51 0.44 0.48 0.66 PTGDR rs17831682 0.59 0.53 0.53 0.53 0.96 0.06 0.05 0.05 0.05 0.37 0.43 0.42 0.43 0.71
MS4A2 rs569108 0.31 0.47 0.37 0.43 0.87 0.06 0.12 0.08 0.10 0.56 0.40 0.50 0.44 0.77
Target variables: IgE level -IgE, Eosinophil level –Eos, Rhinitis –Rhi, Asthma –Ast.
‘‘Exist’’ denotes the probability of strong relevance with respect to a given target.
‘‘Only’’ denotes posteriors for strong relevance to exactly one of the targets.
‘‘OtherThan’’denotes posteriors for strong relevance to any other target than the one specified by the subcolumn.
‘‘AP’’ column contains an approximation of multi-target strong relevance based on the individual strong relevance posteriors of the targets.
‘‘MT’’ denotes the posterior of multi-target strong relevance.
doi:10.1371/journal.pone.0033573.t007
Figure 4. The posterior probability of strong relevance of predictors for each target and for a multi-target case based on the CLI data set.Posterior probabilities for strong relevance to Asthma, Rhinitis, Eosinophil and IgE level are indicated by different columns. Posteriors of joint strong relevance, i.e. multi-target relevance and its approximation based on the individual posteriors for strong relevance with respect to Asthma, Rhinitis, Eosinophil and IgE level are denoted by orange and blue curves, respectively. The approximation assumes independence between the targets, whereas the multi-target posterior accounts for the possible dependencies between the targets.
doi:10.1371/journal.pone.0033573.g004
the relevant genes in the present study no other genes showed such a consequent correlation.
Next, we studied the changes in the expression levels of genes in the known pathway involvingFRMD6. TheFRMD6is part of the conserved Hippo pathway playing a critical role in controlling organ size by regulating both cell proliferation and apoptosis [36]
(Figure 5). One of the best known target genes of this pathway is the antiapoptotic Birc5 [37,38] (also known as survivin) whose expression level showed 5.94 fold increase (corrected P = 0.001) in the lung of OVA induced mice.
We compared the gene expression levels of genes found to be relevant in asthma in the SNP analysis in sputum samples of 12 asthmatics and 9 controls using TaqMan Gene Expression Assays (FRMD6,PTGDR,PTGER2,MS4A2,AHNAK,PRPF19,TXNDC16).
Sputum mRNA level of FRMD6 was significantly lower in the asthmatic patients compared to healthy controls with a fold change of 2.73 (p = 1026). No other gene showed statistically significant difference in this comparison.
Discussion
In this paper we presented the results of a partial genome screening in asthma evaluated by several statistical methods. In 11q12.2-q13.1 and 14q22.1-22.3 genome regions, which were earlier identified as asthma susceptibility regions, we successfully genotyped 102 SNPs in 57 genes. Earlier, in different association studies several asthma genes were identified in these regions, but none of them were confirmed later by GWAS, although two of them (PTGDR and GSTP1) were verified in candidate gene association studies in several independent populations [9].
Additionally, in a study where the results of GWAS were combined with a candidate gene approach, polymorphisms in GSTP1also showed an effect on asthma susceptibility [9]. In our present study, using the BN-BMLA method, several earlier results were confirmed. Associations were confirmed between SNPs in
PTGDR,PTGER2,MS4A2and asthma. Interestingly, however, the frequentist method could only identify the association of the PTGDRgene, and was unable to detect it in the case of the other two genes. The explanation for this phenomenon is, that according to our evaluation, SNPs in the PTGER2 influence asthma susceptibility in interactions or indirectly, and similarly, the association between a SNP in MS4A2 and asthma is transitive, which is hard to detect with traditional frequentist methods. This might be one explanation why the association of the polymor- phisms in this gene, which is otherwise a very plausible gene in asthma and atopic diseases, could not be confirmed in the majority of the studies using traditional statistical methods [39,40,41].
MS4A2 gene (earlier known as FceRI-b), which codes for the high affinity IgE receptorbsubunit has a central role in mast cell degranulation and IgE mediated allergy.
The rs569108 SNP, which corresponds to the E237G amino acid substitution, is predicted to introduce a hydrophobicity change within the C-terminus of the receptor. It is adjacent to the immunoreceptor tyrosine activation motif, and may affect the intracellular signaling capacity of the receptor. The MS4A2was one of the first candidate genes in atopic diseases, and already in 1996 associations were found between E237G and significantly elevated skin test responses to different allergens and bronchial reactivity to methacholine in a UK population [42]. Since then, several studies in different populations have investigated the role of this polymorphism in asthma and atopy with very controversial results. In this study we could not confirm a direct association between E237G and asthma, but found a transitive association only when each target variable, namely IgE, and eosinophil levels, rhinitis and asthma (CLI dataset) were considered, which corresponded to a complex model with multiple paths.
It is well documented that, in asthmatics, prostaglandin D2 modulates the physiology of the airways by causing bronchocon- striction, vasodilation, and increase in capillary permeability and mucus production. Mice, lackingPTGDRfail to develop bronchial hyperresponsiveness upon ovalbumin challenge, suggesting that this receptor has an important role in the disease [43].
Polymorphisms in the gene have been reported to be associated with asthma in American, European and Japanese populations, but not in Chinese children, Latinos or Koreans [44]. In our study on Hungarian children, several SNPs showed different types of associations (direct or transitive). Interestingly, three SNPs (rs17831682, rs17831675, rs17125273) were slightly more relevant with respect to IgE levels, than asthma or other targets.
Prostaglandin E2 exerts anti-inflammatory and bronchoprotec- tive mechanisms in asthma, it inhibits the chemotaxis of eosinophils toward eotaxin, prostaglandin D2 and C5a [45].
Polymorphisms in its receptorPTGER2were mainly found to be associated with aspirin-intolerant asthma, but in some studies also with asthma in general [46]. In our study the distribution of the SNPs in thePTGER2gene did not differ between the asthmatic and control groups. But, when SNP-SNP interactions were calculated, polymorphisms of the PTGER2 participated in each significant association. This implies that these SNPs do not influence asthma risk alone, but in interaction with other SNPs.
When multiple targets were considered the SNPs of this gene showed relevance only to asthma and the relations to other targets (IgE and eosinophil levels or rhinitis) were negligible.
Besides confirming previous results, the present study also detected new asthma genes in these regions. The most remarkable result of the study is the role of FRMD6in asthma. Association between a SNP inFRMD6 and asthma risk was identified with both the frequentist and BN-BMLA methods. A haplotype in this gene also influenced the disease susceptibility, and the rs3751464 Figure 5. Hypothesized connection between FRMD6 and Birc5
in the conserved Hippo pathway. Hypothetic hippo pathway components in mammals are shown in various colors, with pointed and blunt arrowheads indicating activating and inhibitory interactions, respectively. The pathway regulates transcriptions of several genes, among others that of Birc5. Based on [36,37,38]. According to this pathway lower level ofFRMD6might be associated with higher level of Birc5, as was found in the lung of the animal model of asthma.
doi:10.1371/journal.pone.0033573.g005