doi: 10.1093/cercor/bhw374 Original Article
O R I G I N A L A R T I C L E
Statistical Learning Signals in Macaque Inferior Temporal Cortex
Peter Kaposvari
1,2,†, Susheel Kumar
1,†and Rufin Vogels
11Laboratorium voor Neuro-en Psychofysiologie, Departement of Neurosciences, Campus Gasthuisberg, B 3000 Leuven, Belgium and2Department of Medical Physiology, University of Szeged, Dóm square 10, 6720 Szeged, Hungary
Address correspondence to Rufin Vogels, Laboratorium voor Neuro-en Psychofysiologie, Departement of Neurosciences, Campus Gasthuisberg, B 3000 Leuven, Belgium. Email: rufin.vogels@med.kuleuven.be
†These authors contributed equally to this work.
Abstract
Humans are sensitive to statistical regularities in their visual environment, but the nature of the underlying neural statistical learning signals still remains to be clarified. As in human behavioral and neuroimaging studies of statistical learning, we exposed rhesus monkeys to a continuous stream of images, presented without interstimulus interval or reward association. The stimulus set consisted of 3 groups of 5 images each (quintets). The stimulus order within each quintet was fixed, but the quintets were presented repeatedly in a random order without interruption. Thus, only transitional
probabilities defined quintets of images. Postexposure recordings in inferior temporal (IT) cortex showed an enhanced response to stimuli that violated the exposed sequence. This enhancement was found only for stimuli that were not predicted by the just preceding stimulus, reflecting a temporally adjacent stimulus relationship, and was sensitive to stimulus order. By comparing IT responses with sequences with and without statistical regularities, we observed a short latency, transient response suppression for stimuli of the sequence with regularities, in addition to a later sustained response enhancement to stimuli that violated the sequence with regularities. Thesefindings constrain models of mechanisms underlying neural responses in predictable temporal sequences, such as predictive coding.
Key words:inferior temporal cortex, macaques, predictions, statistical learning, temporal regularities
Introduction
Animals are sensitive to spatial and temporal regularities in their sensory environment. These regularities correspond to properties of the environment that repeat, for example, for primates the configuration of features that constitute a face or the sequence of buildings encountered when driving home along a familiar road. Behavioral studies have shown that some of these regularities can be learned (for reviews see Krogh et al. 2012;Turk-Browne 2012;Dehaene et al. 2015). For instance in the visual domain, mere exposure to a set of scenes or sequences of visual stimuli is sufficient to learn their embedded regularities (Fiser and Aslin 2001,2002;Turk- Browne 2012). Such extraction of statistical regularities is
often referred to as“statistical learning”(Saffran et al 1996;
Turk-Browne 2012).
In the present study, we examined the learning of temporal statistical regularities in macaque inferior temporal (IT) cortex. IT represents complex object features (Tanaka 1996) and previous studies have shown that the object selectivity of adult macaque IT neurons can be altered by visual experience or by visual discrimin- ation training (Miyashita et al. 1993;Kobatake and Tanaka 1994;
Baker et al. 2002;Freedman et al. 2006;Op de Beeck et al. 2007;
Li and DiCarlo 2008,2010). For instance, extensive passive exposure to a set of images of objects decreases the response of the popula- tion of IT neurons whereas the selectivity for the familiar images increases (Freedman et al. 2006; Woloszyn and Sheinberg 2012).
© The Author 2016. Published by Oxford University Press. All rights reserved. For Permissions, please e-mail: journals.permissions@oup.com
Given this plasticity of the object selectivity of IT neurons, it is natural to ask whether their responses also reflect temporal regularities in object sequences.
In studies of visual statistical learning of temporal regular- ities, subjects are exposed to multiple short sequences, each consisting of stimuli that are always presented in the same fixed order. The short sequences themselves are presented in a random order without interruption.Turk-Browne et al. (2009) found that functional magnetic resonance imaging (fMRI) blood oxygen level-dependent (BOLD) activations in the human lat- eral occipital complex (LOC) were greater for learned fixed sequences than for sequences of randomly ordered stimuli with equal familiarity, suggesting a statistical learning signal in human LOC, a possible homolog of macaque IT (Denys et al.
2004). Recent single unit studies in macaque IT argued instead for a decreased response to predictable stimulus members of familiar doublets (Meyer and Olson 2011;Ramachandran et al.
2016) or triplets (Meyer et al. 2014). Unlike in classical statistical learning studies, the short sequences in these macaque studies were each followed by a reward and clearly demarcated in time with an intersequence break during the familiarization phase.
This may not only have enhanced sequence learning in the monkeys but also altered the underlying mechanisms (e.g., the animals might have employed the stimuli to predict the upcoming juice reward). Furthermore, the apparent suppressed responses to the learned sequences observed in the Meyer et al. IT studies (Meyer and Olson 2011; Meyer et al. 2014;
Ramachandran et al. 2016) contradicted the stronger neural responses to predicted compared with deviant or randomly ordered stimuli reported in mice visual cortex (Gavornik and Bear 2014).
At present, the reason(s) for these discrepancies between the different studies is unclear, in particular because different stimulation protocols were employed in different species. To resolve this, we employed in the present study a classical statis- tical learning paradigm, similar to the one employed byTurk- Browne et al. (2009), to examine visual statistical learning in macaque IT. Unlike in the previous studies in macaque IT, we exposed monkeys to an uninterrupted, continuous stream of visual stimuli and reward delivery was independent of the stimulus sequence or stimulus identity. The stream consisted of 3 short sequences of 5 different stimuli each. During exposure, the stimulus order wasfixed within each quintet: for example, stimuli A, B, C, D, and E of a quintet were shown always in the same order“ABCDE”but never in a different order (e.g., ACDBE).
Importantly, the 3 quintets were presented, uninterrupted, in a random order (e.g., ABCDEKLMNOFGHIJKLMNOABCDE….) and the 3 quintets were presented with equal probability.
In the present study, we performed 2 experiments to exam- ine whether and how IT neurons were sensitive to the statistical regularities embedded in the continuous stream of equally familiar stimuli. In thefirst experiment, we tested the responses of IT neurons for violations of the exposed quintets. To do so, we compared the spiking activity between the same stimuli pre- sented at the exposed order within the quintet (e.g., to“D”in ABCDE) and when presented at a“deviant”location within one of the other two quintets (e.g., to “D” in KLMDO). We asked whether the exposure produced different responses for the devi- ant stimulus compared with the same stimulus presented at its correct position in the exposed quintet. Such a differential response would indicate a statistical learning signal in IT. This differential response could be an enhanced response to the
deviant stimulus, as seen in previous studies of sequence learn- ing in macaque IT (Meyer and Olson 2011; Meyer et al. 2014;
Ramachandran et al. 2016), or instead a suppressed response to the deviant stimulus, as seen in rodent visual cortex (Gavornik and Bear 2014) and suggested by the human fMRI study by Turk-Browne et al. (2009).
In addition, we examined to what aspects of the statistical structure embedded in the continuous sequences IT neurons were sensitive. Thus, we asked whether the learning signal in IT depended only on the immediate preceding stimulus or instead reflected a larger part of the quintet. This was tested by replacing 2 successive stimuli of a quintet by 2 successive stim- uli of another quintet (e.g., LM of the quintet KLMNO replaced CD of ABCDE, yielding ABLME). If monkey IT statistical learning signals are restricted to temporally adjacent stimuli then one would expect that there would be no change in the response to the deviant that follows thefirst deviant of a pair in the correct position (i.e., response to M in ABLME and in KLMNO), although the deviant pair is inserted in the wrong quintet. Furthermore, the response to a stimulus at the correct position that follows a single deviant, for example, response to“O”in KLMDO, should show a change in its response when the learning effect in IT is determined by the preceding stimulus since O never followed D during the exposure, although O is at its correct position in the quintet (KLMNO). No change in response to the stimulus follow- ing the deviant, combined with a differential response to the deviant, would indicate learning of nonadjacent dependencies.
Another aspect we examined is the possible cumulative effect of the number of preceding stimuli within a quintet: one may expect a greater differential response to the deviant when it occurs at a later position in the quintet (e.g. greater response to deviant H in ABHDE vs. H in ABCDH). Such dependency of the differential response to a deviant on its position within the quintet would be expected when the response to a stimulus depends on more than one preceding stimulus of a quintet.
Next we asked whether IT neurons were sensitive to the tem- poral order of the stimuli within a quintet or were coding merely joint statistics. To answer this, we manipulated the position of a stimulus within a quintet, by replacing a stimulus of a quintet by another stimulus of the same quintet (e.g. comparing the response to thefirst E presentation in ABEDE with that in ABCDE).
For both the across-quintet and within-quintet stimulus replace- ments, we controlled for mere repetition effects, since repetition, even with intervening stimuli, is known to influence the response of IT neurons (Miller et al. 1991;Sawamura et al. 2006;McMahon and Olson 2007;Kaliukhovich and Vogels 2014).
In thefirst experiment, we observed an enhanced activity for thefirst deviant of a stimulus pair that was inserted at the wrong position in a quintet, compared with the same stimulus presented at the correct position within a quintet. Then we asked in a second experiment whether this enhanced response reflects 1) a response increase to the deviant stimulus relative to the response to a stimulus in a random sequence or 2) a decrease of the response to a predicted stimulus and without an enhanced response to the deviant with respect to a stimulus in a random sequence. In other words, is there a surprise-like, enhanced response to the deviant stimulus and/or expectation suppression (Todorovic and de Lange 2012;Summerfield and de Lange 2014). Note that thus far, no evidence for surprise-related responses has been obtained in macaque IT (Kaliukhovich and Vogels 2014). We answered this question by comparing the spiking activity between stimuli of the exposed quintets and
equally familiar unpredictable stimuli that were presented in a random order during the exposure phase, and by comparing the activity to deviant stimuli and random sequence stimuli.
Materials and Methods
Subjects and Recording Locations
Data were collected from 2 male rhesus monkeys (H and O;
Macaca mulatta). All animal care and experimental protocols complied with national and European guidelines and were approved by the KU Leuven Ethical Committee for animal experiments. Both monkeys had an MRI compatible plastic headpost and recording chamberfixed to the skull with acrylic cement and ceramic screws. The recording positions were esti- mated by an MRI scan obtained before the recording sessions.
Multi-unit activity (MUA) recordings were made from the ven- tral bank of the rostral Superior Temporal Sulcus (STS) of the right hemisphere. The estimated recording locations of monkey H ranged between 14 and 18 mm anterior to the ear canal and between 20 and 25 mm lateral to the midline. For monkey O, the anterior/posterior coordinates of the recording locations ranged from 15 to 19 mm and the medial/lateral coordinates ranged from 23 to 26 mm.
Apparatus
MUA recordings were performed with epoxylite-insulated tung- sten microelectrodes (impedance ranging between 0.4 and 1.8 MΩ). In each daily session, a single electrode was lowered with a Narishige microdrive into the brain using a stainless steel guide tube. Spikes were thresholded online using a cus- tom amplitude discriminator. No effort was made to isolate single units from the thresholded MUA since in the present study we were interested in the effects that occur at the popu- lation level. By pooling the activity of multiple neurons, MUA has the advantage of reducing stimulus specific effects, which is an advantage when comparing responses across different stimuli as was done here in some of the analyses.
The position of one eye was continuously tracked by means of an infrared video-based tracking system (SR Research EyeLink; sampling rate 1 KHz). Gamma corrected stimuli were displayed on a 20-inch CRT display (Panasonic Panasync/
ProP110i; 1024 × 768 screen resolution; 75 Hz vertical refresh rate) at a distance of 57 cm from the monkey’s eyes.
Fixation Task
The animals were required tofixate within a 2 degree square fixation window, centered around a small fixation target, in order to obtain a juice reward. Juice rewards were given with decreasing intervals as long as the monkeys maintained fix- ation, encouraging longfixation. Importantly, the timing of the juice delivery and the presentation of the stimulus sequences were uncorrelated. A red square (0.13 degree) served asfixation target and was located at the center of the display, superim- posed on the center of mass of the stimuli.
Stimuli and Paradigms
The stimuli consisted of modified Snodgrass and Vanderwart images of animals and objects (Fig.1B), taken from theRossion and Pourtois (2004) database. The stimuli were presented on a gray background.
Experiment 1
The 15 stimuli were grayscale images of vertebrate animals, all with their head oriented to the left (Fig.1B). We resized the images so that their maximal horizontal or vertical extent was 6 degrees and equated their mean luminance. The 15 images were sorted twice into groups of 3 quintets. For each of the 2 groups of 3 quintets, we selected quintets so that the area, maximum vertical extent, maximum horizontal extent, aspect ratio and standard deviation of the pixel graylevels of the images did not differ significantly among the 3 quintets of the group and we maximized the overlap of these values (one-way ANOVA,P>0.5). One of the two groups served as stimuli for one monkey and the other group for the other monkey. To select the order of the stimuli within a quintet, we computed pixel-based pairwise Euclidean distances between the grayle- vels of the images for all possible permutations of the 5 images of a quintet (“within-quintet distances”). In addition, we com- puted the Euclidean distance between the last image of a quin- tet and thefirst image of the same or another quintet and this for all 9 possible combinations of the 3 quintets (“between- quintet distances”). The selected order of the stimuli within a quintet was chosen to have strongly overlapping within- and between-quintet distances. Also, the within-quintet distances were on average (across the 3 quintets) highly similar for the 4 successive doublets of a quintet. Thus, we equated as much as possible low-level image differences between successive pre- sentations within and across quintets.
During the exposure phase of the experiment, the selected 3 quintets, which we will label“standard quintets,”were shown in a random order, but with a fixed stimulus order within a quintet. An individual image was shown for 293 ms and was immediately succeeded by the next image, without any inter- stimulus or interquintet interval (Fig. 1A). Unlike in other experiments, the stimulus presentation continued even when the animal abortedfixation.
The exposure phase lasted for 60 and 28 daily sessions, of approximately 2 h each, for monkeys H and O, respectively.
After the exposure phase, we performed 2 sets of manipula- tions in which the order of the stimuli within the sequences was violated. In thefirst set of manipulations of experiment 1, one or two successive images of a quintet (the“source quintet”) were inserted into another quintet by replacement (Fig.1C). We will label the inserted images“deviants”and the quintets with deviants “target quintets” (see second and third rows of Fig.1C). For thefirst 84 MUA sites, the deviants were any of the 5 images of a source quintet but could replace only the third, fourth, orfifth image of the target quintet. For the next 44 MUA sites, we excluded thefirst image of a source quintet as pos- sible deviant. The deviants consisted of either a pair of stimuli (“deviant pair”) or a single stimulus (“single deviant”) from another source quintet. We will label the first stimulus of a deviant pair as“first deviant”and the second stimulus of the pair as“follower deviant”(Fig.1C). Note that the follower devi- ant (e.g. D in KLMCD with CD being the deviant pair) is identical to the image that follows thefirst deviant image in its source quintet (ABCDE). By having deviant pairs, we could assess whether statistical learning signals are restricted to temporally adjacent stimuli. If this was the case, then one would expect that there would be no change in the response to the follower deviant since it follows thefirst deviant of a pair at the same position as in the exposed sequence. Single deviants are by def- inition all “first deviants.”The stimulus that follows a single deviant will be labeled“follower standard”(Fig.1C). In order to have a sufficiently large number of presentations for both
single and deviant pairs, different MUA sites were tested with either deviant pairs or single deviants in a random manner.
During the recordings, target quintets with deviants were pre- sented at random in 25% of all the quintet presentations, with the restriction that at least one standard quintet should be pre- sented in-between 2 target quintets. Tests with deviants were performed during 57 and 36 daily recording sessions in mon- keys H and O, respectively.
After manipulation 1 of experiment 1, we exposed again mon- keys H and O to standard sequences without deviants in 12 daily
sessions, followed by the second manipulation. After this expos- ure, in the second set of manipulations, we replaced stimuli from the same quintet (“within-quintet”foils). All stimuli of a particu- lar quintet could replace any of the other images at positions 2–5 of that quintet. To reduce repetition suppression effects, we allowed no immediate repetitions of images (e.g., ABCCE). We distinguished 2 sorts of within-quintet foils: 1) foils that repeated a stimulus of the same quintet (e.g., “B” in quintet “ABCBE”), which we label“repetition foils”and 2) foils that were not a repe- tition of a stimulus within the quintet (e.g., “D” in “ADCDE”), Figure 1.Experimental design. (A) Stimuli were presented in a continuous sequence, trailing each other, without an interstimulus time interval. The exposure dur- ation of a single stimulus was 293 ms. Thefigure does not show thefixation target. (B) The top panel shows the 15 stimuli (all animals) of experiment 1 ordered in the 3 quintets (rows) presented to monkey H. The assignment of the same stimuli into the 3 quintets differed for the other monkey. During exposure, the 3 quintets were presented in a random order, but the stimulus order within a quintet wasfixed. The bottom panel shows the stimuli of experiment 2. The 30 stimuli were sorted in 2 groups of 15 each as indicated by the stippled line. One group of stimuli was presented in quintets (rows) as in experiment 1, while the stimuli of the other group were presented in a random order. The upper 3 rows show the quintets employed for monkey H, while the bottom 3 rows were the quintets for monkey O. Stimuli of the lower 3 and upper 3 rows were presented in the random sequence in monkeys H and O, respectively, thus counterbalancing the 2 groups across the 2 animals.
(C) Top: example of deviants from different quintets (DDQ). Illustration of a source quintet (first row), a target quintet containing a single deviant (second row) and a target quintet contained a deviant pair (third row). Thefirst deviant (d; red shaded box) and the follower standard (fs; green box) are indicated in the single deviant target quintet. The follower standard is identical to the stimulus presented at that position in the standard quintet to which the monkey was exposed (see stimulus at position 4 at row 2 inB). Thefirst deviant (d) and the follower deviant (fd) are indicated in the deviant pair target quintet in a shaded box. Bottom: example of foils from the same quintet (FSQ). The fourth andfifth rows show an example of a target quintet with a nonrepetition foil (nrf) and a repetition foil (rf), respectively. The foils are indicated by a red shaded box. (D) Summary, in chronological order, of the different exposure (left) and testing (right) phases. Experiment 1: during the expos- ure phase, only standard quintets (SQs) were presented. The testing phase consisted of 2 parts. First, target quintets containing deviants (DDQ) were randomly inter- leaved with standard quintets in continuous sequences (see Materials and Methods). Second, target quintets containing a foil (FSQ) were randomly interleaved with standard quintets (see arrow). In this second part, we performed also daily sessions with sequences having deviants and the latter were interleaved with daily ses- sions consisting of the sequences containing foils. Experiment 2: the monkeys were exposed to blocks containing standard quintets or random sequences (RS) of stimuli. The testing phase of experiment 2 consisted of 2 parts. First, alternating blocks of standard and random sequences. Second, we presented sequences contain- ing standard quintets and target quintets with only single deviant DDQs, and these were alternated with random sequences. The number of sessions for the exposure phases and testing phase parts is indicated. Thefirst and second number (within brackets) shows the number of sessions for monkeys H and O, respectively.
labeled as“nonrepetition foils”(Fig.1C). The reason for separat- ing the 2 sorts of foils is that pooling foils, irrespective of rep- etition, may underestimate a response enhancement to the repetition foil because of counteracting repetition suppression in the case of the repetition foils. Quintets with foils were presented at random in 25% of all the quintet presentations, with the restriction that at least one standard quintet should be presented in-between 2 target quintets. Tests with foils were performed during 26 and 30 daily recording sessions in monkeys H and O, respectively. In-between within-quintet foil recording sessions, we also performed daily sessions in which we presented across- quintet deviants.
For both across- and within-quintet manipulations, we pre- sented target quintets only during the measurement of the MUA to these sequences, after isolating a responsive MUA site.
During the recordings, each deviant or foil stimulus was pre- sented 120 times, yielding an approximate recording duration of 36 min per site. In-between these MUA recordings and while searching for responsive MUA sites, the monkeys were exposed to the standard sequences using the same procedure as during the exposure phase. On purpose, we limited the number of pre- sentations of the deviants or foils, thus reducing unlearning of the sequences. We searched for responsive neurons by present- ing the standard sequence. MUA sites that were judged to be responsive to at least one standard sequence stimulus (based on online peristimulus time histograms) were tested further with a sequence that included deviants or foils.
Experiment 2
The stimuli of experiment 2 consisted of 2 groups of 15 stimuli each, all different from those of experiment 1 (Fig. 1B). Each group consisted of a mixture of animals and objects. One group of 15 images consisted of 3 standard quintets with afixed order of stimuli, designed using the same procedure as in experiment 1.
These 3 standard quintets were presented in a random order, using the same protocol as in experiment 1, defining“standard sequences.”The other group of stimuli consisted of 15 other animals and objects and these were presented in a pseudoran- dom order. These sequences will be labeled as“random.”We required that the number of stimuli in-between presentations of the same stimulus should be at least 4. This ensured that on average the number of intervening stimuli between repetitions of the same stimulus was equal for both the standard and ran- dom sequences. The stimulus groups presented in standard or random sequences were counterbalanced across the 2 animals.
We exposed the animals to both types of sequences using a block design. Each block consisted of 4050 stimuli (270 presen- tations per stimulus), lasting approximately 20 min, and stand- ard and random sequence blocks were alternated in daily sessions of approximately 2 h. The sequence type of thefirst block of a daily session was randomized across sessions. We kept track of the number of presentations per sequence type and when necessary increased temporally the number of pre- sentations for a particular type in order to equate the number of presentations per sequence type. Thus, we ensured that the stimuli of the standard quintets and random sequences had equal familiarity. The exposure phase in experiment 2 lasted 34 and 35 daily sessions in monkeys H and O, respectively. The exposure phase of experiment 2 started 2 and 48 days after the end of the recording sessions of experiment 1 in monkeys H and O, respectively.
After the exposure phase, we recorded MUA for blocks of standard and random sequences. We searched for responsive
MUA using either the standard quintets or random sequences, alternating between sites. This avoided biasing responses toward one or the other sequence type. We tested each respon- sive MUA site with 2 blocks of each sequence type, that is, 4 blocks in total, and the 2 types alternated. The sequence type of thefirst block was randomized across sites. Each block con- tained 70 presentations per stimulus and lasted approximately 5 min, yielding a total test time of 21 min per MUA site. We kept track of the number of presentations per sequence, in par- ticular during the search periods in which a single sequence type was presented, and when necessary compensated by pre- senting the less frequent stimuli more in later sessions, e.g. at the end of recording or during the next days. We performed 16 and 17 such daily recording sessions in monkeys H and O, respectively.
After comparing the MUA for standard and random sequences, we introduced quintets with deviants, starting in the next recording session. The deviants in a target quintet ori- ginated from the 2 other quintets (Fig.1C) and replaced stimuli of the third, fourth, andfifth positions of the target quintet. As in experiment 1, only 25% of the quintets contained a deviant but only single deviants were presented. The presentation of the target quintets followed the same protocol as in experiment 1.
As before, responsive MUA was searched using either standard quintets (without deviant) or random sequences and this was done with an equal frequency. When testing the MUA sites, we alternated blocks of standard and target quintets and blocks of random sequences. Because of the inclusion of deviants, we increased the duration of the blocks containing both standard and target quintets by presenting each stimulus 480 times per block, of which 25% were target quintets. The number of pre- sentations per stimulus was 140 for the random block. We equated the presentation frequency of stimuli of the random and standard quintets by increasing the duration of the ran- dom sequences in sessions that occurred in-between the recording sessions. MUA to both types of sequences was mea- sured in 17 and 19 daily recording sessions in monkeys H and O, respectively.
Figure 1Dsummarizes in chronological order the different exposure and test phases, including the number of sessions for each phase per monkey.
Data Analysis
All statistical analyses were performed with nonparametric or permutation tests, except noted otherwise. For all analyses, we included only those presentations during which the monkey wasfixating thefixation target. Also, thefixation duration was restricted to be at least 2344 ms and data of the last 250 ms of a fixation period were removed to avoid effects of saccade prep- aration. We included for further analysis only those MUA sites that showed a statistically significant response to the sequences presented without deviants. This testing was performed for the presentations of quintets that were presented in full during a fixation period. We employed a permutation test of the var- iances of the mean responses computed across the 15 stimuli of a neuron, following a similar procedure as adopted byDe Baene et al. (2007). To do so, we binned the responses of each stimulus presentation in 75 ms long bins and then we concatenated the bins for the 15 stimuli of a sequence for a single presentation of the stimuli. This was repeated for each of the minimum number of presentations, computed across the different stimuli of the sequence. Then we computed the variance of the mean responses, averaged across presentations, in the different bins.
This variance metric, which reflects the modulation of the binned response by the stimulus sequence, was then compared with the null distribution of the variances expected when there was no relationship between stimulus and binned responses.
The latter variance was computed after permuting the order of the bins separately per presentation number. The null distribu- tion was obtained by computing 1000 such variances on per- muted data. If the variance of the observed binned responses was larger than the 95th percentile of the null distribution, the MUA of the site was considered to be significantly modulated by the stimuli. Following the permutation test, 87% of the MUA sites recorded in experiment 1 of monkey H were accepted, while all recorded MUA sites of both experiments in monkey O and all MUA sites recorded in experiment 2 of monkey H were accepted for further analysis.
We computed firing rates per stimulus presentation using an analysis window of 280 ms that started 100 ms after stimu- lus onset (to account for the response latency we observed in our neuronal sample) and that ended 87 ms after stimulus off- set (to reduce contamination of the response by the following stimulus). Thefiring rates were averaged across presentations of the same stimulus. When comparing responses to deviants or foils with presentations of the same stimuli in their correct position (“standard element”) for an MUA site, we equated the number of the 2 sorts of presentations by randomly sampling the same number of standard element presentations as the available number of deviant/foil stimuli of that MUA site.
Responses to deviants, foils, and corresponding standard ele- ments were only considered when these were preceded by at least 5 images and succeeded by at least 2 images during afix- ation period. Also, stimuli presented as thefirst stimulus of a quintet were excluded, except when otherwise noted, because these followed another stimulus with a transitional probability of only 1/3. To analyze the time course of the responses, we computedfiring rates in nonoverlapping 20 ms long bins. We tested whether there was a significant difference between 2 stimulus conditions (e.g. deviant vs. standard element) with a 2-sided Wilcoxon matched pairs test for each bin between 100 and 380 ms after stimulus onset. ThePvalues were corrected for multiple comparisons using theBenjamini and Hochberg (1995) False Discovery Rate method (q<0.05 was considered as statistically significant). In all analyses, wefirst averaged across stimuli tested for a site and this average provided the data point for a site. In other words, the number of observa- tions in the statistical tests corresponded to the number of MUA sites.
To compare the firing rates between the first deviant and standard element presentations as a function of the effective- ness of that stimulus in driving the MUA, we randomly split the presentations of a stimulus into 2 halves. This was done after equating the number of presentations for the deviant and stand- ard element conditions. Then, using the mean responses to the standard element in one half of the presentations, we selected 3 stimuli for each MUA site: one with the lowest meanfiring rate (w in Fig.3), one with the medianfiring rate (m in Fig.3) and one with the highestfiring rate (b in Fig.3). The other half of the pre- sentations of the standard elements were employed to compute the responses to the standard element, which were compared with the responses to the same stimuli presented asfirst devi- ants in half of their presentations. This procedure ensured that the responses that were employed to compute the stimulus pref- erence of the MUA site were independent from the responses that entered the comparison of standard element and deviant stimulus presentations as a function of the stimulus preference
(plotted in Fig.3), avoiding biasing the stimulus selectivity for a particular stimulus condition.
All analyses were performed for both rawfiring rates andfir- ing rates that were normalized for each neuron separately. The normalization was performed by subtracting the mean firing rate, averaged across conditions (standard and deviant or foil presentations), from thefiring rate of a stimulus and dividing that difference by the meanfiring rate. Thefigures display the unnormalized data. Since all reported effects were also present for normalized spike counts, we are assured that the effects were not driven by outlier sites with highfiring rates.
Results
Experiment 1
In the first experiment, we exposed 2 monkeys for several weeks to a continuous stream of visual images (Fig.1A,B). The 15 visual images were grouped into 3 groups of standard quin- tets, and the stimulus order wasfixed within each quintet. The 3 standard quintets were shown in a random order, without any interruption. After the exposure phase, we tested whether anterior IT neurons carry a signal that reflects the temporal regularities of the stimulus sequence by inserting in 25% of the quintet presentations 1 or 2 successive stimuli (“deviants”) that belonged to the other quintets or by inserting a stimulus (“foil”) from the same quintet at the “wrong” position within that quintet. The responses to the deviants or foils were compared with the responses to the same stimuli (“standard elements”) presented at their correct position in the standard quintets.
Deviants from Different Quintets
The deviant stimuli consisted of either a pair of stimuli (“devi- ant pair”:first deviant and follower deviant), that is, 2 succes- sive stimuli from another source quintet, or a single stimulus (“single deviant”: first deviant) from another source quintet (Fig.1C). In afirst analysis, we determined whether there is a difference in the response to a single deviant and its corre- sponding standard element. To do this, we pooled the MUA sites tested with deviant pairs and single deviants and ana- lyzed for the MUA sites tested with deviant pairs the response to thefirst deviant. We found that the average MUA to thefirst deviants was significantly greater than to the physically identi- cal stimuli presented as a standard elements (P=1.62×10⁻¹³, n =128 sites; Wilcoxon matched pairs test; Fig.2A) and this response enhancement was present in each animal (monkey H:
P=2.92×10⁻⁷,n=62, Supplementary Fig. 1A; monkey O:P= 1.10×10⁻⁷,n=66, Supplementary Fig. 1B).
To determine whether the response enhancement for the first deviant depended on how well that stimulus was driving the neurons, we selected from the stimuli that were presented asfirst deviants those that elicited the worst, median and best response when presented as a standard, using an unbiased stimulus selection procedure (see Materials and Methods). We performed this analysis for all the MUA sites with at least 6 pre- sentations of each first deviant stimulus (105 sites). The response enhancement for the deviant was present for each stimulus, irrespective of its effectiveness in driving the MUA (Fig. 3). This additive effect of thefirst deviant stimulus was confirmed by a repeated measures ANOVA with factors 1) devi- ant versus standard and 2) stimulus rank that showed a signifi- cant main effect of both factors (main effect of deviant/
standard:F1,104=27.2;P=1.0×10⁻⁶; main effect of stimulus rank: F1.2,128.5 = 55.7; P = 2.21 × 10⁻¹³; Greenhouse-Geisser
sphericity violation correction), but no significant interaction (F1.6,171.5=0.03;P=0.95; Greenhouse-Geisser sphericity viola- tion correction). Similar results were obtained when normaliz- ing for each site by dividing the MUA by the maximum response of the 6 conditions.
Next, we examined what aspects of the statistical structure of the sequences IT neurons were sensitive to. First, we exam- ined whether only the preceding stimulus influences the response to a stimulus, that is, whether IT is sensitive only to temporal adjacent stimulus relations. The single deviants were followed by a standard stimulus (“follower standard”) in the target quintet, except when the deviant stimulus was located at thefifth position of the target quintet. The follower standard stimulus occupies the same position within the target quintet as the corresponding standard element would occupy in the standard quintet. However, in the standard quintets, the corre- sponding standard element to the follower standard stimulus never follows the deviant stimulus. Hence, when the IT responses are sensitive to adjacent stimuli, that is pair-based, and do not take into account preceding nonadjacent stimulus associations in a quintet, one would expect a response enhancement also for the follower standard (e.g., response enhancement to N in KLHNO compared with N in KLMNO).
Indeed, we found that the response to a follower standard was enhanced with respect to the response to the same stimulus when presented in a standard quintet without a deviant (“standard element”;P=9.42×10⁻⁹;n=65; Wilcoxon matched pairs test; Fig.2B). This response enhancement for the follower standard was present in each monkey (monkey H:P=2.21× 10⁻⁵,n=35, Supplementary Fig. 1C; monkey O:P=8.19×10⁻⁵,
n=30, Supplementary Fig. 1D) and similar in magnitude and time course to the response enhancement observed for thefirst deviant (compare Fig. 2A,B). Furthermore, when the learning signal in IT is pair-based, one would expect also no enhance- ment to the follower deviant of a deviant pair (e.g. comparing response to M in ABLME and KLMNO), since the former stimu- lus is at the correct position given thefirst deviant. In agree- ment with this prediction, we found that the mean response to the follower deviant of a deviant pair did not differ significantly from that to the corresponding standard element (P=0.19;n=63;
Wilcoxon matched pairs test; Fig.2C). This absence of response enhancement for the follower deviant (Fig.2C) together with the presence of response enhancement for a follower standard (Fig.2B) strongly suggests that the statistical learning signal in IT represents learned pairs.
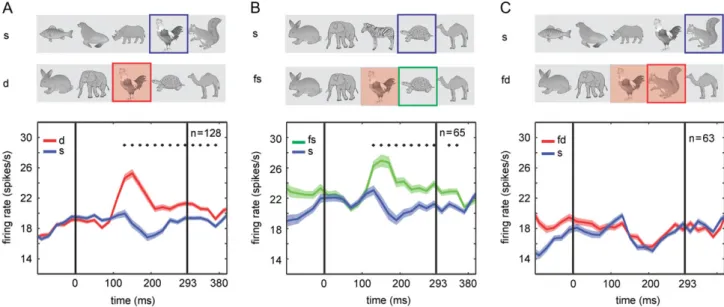
If the statistical learning signal represents mainly learned pairs, then one would not expect an effect of the position of the first deviant in the target quintet on the response to that devi- ant (e.g. response to deviant H in ABHDE vs. H in ABCDH). Only the preceding stimulus would matter, not its global position in the quintet. To examine this, we computed for each MUA site the response to thefirst deviant and corresponding standard element for each of the 3 positions (3, 4, and 5, e.g., response to deviant H in ABHDE, ABCHE, and ABCDH) of thefirst deviant in the target quintet. Statistical analysis showed no effect of pos- ition in the target quintet on the response to thefirst deviant (P = 0.94; n = 65; Friedman ANOVA), nor on the difference between the responses to thefirst deviant and the standard element (P= 0.56;n=65; Friedman ANOVA; see Supplementary Fig. 2B). Note that at each position the difference between the Figure 2.Mean spiking activity for afirst deviant, for a follower standard and a follower deviant compared with the activity for corresponding standard elements. The deviants originated from another quintet (across-quintet deviants). (A) Top: illustration of a source quintet and a target quintet containing afirst deviant. The stimuli for which the responses are compared are indicated by a colored square, with the blue and red indicating the standard element (s) andfirst deviant (d) stimulus, respectively. The shaded square indicates a deviant. Bottom: Firing rate averaged across both monkeys (n=128 MUA sites) for afirst deviant (red) and the standard element (blue). (B) Top: illustration of a source quintet and a target quintet containing afirst deviant. The stimuli for which the responses are compared are indicated by a colored square, with the blue and green indicating the standard element and a follower standard stimulus, respectively. The shaded square indicates the devi- ant. Bottom:firing rate averaged across both monkeys (n=65 MUA sites) for a follower standard (fs) (green) and the corresponding standard element (blue). (C) Top:
illustration of a source quintet and a target quintet containing 2 successive deviants. The stimuli of which the responses are compared are indicated by a colored square, with the blue and red indicating the standard element (s) and a follower deviant (fd), respectively. The shaded squares indicate the deviants. Bottom:firing rate averaged across both monkeys (n=63 MUA sites) for a follower deviant (fd; red) and the standard element (s; blue). In each data panel, the stars indicate signifi- cant differences between the 2 conditions (Wilcoxon matched pairs test; FDR correctedq<0.05), tested per 20 ms bin. Zero on the abscissa indicates stimulus onset and the vertical bars correspond to stimulus onset and offset. Shaded bands indicate standard error of the mean, computed following the procedure byLoftus and Masson (1994)which removes the variance due to the differences in the overall mean response across MUA sites. Data from experiment 1. See Supplementary Figure 1 for data of the individual monkeys.
response to thefirst deviant and the standard element was sig- nificant (Wilcoxon matched pairs test; FDR correctedq values
<2.93×10⁻⁶). Also, we examined whether the effect of thefirst deviant depended on the position of the corresponding standard element in the source quintet. To do this, we analyzed those MUA sites that hadfirst deviants from each of the 5 positions in the source quintet. Although there was a trend toward a smaller response enhancement when the standard element was at the first position of the source quintet, this failed to reach statistical significance (P=0.25;n=61; Friedman ANOVA). Also, there was no significant effect of the position in the source quintet on the difference between the responses for thefirst deviant and the corresponding standard element (P = 0.24; n = 61; Friedman ANOVA). Note that at each of the 5 positions the difference between response to the first deviant and the corresponding standard element was significant (Wilcoxon matched pairs test;
FDR correctedqvalues<4.1×10⁻⁴; see Supplementary Fig. 2A).
Finally, we examined whether stimulus repetition can explain the enhancement of the responses for thefirst deviant and the follower standard stimuli. Previous studies suggest that the number of intervening stimuli between repetitions of the same stimulus determines the strength of repetition suppres- sion in IT with stronger repetition suppression with a smaller number of intervening stimuli (McMahon and Olson 2007;
Kaliukhovich and Vogels 2014). The insertion of deviants in a sequence of stimuli caused differences between the
distributions of the number of stimuli that are presented between repetitions of the same stimulus of that sequence com- pared with the standard quintet sequence. We computed for the sequences that were presented to the animals, and contained target quintets, the number of intervening stimuli between the deviant and the preceding presentation of the same stimulus identity and between a corresponding standard element and its preceding presentation. Although the mean number of interven- ing stimuli was nearly identical for the standard elements (mean=13.9) and thefirst deviants (mean=14.3), the distribu- tions of the number of intervening stimuli differed between the 2 stimulus types (Supplementary Fig. 3A,B). To elaborate, 32% of the standard elements and 16% of thefirst deviants had stimuli in-between repetitions lesser than 5. However, the distributions of the number of intervening stimuli were highly similar between the standard elements and the follower standard stim- uli (Supplementary Fig. 3B,D), although the neural responses dif- fered markedly between these 2 stimulus conditions (Fig. 2B).
The same held for the distributions of the number of interven- ing stimuli and the responses for thefirst and follower deviant (see for distributions Supplementary Fig. 3A,C; see for neural responses Fig.2A,C). Hence, differences among the distributions of the number of intervening stimuli for the different stimulus conditions cannot explain the response enhancement present for thefirst deviant and the follower standard and the lack of enhancement for the follower deviant. In other words, the Figure 3.Responses to across-quintet deviants and the corresponding standard elements as a function of the response strength to the standard stimulus. Meanfiring rate (105 MUA sites of both monkeys) to the stimuli presented in a standard quintet (blue) and the same stimuli presented asfirst deviants (red). For each MUA site, the stimuli were sorted according to their response strength for the standard stimuli. w: stimulus with lowest response strength to the standard stimulus; m: stimu- lus with median response strength to the standard stimulus; b: stimulus with highest response strength to the standard stimulus. The 3 stimuli were selected for each neuron separately using responses for the other half of the presentations than for which we plotted the responses here (see Materials and Methods). Bars indi- cated standard errors of the mean, computed using the within-subject (=site) design method ofLoftus and Masson (1994), that is, after removal of across site mean activity differences. The 2 insets illustrate the population peri-stimulus time histograms for thefirst deviant (red) and standard element (blue) stimuli for the worst (upper left) and best (bottom right) response conditions. Zero indicates stimulus onset and the vertical line stimulus offset. Data from experiment 1.
response enhancement for thefirst deviant and follower stand- ard cannot be caused by repetition-related effects, such as repe- tition suppression. This is not unexpected given the broad and strongly overlapping distributions of the number of intervening stimuli for the different stimulus conditions.
Foils from the Same Quintet
For 82 MUA sites of both monkeys, we compared the response to a standard element with the response to the same stimulus when it replaced another stimulus of the same quintet (foils), thus changing its position within the quintet. We distinguished 2 sorts of foils: “repetition foils” and “nonrepetition foils.”
Unlike nonrepetition foils (e.g.,“D”in“ADCDE”), repetition foils repeat a stimulus of the same sequence (e.g., “B” in quintet
“ABCBE”). Because repetition suppression can occur for repeti- tion foils, which can counteract a response enhancement for the foil, the overall response enhancement may be underesti- mated for these foils.
We observed a significantly greater response for the nonrepeti- tion foils compared with the same stimuli presented as standard elements (P=1.21×10⁻⁴;n =82; Wilcoxon matched pairs test;
Fig.4A). This held true in each of the 2 animals (monkey H:P= 0.026,n=42; monkey O:P=2.7×10⁻⁴,n=40). A similar response enhancement was present for a follower standard stimulus that trailed a nonrepetition foil (P = 2.56 × 10⁻³; n = 82; Wilcoxon matched pairs test; Fig.4C) and a repetition foil (P=4.02×10⁻⁴; n=82; Wilcoxon matched pairs test; Fig.4D). Not unexpectedly because of the possibility of repetition suppression due to the small number of intervening stimuli for the repetition foils (mean=1.4 with 100% smaller than 4; Supplementary Fig. 4B), the response enhancement for the repetition foil failed to reach sig- nificance (P=0.065;n=82; Wilcoxon matched pairs test; Fig.4B).
Note that differences among the distributions of the number of intervening stimuli between repetitions (Supplementary Fig. 4) cannot explain the enhancement for the nonrepetition foil and the follower standard stimulus (Fig.4A,C). In fact, the distribution of the number of intervening stimuli for the nonrepetition foils contained relatively more instances of<4 intervening stimuli than the standard elements, which would predict relatively more repe- tition suppression (instead of an enhanced response) for the non- repetition foils. These effects are expected to be weak because of the broad and strongly overlapping distributions of the nonrepeti- tion foils (mean number of intervening stimuli=12.2) and stand- ard elements (13.8).
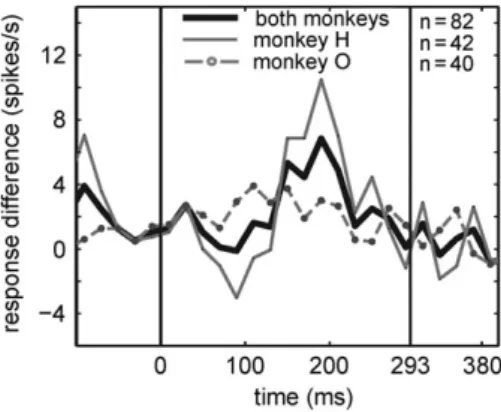
These analyses show that a stimulus that is presented at its incorrect position within its quintet produces an enhanced response. In addition, an enhancement is present for a cor- rectly positioned stimulus that follows the incorrectly posi- tioned stimulus. This suggests that the responses in IT may depend on the order of the stimuli, even for pairs of stimuli. To assess whether the order of the stimuli within a pair is critical, we tested whether a response enhancement is present when the order of the members of a manipulated stimulus pair is opposite to that in a standard quintet. For each standard quin- tet, we had 2 such cases: ABCDE versus ADCDE and ABCDEver- sus ABEDE, with the relevant pairs indicated in boldand the tested stimulus underlined. We found that for these pairs the mean response to the follower standard stimulus that trailed a nonrepetition foil (e.g., Cin ADCDE) was significantly greater than to the corresponding standard element (e.g.Cin ABCDE;
P=1.14×10⁻³;n=82; Wilcoxon matched pairs test; Fig. 5B), and this response enhancement was present in each animal (monkey H:P=0.03,n=42; monkey O:P=6.28×10⁻⁴,n=40).
This demonstrates that the statistical learning signal in IT reflects the order of adjacent stimuli.
Experiment 2
Next we asked whether the greater response for the deviant and foils compared with the standard stimuli corresponds to a suppressed response to the stimuli in standard quintets or an enhanced response to the deviant and foil stimuli, compared with the responses before statistical learning or with stimuli presented in sequences without any regularity. Thus, we exposed the 2 monkeys to 2 groups of 15 stimuli each (Fig.1B).
One group of stimuli consisted of 3 standard quintets, with the stimuli in each quintet having afixed order. The 3 standard quintets were presented in a random order without any inter- quintet interval as in experiment 1 (see Materials and Methods). The stimuli of the other group were presented in a random order (“random sequence”). Which group of stimuli was presented as standard quintets or in the random sequence differed between the 2 monkeys. The standard and random sequences were presented in alternating blocks for several weeks and we took care that the familiarity of the standard and random sequence stimuli was equated in each animal (see Materials and Methods).
Comparison of Standard and Random Sequence Responses
After exposing the monkeys to both standard and random sequences, we recorded MUA to both sequences in 119 sites.
We observed a significantly larger mean response to the stimuli of the random sequence compared with the stimuli in standard quintets (P = 0.042; n = 119; Wilcoxon matched pairs test;
Fig.6A). Although this response suppression for the standard quintet stimuli was similar in the population responses of the 2 animals, it was statistically significant only in monkey O when considering the 280-ms analysis window (P=1.72×10⁻³, n=61; monkey H:P=0.68,n=61; but in monkey H:P=0.037 in bin 100–120 ms after stimulus onset). Because we counterba- lanced the 2 groups of stimuli across animals, and since similar trends and time courses were observed in the 2 animals (Fig. 6C,E), it is highly unlikely that the response difference between the 2 sequences was due to differences between the stimuli of the 2 groups. To further address this, we boot- strapped stimuli (with replacement; 1000 bootstraps) and then recomputed the mean response across the resampled stimuli for each bootstrapped sample. We resampled separately the standard and random group stimuli and then we computed the response difference between the 2 stimulus groups per sample pair. For the raw responses, a 0 response difference corre- sponded to the 1.9thpercentile percentile of the distribution of the 1000 bootstrapped response differences while for the nor- malized responses it corresponded to the 1.5thpercentile per- centile, both percentiles below 5 (type 1 error = 0.05). This analysis strongly suggests that the smaller response for the standard compared with the random sequence is not due to stimulus differences.
We took care that the standard and random sequences showed on average a nominally identical number of intervening stimuli between repeated stimuli (means of 13.8 and 13.9 for the standard and random sequences, respectively; Supplementary Fig. 5). The smallest number of intervening stimuli between repeated stimuli was 4 by (deliberate) design (see Materials and Methods) in both sequences. The random sequences contained 9% of such repeti- tions with 4 intervening stimuli compared with 33% in the stand- ard sequence which might have caused stronger repetition
suppression in the standard compared with the random sequence, which may explain the reduced neural response to the stimuli in the former sequences. To address this concern, we verifiedfirst whether repetition of stimuli causes repetition suppression in the standard and random sequences. Indeed, the mean response to a stimulus was lower when thefifth preceding stimulus was the same stimulus (e.g., BCDEAB) than when the fifth preceding
stimulus was different (e.g., GHIJAB; Supplementary Fig. 6). This repetition suppression with 4 intervening stimuli was present in the standard (P=6.88×10⁻⁵;n=119; Wilcoxon matched pairs test;
tested using the 280-ms long analysis window; Supplementary Fig. 6A) and random sequences (P =0.002; n = 119; Wilcoxon matched pairs test; Supplementary Fig. 6B). However, the size of the repetition suppression (2 spikes/s at response peak) was Figure 4.Mean spiking activity for a within-quintet foil and for a follower standard compared with the activity for the corresponding standard elements. (A) Top: illus- tration of a standard quintet (s) and a target quintet containing a nonrepetition foil (nrf). The stimuli for which the responses are compared are indicated by a colored square, with the blue and red indicating the standard element and the nonrepetition foil, respectively. The shaded square indicates a foil. Bottom: Firing rate aver- aged across both monkeys (n=82 MUA sites) for a nonrepetition foil (red) and the corresponding standard element (blue). (B) The same as for (A), expect that only responses to repetition foils (rf) were considered (n=82 MUA sites). (C) Top: illustration of a standard quintet and a target quintet containing a nonrepetition foil. The stimuli for which the responses are compared are indicated by a colored square, with the blue and green indicating the standard element and the follower standard stimulus, respectively. The shaded square indicates the foil. Bottom:firing rate averaged across both monkeys (n=82 MUA sites) for a follower standard stimulus (green) and the corresponding standard elements (blue). Only responses to a follower standard of nonrepetition foils and responses to their corresponding standard elements are plotted. (D) The same as for (C), expect that responses to follower standard stimuli of repetition foils were considered (n=82 MUA sites). Same conven- tions as in Figure2. Shaded bands indicate standard error of the mean, computed following the procedure byLoftus and Masson (1994), which removes the variance due to the differences in the overall mean response across MUA sites. Data from experiment 1.
smaller compared with the difference between the random and standard sequences observed in the same neurons (6 spikes/s at response peak). The repetition suppression was not detectable for the standard (P =0.27; n = 119; Wilcoxon matched pairs test;
Supplementary Fig. 6C) and random sequences (P=0.71;n=119;
Wilcoxon matched pairs test; Supplementary Fig. 6D) when 9 inter- vening stimuli were present between repeated stimuli (note that the number of intervening stimuli for the standard sequence was 4, 9, 14, etc.). To ensure that the difference between the response to the random and standard sequences was not due to repetition suppression, we selected only stimulus presentations for which the number of intervening stimuli between the presentation and the previous presentation of the same stimulus was at least 9, abolishing any possible effect of repetition suppression. The results we obtained with this selected set of presentations were similar to those for all presentations, demonstrating a significantly higher response to the random compared with the standards sequence stimuli in each animal (Fig.6D,F), and when pooling the 2 animals (Fig.6B). Hence, the suppressed response to the standard sequence stimuli is not caused by repetition suppression.
Responses to Deviants from Different Quintets
Figure6suggests that the suppressed response for the standard quintet stimuli is present for a short duration, till 150 ms at most, whereas the enhanced response to thefirst deviants in experiment 1 (Fig.2) was more sustained. We pondered whether this striking difference between the time courses of the sup- pressed response for the standard quintet stimuli and the enhanced response to thefirst deviant could be due to uncon- trolled differences between experiment 1 and 2. To address this, we presented deviants in the quintet blocks (see Materials and Methods), similar to experiment 1, during MUA recordings in both monkeys (monkey O: 30 sites; monkey H: 32 sites). We replicated the enhanced response to thefirst deviant compared with its corresponding standard element (P=3.09×10⁻⁴;n=62;
Wilcoxon matched pairs test; Fig.7A). As in experiment 1, we also observed a significantly enhanced response for the follower standard (P=3.52×10⁻⁶;n=62; Wilcoxon matched pairs test;
Fig. 7C). Furthermore, as observed in experiment 1, the
enhanced response to thefirst deviant was present during the late part of the response, up to 360 ms after stimulus onset (Fig.7A). Figure7Aalso plots the responses to the stimuli of the random sequences for the 62 sites tested with deviants.
Although the mean response to the stimuli of the random sequence was higher than to the standard quintet stimuli, this difference failed to reach statistical significance (P=0.26), even when tested binwise. Furthermore, the mean response to the stimuli of the random sequence was significantly smaller than that to thefirst deviant (P =0.017;n=62; Wilcoxon matched pairs test; Fig.7A) and the follower standard stimuli (P=8.6× 10⁻³;n=62; Wilcoxon matched pairs test; Fig.7C). For the stand- ard sequences, the above analyses were performed using the stimuli that were shown as deviants or follower standards for each site. To increase statistical power, we included in a subse- quent analysis all 15 stimuli that were shown in the standard quintets, but the difference between the responses for the standard and random sequences still failed to reach significance when integrating the responses in the 280-ms window (P=0.92).
Overall, these data suggest the presence of 2 effects with very different time courses during the response of IT neurons:
an early, transient suppression of the response to stimuli shown in standard quintets and a greater sustained enhance- ment of the response tofirst deviants. These dissociable effects can be demonstrated clearly when pooling the responses to the first deviants and corresponding standard element presenta- tion of all sites recorded in the quintet sequences of experi- ment 1 and 2 (n=190 sites; Fig.7B) and pooling the responses to standard and random sequences of all sites of experiment 2 (n=181 sites; Fig.7D). Binwise testing (FDR corrected) showed a sustained significant enhancement for the deviant stimulus between 120 and 380 ms after stimulus onset with the maximum deviant response at 150 ms. The response suppression for the standard quintet stimuli, relative to the random sequence stim- uli, was present only transiently between 100 and 140 ms, with a maximum response at 110 ms. The MUA of each individual mon- key demonstrated this difference in time course between the response suppression for the standard elements and the enhancement for thefirst deviant (see Supplementary Fig. 7).
The transitional probability from the fifth stimulus of a standard quintet to the first stimulus of the next standard quintet is smaller (P=1/3) than for the last 4 stimuli of a quin- tet (P = 1). We asked whether this difference in transitional probability is sufficiently large to cause a response difference between thefirst and four other stimuli of a standard quintet.
To address this, we pooled the responses of all MUA sites that were recorded in experiments 1 and 2 with standard quintets, thus averaging the responses of a large number of sites across 6 stimuli per position in a quintet per monkey (and 12 across monkeys), reducing spurious differences between positions that can arise because of stimulus (identity) selectivity differ- ences among sites. When pooling the sites (n=391 sites) of the 2 monkeys, we found an effect of position (P=1.15×10⁻³;n= 391; Friedman ANOVA; Fig.8A) with the greatest response to thefirst stimulus of a quintet. FDR corrected multiple compari- sons with Wilcoxon matched pairs tests showed significant dif- ferences between thefirst and third tofifth positions (q<0.021;
corrected for the 10 possible comparisons). The difference between thefirst and second positions failed to reach signifi- cance (q=0.067), and this was because of a difference between the 2 animals in their response to the second position. Monkey O showed a greater response to thefirst compared with the Figure 5.Response differences obtained when the order of neighboring stimuli
was reversed with respect to that in the standard quintet. For instance, com- paring the response to stimulusMin KNMNO minus response to the stimulus Min KLMNO; see Results. Both the data pooled across animals and for the indi- vidual monkeys separately are plotted. Zero on the abscissa indicates stimulus onset and the vertical bars correspond to stimulus onset and offset. Data from experiment 1.
other stimulus positions (P=0.011;n=197; Friedman ANOVA;
Fig.8C), as predicted by the transitional probabilities. However, we found no statistical evidence for a difference between the first and second positions for monkey H (q=0.82), despite an overall statistically significant effect of position in this animal (P=4.61×10⁻³;n=194; Friedman ANOVA; Fig.8B). It is possible that monkey H did not learn the transitional probability of the first stimulus pair of the quintets.
Given this effect of within-quintet stimulus position on response strength, we recomputed the average responses to the standard and random sequences by including only the
third tofifth stimuli of a standard quintet and randomly draw- ing 9 of the 15 stimuli presented in the random sequences. As expected from the within-quintet position effect (Fig.8), the average response to the stimuli presented in the standard quintets of experiment 2 (Fig. 7D; stippled line) dropped slightly but this drop was small compared with the size of the response difference between the random and standard sequences. Also, this analysis showed that the response to the standard quintet stimuli was well below the 95% confidence interval obtained by randomly drawing (without replacement) 1000 times 9 of the 15 random sequence stimuli (gray band in Figure 6.Mean responses to the standard (s) and the random sequence stimuli (r). (A) Data pooled across the 2 animals. (C, E) Data of monkeys H and O, respectively.
(B) Data pooled across the 2 animals for the stimulus presentations for which the number of intervening stimuli between the presentation and the previous presenta- tion of the same stimulus was at least 9, controlling for repetition suppression. (D, F) Data with at least 9 intervening stimuli of monkeys H and O, respectively. Note that the standard and random sequence stimuli were counterbalanced across the animals. Same conventions as in Figure2. Shaded bands indicate standard error of the mean, computed following the procedure byLoftus and Masson (1994). Data from experiment 2 including only standard quintets, obtained before inserting devi- ants into target sequences.
Fig.7D). These differences in responses between the standard and random sequence stimuli remained present when control- ling for repetition suppression. We controlled for repetition suppression was by taking only the presentations of 9 stimuli in the standard and random sequences for which the number of intervening stimuli between the presentation and the previ- ous presentation of the same stimulus was at least 9 (see above; Supplementary Fig. 8).
Discussion
Passive exposure to an uninterrupted sequence of visual stim- uli is known to induce learning of the statistical temporal regu- larities embedded in the sequence. Here we show that exposing monkeys to continuous sequences with a temporal regularity affects the responses of IT neurons. We found that the early phase of the response was reduced for stimuli that belonged to a sequence with a temporal regularity as compared with responses for stimuli that were presented in a random order during the exposure. Importantly, this response reduction
for stimuli of a sequence with a temporal regularity was not caused by stimulus familiarity since familiarity was equated between the random and standard sequences. Also, it remained present when controlling for repetition effects on the response. A second, sustained statistical learning signature was an enhanced response to stimuli that violated thefixed short sequence or were presented in the wrong order. This enhancement was present for stimuli that were not expected to follow the previous stimulus, irrespective of whether the trailing stimulus was a deviant (first deviant) or was present at the correct position within the standard quintet but followed a deviant (follower standard), suggesting that the statistical learning signal in IT is mainly based on temporally adjacent stimuli. These novel data not only demonstrate statistical learning signals in IT but also advances our understanding of the nature of these signals, that is, suppression of the response to learned sequences versus enhancement of the response to stimuli that violated a learned sequence.
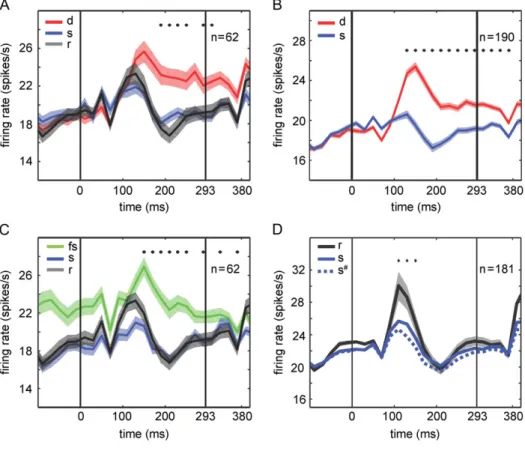
Behavioral and fMRI studies have demonstrated that non- human primates learn statistical regularities in auditory Figure 7.Comparison of responses tofirst deviants, to follower standards, to their corresponding standard elements and to responses to random sequence stimuli.
(A) Comparison of responses tofirst deviants (red), standard elements (blue) and stimuli in random sequences (gray) for the same multi-units (n=62). Data of experi- ment 2 of both monkeys were pooled—see Supplementary Figure 7 for data of the individual monkeys. (C) Comparison of responses to follower standard stimuli (green), standard elements (blue) and stimuli in random sequences (gray) for the same multi-units. Data of both monkeys were pooled—see Supplementary Figure 7 for data of the individual monkeys. The stars indicate significant differences between thefirst deviant or the follower standard and the stimulus in the random sequence (Wilcoxon matched pairs test; FDR correctedq<0.05), tested per 20 ms bin. For other conventions, see Figure2. Data were collected after those of Figure6 (see Materials and Methods). (B) Responses to thefirst deviants (red) and standard elements (blue) for the combined data of experiments 1 and 2 (190 multi-unit sites, pooled across animals). Shaded bands in (A), (B) and (C) indicate standard error of the mean, computed following the procedure byLoftus and Masson (1994).
(D) Responses to all standard quintet stimuli (15 per monkey;“s,”thick blue line) and random sequence stimuli (15 per monkey;“r,”thick black line) of 181 multi-unit sites of experiment 2 (combining data from Figs6Aand7A). The stippled blue line (“s#”) shows the mean response to the last 3 stimuli of a standard quintet (9 stimuli in total per monkey). The gray band shows the 95% confidence interval of the mean response to 9 randomly drawn stimuli (out of 15) of the random sequence. The stars indicate significant differences between the mean response for the standard quintet stimuli and random sequence stimuli (Wilcoxon matched pairs test; FDR correctedq<0.05), tested per 20 ms bin. These significance tests were performed using the response for the last 3 stimuli of the 3 standard quintets and the response for 9 randomly drawn stimuli of the random sequence.