R E S E A R C H A R T I C L E Open Access
New network topology approaches reveal differential correlation patterns in breast cancer
Michael Bockmayr1, Frederick Klauschen1, Balazs Györffy2, Carsten Denkert1and Jan Budczies1*
Abstract
Background: Analysis of genome-wide data is often carried out using standard methods such as differential expression analysis, clustering analysis and heatmaps. Beyond that, differential correlation analysis was suggested to identify changes in the correlation patterns between disease states. The detection of differential correlation is a demanding task, as the number of entries in the gene-by-gene correlation matrix is large. Currently, there is no gold standard for the detection of differential correlation and statistical validation.
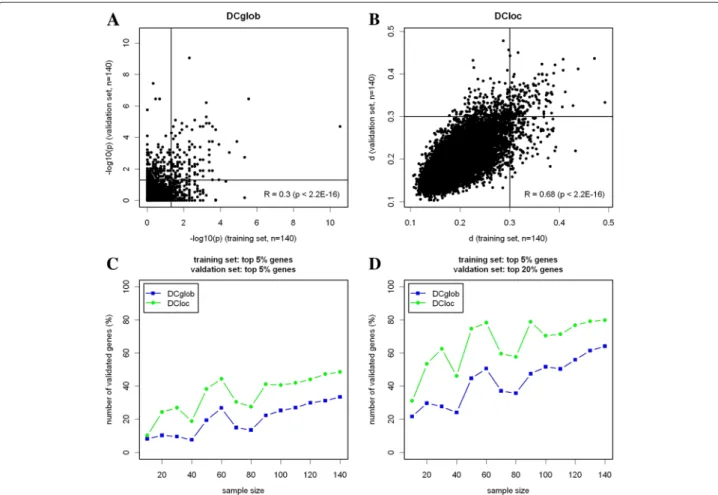
Results: We developed two untargeted algorithms (DClocandDCglob) that identify differential correlation patterns by comparing the local or global topology of correlation networks. Construction of networks from correlation structures requires fixing of a correlation threshold. Instead of a single cutoff, the algorithms systematically investigate a series of correlation thresholds and permit to detect different kinds of correlation changes at the same level of significance: strong changes of a few genes and moderate changes of many genes. Comparing the correlation structure of 208 ER- breast carcinomas and 208 ER+ breast carcinomas,DClocdetected 770 differentially correlated genes with a FDR of 12.8%, whileDCglobdetected 630 differentially correlated genes with a FDR of 12.1%. In two-fold cross-validation, the reproducibility of the list of the top 5% differentially correlated genes in 140 ER- tumors and in 140 ER+ tumors was 49% forDClocand 33% forDCglob.
Conclusions: We developed two correlation network topology based algorithms for the detection of differential correlations in different disease states. Clusters of differentially correlated genes could be interpreted biologically and included the marker genes hydroxyprostaglandin dehydrogenase (PGDH) and acyl-CoA synthetase medium chain 1 (ACSM1) of invasive apocrine carcinomas that were differentially correlated, but not differentially expressed. Using random subsampling and cross-validation,DClocandDCglobwere shown to identify specific and reproducible lists of differentially correlated genes.
Keywords: Differential correlation, Microarray data, Breast cancer, Molecular subtypes, Differential co-expression
Background
Over the last 15 years, global gene expression profiling using microarrays has been established as a common tool for disease research. With this approach, disease mecha- nisms may be studied by comparative expression profiling of disease and healthy tissues or two disease states A and B. In recent years, this approach helped to discover
*Correspondence: jan.budczies@charite.de
1Institute for Pathology, Charité University Hospital Berlin, Charitéplatz 1, 10117 Berlin, Germany
Full list of author information is available at the end of the article
prognostic markers and signatures and to identify tar- get structures for drug intervention. Alterations of gene regulation often result in up- or down-regulated genes.
Therefore, looking for differentially expressed genes using statistical tests is one of the most common strategies for the comparative analysis of microarray data [1].
However, this approach ignores the fact that most of the biological processes require orchestrated action of many genes. Therefore, gene correlation and co-expression have been intensively studied since the early days of microar- rays and the seminal work of Eisen et al. [2]. Today, hierar- chical clustering and heatmaps are ubiquitous in studies of
© 2013 Bockmayr et al.; licensee BioMed Central Ltd. This is an Open Access article distributed under the terms of the Creative Commons Attribution License (http://creativecommons.org/licenses/by/2.0), which permits unrestricted use, distribution, and reproduction in any medium, provided the original work is properly cited.
microarray data. Heatmaps usually serve as a tool for visu- alization of the results. Clustering has also been shown to be useful for the identification of disease subtypes, such as, for instance, defining molecular subtypes of breast cancer [3].
Complementary to differential expression analysis, the study of differential correlation or differential co- expression aims at a deeper understanding of the expres- sion patterns in diseased tissues. As an example, a number of downstream targets could be regulated by a master gene, for example a transcription factor. In tissues where the regulatory mechanism is functional, the module of the target genes will be expressed in an ordered pattern. How- ever, in diseased tissues where the regulatory mechanism is dysfunctional, the expression of the gene module will be unordered or random. Correlation changes of this kind can be detected by differential correlation (DC) analysis, but might be overlooked by differential expression (DE) analysis.
The number of pairwise correlations in global expres- sion data of human tissues is quadratic in the number of genes and exceeds one million. Case-by-case testing would lead to a multiple testing problem, connected with searching for a few differentially correlated gene pairs within a huge number of unregulated correlations. There- fore, it should be more efficient not to study each gene pair separately, but to take into account the overall structure of correlations. Shortly after the microarray technology became common, algorithms for the detection of dif- ferential co-expression and differential correlation were developed [4-6]. Meanwhile, a multitude of algorithms were published [7] that can be divided into targeted, semi-targeted and untargeted approaches [8].
In targeted approaches, predefined gene modules are analyzed for correlation changes between the two dis- ease states. Frequent choices for the modules are Gene Ontology (GO) categories, Kyoto Encyclopedia of Genes and Genomes (KEGG) pathways, or clusters from addi- tional external expression data sets. For example, in gene set co-expression analysis (GSCA) a dispersion index is calculated for each of the modules and the significance is assessed using a permutation test [9]. In [10], a differ- ence network framework is developed and a test statistics is defined by averaging over the edge weights between members of the modules. In another kind of targeted approach, the analysis of correlations is restricted to a pre- defined network, for example to the human interactome [11]. In [12], the expression pattern of breast cancer on the interactome network was analyzed and it was shown that the metastatic cancer phenotype is characterized by an increase of randomness of the local information flux patterns.
In semi-targeted approaches, modules in one of the disease states are defined using clustering, and these
modules are investigated for correlation in the other dis- ease state. The differential clustering algorithm (DCA) starts with clustering of the tissues in the reference dis- ease state and proceeds with reordering the genes in the reference clusters according to the correlations in the second disease state [13]. CoXpress starts with hierarchical clustering of the reference samples and pro- ceeds with a resampling-based approach to find those modules that are co-expressed in one state, but not in the other [14].
Untargeted approaches do not depend on externally defined modules or modules defined by clustering of a reference data set. Therefore, untargeted algorithms are capable of detecting DC in more general situa- tions where differential regulation neither occurs within predefined external nor internal modules. Many of the untargeted approaches start with constructing correlation (or interaction) networks of each of the disease states and proceed with identification of differentially correlated subnetworks [15-18]. The recently published DICER algo- rithm [19] is able to address two different scenarios of DC: differentially correlated clusters, but also differen- tially correlated meta-modules. Here, a meta-module is defined as a pair of gene sets with genes inside the sets being correlated in both disease states, but with differing correlations between the gene sets.
Transformation of a correlation structure into a network requires fixing of a threshold. Whenever a correlation exceeds the threshold, the corresponding two network nodes are joined. A novelty of the current study is to investigate changes in network topology, but at the same time to evaluate a series of correlation thresholds that comprehensively cover the range of correlations in the data. In this way, different kinds of correlation changes can be detected at the same level of significance: strong changes of a few genes, but also moderate changes of many genes.
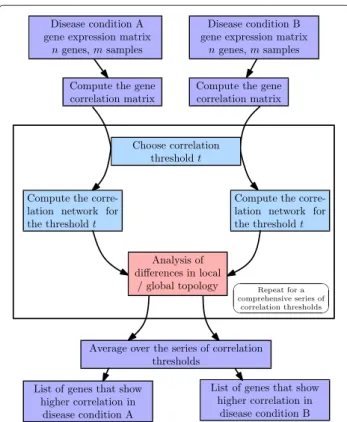
We designed two untargeted algorithms that numer- ically quantify the DC of each gene. Each algorithm delivers an ordered gene list according to the strength of DC between the two disease states. The first algo- rithm aims at the detection of global changes of the network topology (DCglob), the second at the detection of local changes (DCloc). The workflow of the algorithms is shown in Figure 1. In a first step, correlation net- works are constructed for disease states A and B. Second, the DC of each of the genes is calculated as global or local topological change between the networks. Third, the analysis is repeated for 100 (or 200) correlation thresh- olds and the results are averaged. Finally, ranked lists of differentially correlated genes are obtained for both algorithms. False discovery rates (FDR) for the result- ing gene lists are estimated using a random subsampling method.
Figure 1Workflow of the algorithms for detection of differentially correlated genes.In the first step, the gene correlation matrix is calculated for each of the disease conditions. In the second step, correlation networks are constructed for a fixed correlation threshold. Two genes are connected with an edge whenever the Pearson correlation exceeds this threshold. The differences in local (algorithmDCloc) or global (algorithmDCglob) topology of the networks are analyzed. Step two is repeated for a series of thresholds (typically 100) such that a good coverage of the correlations in the data set is obtained. The series of thresholds is chosen as equidistant sequence of Fisher-transformed correlations. In the third step, the results for the thresholds are averaged and a measure of differential correlation is calculated for each of the genes.
After choosing a cutoff point for the measure of differential
correlation, a list of genes with higher correlation in condition A and a list of genes with higher correlation in condition B are obtained.
Worldwide, breast cancer is classified into molecular subtypes based on estrogen receptor (ER) and HER2 status. Determination of the molecular subtype is essential to tailor adjuvant treatment and to estimate of the risk of recurrence after surgery. In the last decade, DE between molecular subtypes of breast cancer was extensively investigated [20-22]. However, the literature on DC anal- ysis of breast cancer is limited and includes a de-novo partitioning method [23] and a targeted analysis of KEGG pathways [24]. Therefore, we tested the new developed untargeted algorithms in a large gene expression data set of 208 ER-, 208 ER+, 208 HER2- and 208 HER2+ breast carcinomas.
Methods
The algorithms DCgloband DCloc(Additional file 1) were implemented using the statistical programming lan- guageR[25]. While the global algorithm focuses on com- parison of the connected components of the networks, the local algorithm compares the next neighbors of the gene under consideration. The general workflow of the algorithms is illustrated in Figure 1.
Computing time
Calculations were done on a Linux computer including 16 GB RAM and an Intel Core i7-2600 processor, 3.40 GHz. In the first step, the gene correlation matrix was calculated and used as input for both of the algorithms.
Because this calculation did not significantly contribute, the computing time was independent of the number of samples. The time to calculate the strength of differential correlation for 12703 genes was 52 minutes forDCglob (200 thresholds) and 69 minutes forDCloc(100 thresh- olds). Including FDR calculation by subsampling analysis (100 subsamples), the calculation time was 88 hours for DCgloband 116 hours forDCloc.
Global topology algorithm
Step 1 The algorithm compares gene expression data of n samples in disease condition A with gene expression data ofnsamples in disease condition B. First, the cor- relation matrix Cq comprising the Pearson correlations cqij=cor(genei, genej)of all pairs of genes is calculated for both disease conditionsq=A,B. The Fisher-transformed correlation matrixzqij = 12 ·log1+c
q ij
1−cqij is the starting point for all further calculations.
Step 2 Correlation networks are computed for a com- prehensive series of correlation thresholds. In the breast cancer data set, the highest correlation between genes is c=0.985 and corresponds to a Fisher-transformed value ofz = 2.5. Therefore, we choose the set of thresholdsT to be the series of 200 equidistant values between 0 and 2.5. For each thresholdt ∈ T, we obtain correlation net- worksNAt andNBtcorresponding to the disease conditions AandB.
Step 3 The decomposition of the networks NAt and NBt into connected components is computed and all con- nected components containing 3 or more genes are selected. We restricted to clusters of 3 or more genes, because this is the minimum number where the network topology comes into play. Changes of pairwise correla- tions could be more effectively studied using a direct approach. Formally, let {At1,. . .,Atk} and {Bt1,. . .,Btl} denote the sets of these connected components in NAt andNBt respectively. After these preparations, we remove
the genes that are contained in a connected component for both networksNAt andNBt from the set of all genes G, yieldingG˜t := G\
1≤i≤k,1≤j≤l(Ati ∩Btj). Then, we build subnetworksN˜At resp. N˜Bt of NAt resp.NBt induced by the genes in G˜t and compute the sets A˜t and B˜t of genes that are contained in connected components ofN˜At and N˜Bt with cardinality greater or equal 3. Because we removed the genes that are contained in correlation clus- ters for both disease conditions, the remaining genes that are in correlation clusters for one of the disease conditions are considered as differentially correlated for correlation thresholdt.
To summarize the information about differential cor- relation for all thresholds, we define indicator functions IjA,IjB:T → {0, 1}for everygj∈Gby
IjA(t)=
1, ifgj∈ ˜At
0, else and IjB(t)=
1, ifgj∈ ˜Bt 0, else . As an example,IjA(t)=1 indicates that genejis member of a connected component in the networkNAt but not in the networkNBt.
Step 4 Finally, genes that are members of connected com- ponents in only one of the networks over a large range of correlation thresholds are selected. To this end, an inter- val of maximal length [a,b] is chosen such thatIjq(t) = 1 for allt ∈[a,b]∩T. Thus, the interval contains as series of threshold values for which a gene is correlated in one of the networks, but not in both networks. The interval lengthb−ais converted to ap-value using Steiger’s test for the comparison of correlation coefficients [26] and used to measure the strength of differential correlation. A list of differentially correlated genes includes all genes with p-valuesp<Sbelow a thresholdS.
Local topology algorithm
Step 1 This step is identical to Step 1 performed for DCglob.
Step 2 We choose the set of thresholdsTto be the series of 100 equidistant values between 0 and 2.5. LetNAt and NBt denote the correlation networks constructed for each thresholdt∈T. For a given genei, letVAi,tresp.VBi,tbe the set of neighbors of this gene inNAt resp.NBt. We define the topological dissimilarity between the two networks in the neighborhood of geneias:
dti :=1− |VAi,t∩VBi,t|
|VAi,t∪VBi,t|.
In this definition, the number of common next neigh- bors in both networks is divided by the total number of
next neighbors. To focus on changes that affect correlation clusters of at least 3 genes, we setdti :=0 if|VAi,t∪VBi,t|<3.
Step 3 Finally, the value of differential correlation for each gene is computed by averaging the topological dis- similarity over the thresholds under consideration,
di:= 1
#T ·
t∈T
dti.
Thus, we obtain a value in [0,1], which represents the strength of differential correlation for each gene. A list of differentially correlated genes includes all genes withd>s above a thresholds.
Estimation of false discovery rates
Statistical evaluation of the algorithms was performed by a repeated random subsampling analysis. We wanted to falsify the null hypothesis that both patients groups exhibit the same gene correlation structure. Therefore, we randomly subsampled arbitrary breast cancer patients to generate the null distribution. This procedure mixes ER+
and ER- patients (as well as HER2+ and HER2- patients) and therefore is appropriate to assess the significance of differential correlations between the ER+ and ER- subtype (as well as the HER2+ and HER2- subtype). Then, we compared the number of differentially correlated genes between breast cancer subtypesnABto the number of dif- ferentially correlated genes between randomly sampled sets of breast cancern0.
In detail, we estimated the expected number of differen- tially correlated genes under the null hypothesis from 100 random subsamples. We obtained (mean values with stan- dard errors)n0= 76±6 and 38±4 forDCglob (cutoff p=0.1, 0.05) andn0=99±8 and 10±1 forDCloc(cutoff d=0.25, 0.3). Thus, 100 repetitions were enough for pre- cise estimation ofn0. A confidence interval was estimated from the 5% and the 95% percentile of the distribution of n0. Finally, for each correlation thresholdt, we estimated
FDR(t)= π0nAB(t)
¯
n0(t) ≈ nAB(t)
¯ n0(t) ,
wherein π0 denotes the proportion of not differentially correlated genes. This is a standard method for estimat- ing the FDR from a subsampling or permutation analysis, see for example [27]. For breast cancer, the number of differentially correlated genes turned out to be small com- pared to the total number of genes. Therefore, slightly overestimating the FDR, we used the approximation π0=1.
Dataset
We generated a large gene expression data set of breast cancer (1317 samples) by fusion of publicly available
microarray data sets. Raw data of GSE1456, GSE2034, GSE4922, GSE6532, GSE7390 and GSE11121 with respec- tively 159, 286, 327, 578, 198 and 200 samples were downloaded from the Gene Expression Omnibus (GEO) website [28]. All the samples were analyzed using the Affymetrix Human Genome U133A microarray. As remarked in [29] some of the samples were contained in two or more data sets. Thus, we removed 431 samples and ended up with a breast cancer gene expression data set of 1317 unique samples. The raw data were preprocessed using themas5protocol as implemented in theRpackage affy[30] and transformed to log2scale. All samples con- sisted of surgical collected fresh-frozen tissue of primary tumors without neoadjuvant treatment.
A large number of genes was represented by more than one microarray probe. In this case, we selected the probe with the highest expression level resulting in a gene expression data set of 12703 unique genes. Immunohis- tochemistry (IHC) and in situ hybridization (ISH) where necessary are the gold standard for the determination of the ER and HER2 status. However, immunohistochemical data of ER and HER2 protein expression were not avail- able for all samples. Hence, ER and HER2 classification was performed using the expression level of the estrogen receptor 1 gene (probe 205225_at) and the HER2 gene (probe 216836_s_at) from the microarray data (Additional file 2). A high concordance between RNA based determi- nation of ER and HER2 states and the IHC based standard method was demonstrated before [22,31]. A value of 10 was chosen as threshold for the ER status and a value of 12 as threshold for the HER2 status.
Visualization and functional analysis
Heatmaps were generated using theRfunctionheatmap.
Hierarchical clustering was executed using the average linkage method with Pearson correlations as similarity measure. Prior to the analysis, the expression level of each gene was centered to mean 0 and standard devia- tion 1. Construction and analysis of networks was car- ried out using theRpackageigraph[32]. Visualization of the networks was realized using Cytoscape [33].
Gene enrichment analysis was executed using DAVID [34,35] with the genes represented by the microarray as background.
Results
Two algorithms were developed for the detection of dif- ferential correlation in different disease states (Figure 1).
The algorithms are based on the detection of either global (DCglob) or local (DCloc) changes in the topology of the correlation network. Both algorithms include the analysis of correlation networks corresponding to a series of cor- relation thresholds that covers the range of correlations in the data.
Identification of differentially correlated genes
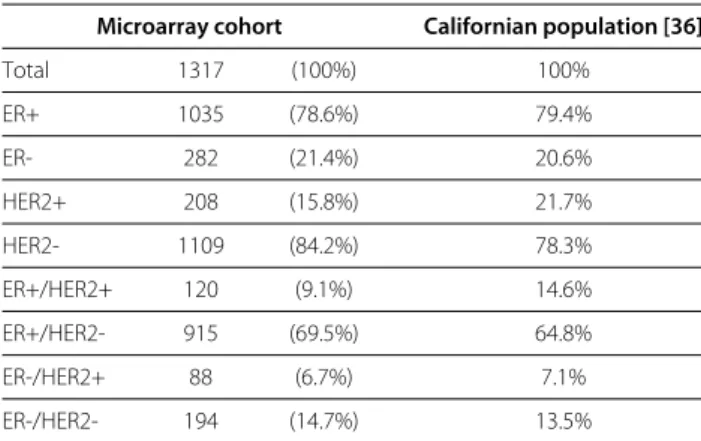
We investigated the differential correlation in the molec- ular subtypes of breast cancer. To this end, six microarray data sets were downloaded from GEO [28] and joined into a large gene expression cohort of 1317 tumor samples. We divided the microarray cohort into molecular subtypes by the status of estrogen receptor (ER) and HER2. The preva- lence of the molecular subtypes in the gene expression cohort was similar to their prevalence in a large popula- tion of Californian women (Table 1). The gene expression cohort included 208 HER2+ samples. To obtain compara- ble results, we worked with the same number of tumors in each of the molecular subgroups and compared 208 ER+ tumors with 208 ER- tumors and 208 HER2+ with 208 HER2- tumors. These subsamples were randomly drawn.
The genes were ranked according to the strength of differential correlationp (DCglob) and d (DCloc), see Additional files 3 and 4. The statisticpcan be interpreted as the significance of the range of correlations, where the gene under consideration takes part in a change of global topology. The statisticd can be interpreted as topologi- cal dissimilarity of the networks in the neighborhood of the gene under consideration. Stronger differential corre- lation corresponds to lowerp, but higherd.
Lists of differentially correlated genes were gener- ated by choosing thresholds for the two statistics (Table 2). For each of the gene lists, the false discovery rate (FDR) was estimated using a random subsam- pling method. Using DCglob, 630 differentially corre- lated genes (FDR = 12.1%) were detected between ER subtypes and 804 (FDR = 9.5%) between HER2 sub- types. Using DCloc, 770 differentially correlated genes (FDR = 12.8%) were detected between ER subtypes and 1027 (FDR = 9.6%) between HER2 subtypes. Lower FDRs can be obtained by using more stringent cutoffs (Table 2).
Table 1 Distribution of ER and HER2 status
Microarray cohort Californian population [36]
Total 1317 (100%) 100%
ER+ 1035 (78.6%) 79.4%
ER- 282 (21.4%) 20.6%
HER2+ 208 (15.8%) 21.7%
HER2- 1109 (84.2%) 78.3%
ER+/HER2+ 120 (9.1%) 14.6%
ER+/HER2- 915 (69.5%) 64.8%
ER-/HER2+ 88 (6.7%) 7.1%
ER-/HER2- 194 (14.7%) 13.5%
Distribution of ER and HER2 status in the microarray cohort and in a large Californian population of 67698 breast cancer patients.
Table 2 Numbers of detected genes byDCgloband by DCloc
Algorithm Threshold ER HER2
Genes FDR Genes FDR
DCglob p<0.1 630 12.1% 804 9.5%
p<0.05 420 8.9% 544 6.9%
DCloc d>0.25 770 12.8% 1027 9.6%
d>0.3 185 5.4% 238 4.2%
Number of detected genes after choosing the cutoff pointsp= 0.1, 0.05 (DCglob) andd= 0.25, 0.3 (DCloc). FDRs were estimated using a repeated random subsampling method.
Variation of the cutoff parameters
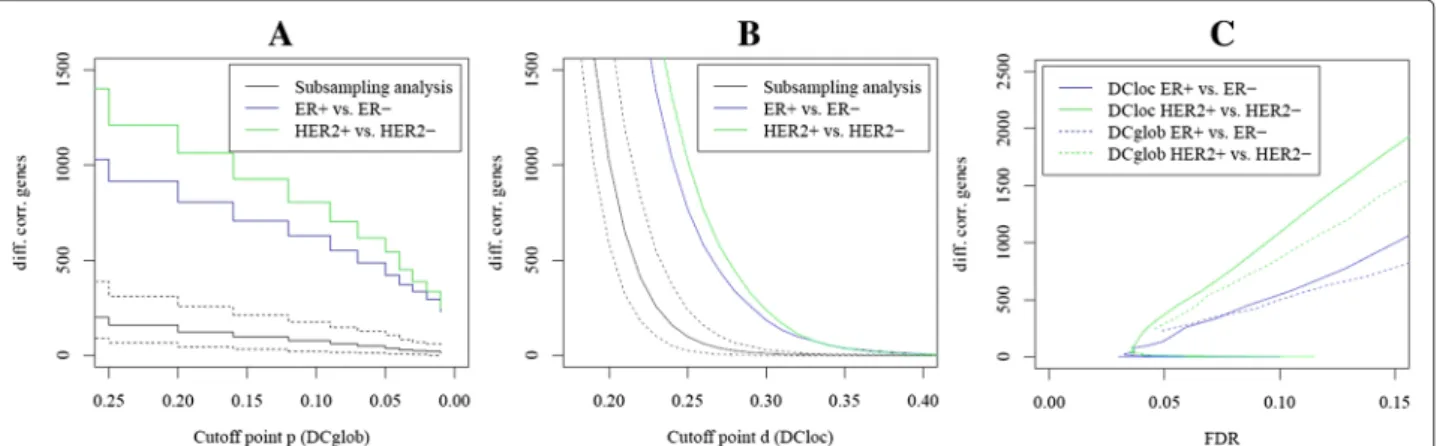
Figure 2 shows the number of differentially correlated genes in dependence of the strength of differential cor- relation. The number of differentially correlated genes between randomly subsampled groups of breast cancer tissue is shown as baseline. Indeed, there were signif- icantly more differentially correlated genes between molecular subtypes of breast cancer than between ran- dom samples of breast cancer. ROC curves show the number of differentially correlated genes in dependence of the FDR (Figure 2C). Over a large range of FDRs, the number of differentially correlated genes between the HER2+ and the HER2- subtype was higher than the num- ber of differentially correlated genes between the ER+ and the ER- subtype. Furthermore, the number of differen- tially correlated genes detected byDClocfor a fixed FDR value was higher than the number of differentially corre- lated genes detected byDCglobfor both of the subtype comparisons.
Differential correlation vs. differential expression
We looked for differential expression between the breast cancer subtypes using the standard approach of Welch’s test. After using the Benjamini-Hochberg (BH) method for multiple testing correction and a FDR of 5%, 55% of all genes were differentially expressed between ER+ and ER-, and 31% were significantly differentially expressed between HER2+ and HER2-. Among the differentially cor- related genes identified byDCglob(p < 0.1), 76% were differentially expressed between ER+ and ER- and 48%
were differentially expressed between HER2+ and HER2-.
ForDCloc(d>0.25), the percentages were similar (73%
and 47%). Thus, DC analysis provided additional infor- mation beyond DE analysis. As an example, the marker genes for the invasive apocrine subtype of breast cancer acyl-CoA synthetase medium chain 1 (ACSM1) and hydroxyprostaglandin dehydrogenase (PGDH) exhibit strong differential correlation (DCglob p=8.0E-05 and p = 0.0004;DCloc d = 0.26 andd = 0.27), but they would not be detected in a differential expression analysis (p = 0.21 and p = 0.55 after Benjamini-Hochberg correction).
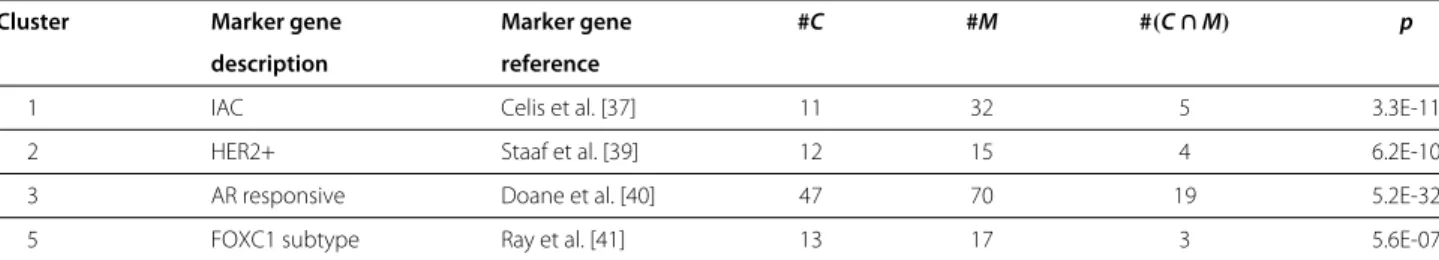
Functional analysis of the differentially correlated genes We performed a gene enrichment analysis using the bioin- formatics tool DAVID [34,35]. We separately submitted the differentially correlated genes between ER+ and ER-, and HER2+ and HER2- (p < 0.1 forDCglob,d > 0.25 forDCloc) and identified many overrepresented terms.
The most important results are presented in Table 3 for ER, and in Table 4 for HER2. First, there was a signifi- cant enrichment in cell cycle genes, which was particu- larly pronounced in the analysis comparing HER2+ and
Figure 2Dependence of the resulting gene list on the cutoff point.(A)AlgorithmDCglob: Number of detected genes in dependence of the cutoff point for the change of global network topology. The parameterpis connected with the length of the interval where the change of correlation is stable. Additionally, the mean number of detected genes comparing 100 pairs of breast cancer random subsamples including a 90%
confidence interval is shown.(B)AlgorithmDCloc: Number of detected genes in dependence of the cutoff point for the changes of local network topology. The parameterdcan be interpreted as proportion of correlated genes that are not shared by condition A and B. Similarly, the number of detected genes comparing 100 pairs of breast cancer random subsamples including a 90% confidence interval is shown.(C)Comparison of DCglobandDCloc: The number of detected genes in dependence of the FDR.
Table 3 Gene enrichment analysis (ER+ vs. ER-)
Category Catalog DCloc DCglob
N p N p
Extracellular matrix GOTERM_CC_FAT 60 9.6E-13 29 2.8E-01 Cell adhesion GOTERM_BP_FAT 80 2.0E-07 43 5.5E-01
Cell cycle GOTERM_BP_FAT 79 2.2E-05 63 3.7E-03
Immune response GOTERM_BP_FAT 70 6.4E-05 n.s.
Growth factor binding GOTERM_MF_FAT 22 1.5E-04 n.s.
Organelle fission GOTERM_BP_FAT 30 1.6E-03 24 4.2E-02 ECM-receptor interaction KEGG_PATHWAY 18 3.9E-03 n.s.
Ribosome KEGG_PATHWAY 18 5.5E-03 n.s.
Oxidoreductase SP_PIR_KEYWORDS 42 8.3E-02 42 2.2E-02 The table shows the most significantly enriched biological themes in the lists of 770 (DCloc) and 630 (DCglob) DC genes. For each functional category, the number of genes in the category (N) and the significance of enrichment (Benjamini-Hochberg correctedp-value) are shown. Some of the findings of DCglobare not significant (n.s.).
HER2- breast cancer (p< 6.8E-13). Genes related to the immune response were also enriched. Next, genes asso- ciated with the extracellular matrix (p < 9.6E-13) were enriched in the differentially correlated genes between ER+ and ER-. Genes associated with the ribosome and oxidative phosphorylation were enriched in the differen- tially correlated genes between HER2 subtypes. In general, the set of genes identified byDCloccontained more sig- nificantly overrepresented terms than the set of genes identified byDCglob.
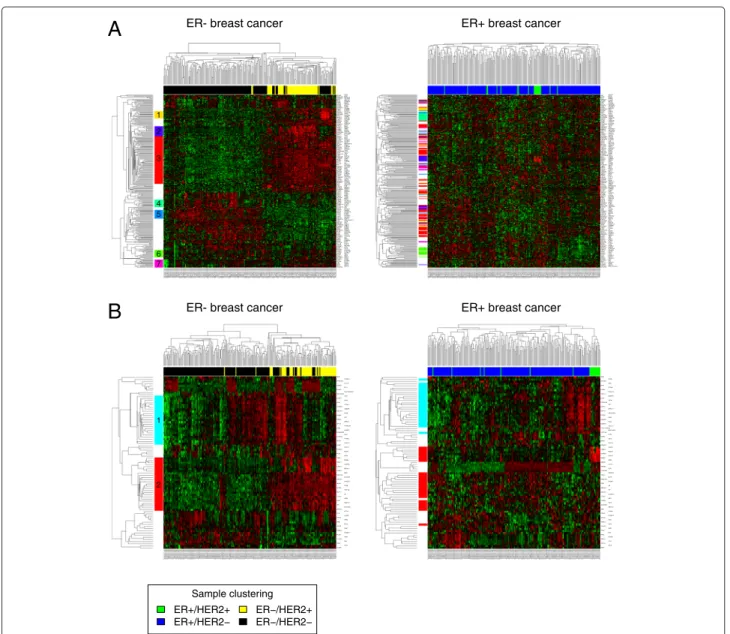
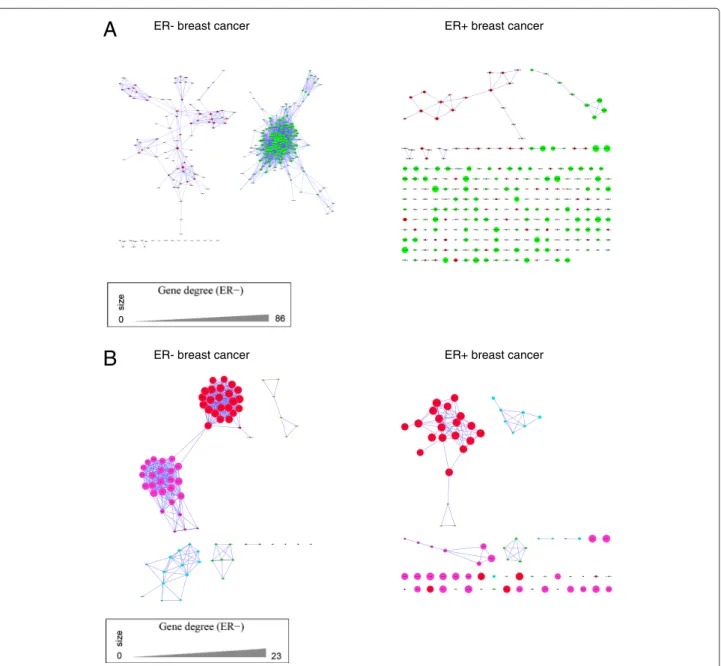
Heatmap analysis
For each of the subtype comparisons, we generated sep- arate lists of genes that showed a stronger correlation in one of the subtypes compared to the complementary sub- type (for example ER- compared to ER+). The resulting four gene lists (ER-, ER+, HER2- and HER2+ subtype) were subjected to hierarchical clustering and heatmap analysis (Figure 3, Additional file 5). The left part of the figures shows a heatmap of the subtype under investiga- tion. Clusters of genes with Pearson correlation greater than 0.4 are marked by colored bars. The right part of
Table 4 Gene enrichment analysis (HER2+ vs. HER2-)
Category Catalog DCloc DCglob
N p N p
Translational elongation GOTERM_BP_FAT 57 1.5E-32 14 3.1E-01
Ribonucleoprotein SP_PIR_KEYWORDS 83 7.1E-31 46 1.2E-09
Ribosome KEGG_PATHWAY 55 4.0E-30 14 1.8E-01
Acetylation SP_PIR_KEYWORDS 303 8.5E-20 276 2.3E-28
Mitotic cell cycle GOTERM_BP_FAT 77 6.8E-13 65 7.8E-12
Regulation of ubiquitin-protein GOTERM_BP_FAT 27 3.3E-09 17 6.5E-04
ligase activity during mitotic cell cycle
Immune response GOTERM_BP_FAT 98 1.0E-08 n.s
Oxidative phosphorylation KEGG_PATHWAY 28 1.7E-04 30 4.5E-08
Mitochondrion GOTERM_CC_FAT 93 4.0E-01 106 6.6E-07
Proteasomal ubiquitin-depend- GOTERM_BP_FAT 27 2.7E-06 20 8.4E-04
ent protein catabolic process
Mitochondrial membrane part GOTERM_CC_FAT 26 1.3E-04 25 4.5E-06
MHC protein complex GOTERM_CC_FAT 13 3.5E-04 7 1.7E-01
Growth factor binding GOTERM_MF_FAT 22 8.5E-03 n.s
NADH dehydrogenase activity GOTERM_MF_FAT 10 7.6E-02 11 2.4E-03
ATP synthesis coupled GOTERM_BP_FAT 12 2.7E-02 12 5.9E-03
electron transport
Anti-apoptosis GOTERM_BP_FAT 30 5.0E-02 n.s
The table shows the most significantly enriched biological themes in the lists of 1027 (DCloc) and 804 (DCglob) DC genes. For each functional category, the number of genes in the category (N) and the significance of enrichment (Benjamini-Hochberg correctedp-value) are shown. Some of the findings ofDCglobare not significant (n.s.).