SERBI ATRI B ' 19
SE R B IA TR IB '1 9
15 – 17 May 2019, Kr aguj evac, Ser bi a
16 t h I nt er nat i onal Conf er ence on Tr i bol ogy Proceedi ngs on Engi neeri ng Sci ences
Vo l. 1, N o. 1 (2 01 9)
ISSN: 2620-2832
ISSN: 2620-2832
Proceedings on
Engineering Sciences Serbian Tribology Society University of Kragujevac Faculty of Engineering
Proceedings on Engineering Sciences
16 th International Conference on Tribology
15 – 17 May 2019, Kragujevac, Serbia
SERBIATRIB ‘19
EDITOR: Slobodan Mitrović
Proceedings on Engineering Sciences
16
thInternational Conference on Tribology – SERBIATRIB ‘19
Vol. 1, No. 1 (2019) ISSN: 2620-2832
Editor: Slobodan Mitrović
Faculty of Engineering, University of Kragujevac
Editorial Assistant: Dragan Džunić
Faculty of Engineering, University of Kragujevac
Technical editor: Marko Pantić
Faculty of Engineering, University of Kragujevac
Publisher: Faculty of Engineering, University of Kragujevac Sestre Janjić 6, 34000 Kragujevac, Serbia
Editorial Address: Faculty of Engineering, University of Kragujevac, Sestre Janjić 6, 34000 Kragujevac, Serbia
Frequency: 2 issues per year
Printed by: Inter Print
Jurija Gagarina 12, 34000 Kragujevac, Serbia Circulation: 150 copies
Copyright © 2019 by University of Kragujevac, Faculty of Engineering
The publication of this Proceedings was financially supported by the
Ministry of Education, Science and Technological Development of the
Republic of Serbia.
Serbian Tribology Society
SERBIATRIB ‘19
16th International Conference on
Tribology Faculty of Engineering University of Kragujevac
Kragujevac, Serbia, 15 – 17 May 2019
STUDY ON FRETTING CORROSION OF TIN-COATED ELECTRICAL CONTACTS
Sándor KOVÁCS1, Péter MARGITAI2, Alexandra GÁL2, Szabolcs SZÁVAI3,*, Péter RÓZSAHEGYI2
1Institute of Physical Metallurgy, Metalforming and Nanotechnology, University of Miskolc, Miskolc, Hungary
2Bay Zoltán Nonprofit Ltd. for Applied Research, Miskolc, Hungary
3Institute of Machine and Product Design, University of Miskolc, Miskolc, Hungary
*Corresponding author: szabolcs.szavai@bayzoltan.hu
Abstract: : The examination of the failure of electric connectors of electric powered vehicles is at the forefront of current vehicle developments, because the connector’s operating time increases significantly in comparison with internal combustion engine vehicles. It was observed that the low amplitude fretting corrosion plays the most important role in failure, so the lifetime of the failure process is decisive in the life span of the connector. Typically, the failure of an electrical connector in terms of product is an increase in electrical resistance that can even cause malfunction of the drive within the product expected lifetime because of the generated Joule heat that causes temperature rise.
The aim of our work is to study the fretting corrosion process in a given geometry and material quality of electrical connection by experiment and numerical model.
In the experimental test, an experimental construction was set which simulated contact properties of the built-in connectors. Tests for failure-life were performed as a function of the clamping force of the mating members and the amplitude of the relative displacement of the contact surfaces, of which magnitude can be typically for fretting. The change in resistance at the contact surface was measured and examined when this value reached the limit value for failure, thus determining the life span for fretting corrosion.
The experimental set-up was then modelled by finite element method. The purely elastic FE model made it possible to model the gradual removal of the material for given force-amplitude-frequency values by using the Archard’s theory. The valid wear coefficient was searched that creates the same wear crater in the calculation as in the measurements.
Then, using the measured data, the FE analysis revealed the mechanical stress conditions, the electrical current flow conditions, and the resulting thermal conditions during the wear process both on and below the contact surface, which provides additional information on the details of the fretting corrosion process.
Keywords: fretting, corrosion, wear, failure, FE analysis, lifetime
1. INTRODUCTION
As regards the electrical connectors of cooling fans used in electric cars, the results of the standard lifetime testing procedures used
in the case of internal combustion vehicles are not relevant, as the operating times of the connectors are significantly higher.
Consequently, the expected lifetime of the connectors will be higher in the standards of
electric automotive industry under development than in the internal combustion specifications. This requires the introduction of accelerated standardized lifetime tests.
In our work, one of the main factors influencing the lifetime of the connector, the fretting corrosion process, was studied using experimental and numerical tools to develop the testing standards for electric cars with the help of this knowledge. When the contact surfaces have oscillatory displacement at small sliding amplitude (smaller than 100 μm), electrical insulating oxidation products are continuously generated at the contact surfaces and cause fretting corrosion [1–6]. When fretting corrosion occurs, the contact resistance is increased, resulting in malfunction of the electronic devices.
And the fretting corrosion has a chance because the small sliding amplitudes occur when the electric cars are operating.
The geometry and the material quality of the investigated connector were given in advance which was used by the cooperating automotive company for cooling fans.
In a first step, a simple geometry physical simulation was constructed in which a point contact properties are formed that corresponds to the average mechanical stress on the line contact surfaces of the electrical connector calculated by Hertz theory. The material was the same: industrial purity tin coated industrial purity copper.
The end-of-life phenomenon was determined with the help of a collaborative industrial partner, defined by a limit value for transition electrical resistance on the contact surface. In the first step, the limit value for the connector was assumed to be 10 mΩ. This value was converted according to the contact area of the experimental design. Thus, in our physical fretting simulation the electrical resistance was measured until the limit value of the transition electrical resistance was reached and then the process was stopped.
Vincent et al. [6] investigated the fretting sliding transition from partial slip to gross slip for electrical contacts with noble and non- noble material coatings. They reported that if the displacement amplitude becomes higher
than the transition value, the generalized gross slip condition activates debris formation over the whole contact surface, resulting in unstable electrical resistance for non-noble material coatings. When the displacement amplitude is lower than the transition value then the partial slip regime occurs. Partial slip causes an annular slip area on the outer periphery and a stick zone in the center area where slip does not occur. The stick zone in the center has metal-to-metal contact and therefore the electrical resistance remains low in a stable way during the lifetime. So it is possible to achieve an infinite lifetime of the electrical connector. In contrast, when a gross slip occurs, slip occurs over the entire contact area and oxide debris is created in the entire area. As a result, the electrical resistance rapidly increases with the number of cycles.
Noble material coatings can only extend the lifetime of the electrical contacts. Wearing-out of the substrate coating material caused high and unstable electrical resistance [6].
To obtain as much information about the transition value of the amplitude and the changes in the lifespan as we can, the amplitude and the clamping force between the mating parts were varied and the lifetime was detected for each measurement. Also the effect of previous aging of the materials of connectors was studied.
In order to obtain more detailed data about of the degradation phenomenon a FEM numerical model was created. The built FEM model was a coupled structural-electrical- thermal model which was also able to the modelling of wear. The modelled geometry was the geometry of the physical simulation which is a contact of a surface of a hemisphere and a surface flat block. Also, for the electrical calculation, the measured transition electrical resistance were used.
The basis of the wear modelling was the Archard’s equation. The calculation’s time requirement of wear simulation was so high that an acceleration method was used which was implemented in the Archard’s equation. The model was validated by the comparison of the measured and calculated wear depth and width.
266 16th International Conference on Tribology - SERBIATRIB ‘19
2. EXPERIMENTAL PROCEDURES
A specific electrical connector of cooling fans used in electric cars was studied which can be seen with its CAD model in Fig.1. These are industrial purity copper connectors coated by 3μm thick industrial purity tin layer.
FEMALE MALE
Figure 1. Female and male parts of the electrical connector of cooling fans and its CAD model In order to study the contact properties, specimens with simpler geometry and with the same material and coating as in the electrical connectors were used for fretting experiments.
The aim of the experiment was to compare the resistance values of the test specimens produced by the male terminal of connectors at different amplitudes and clamping forces as a function of the number of cycles. Knowing this information, lifetime graphs similar to strain-cycles curves were determined based on different parameters.
specimen A specimen B
Figure 2. A and B parts of the contact specimen of the fretting experiments
The test specimens were prepared as shown in Fig.2. The relatively large surface of male terminal of connector provides the opportunity to form the required specimens (specimen A and B). The A specimens were embossed by a steel ball with R1 = 5 mm diameter (in Fig. 2). Then the specimen A was attached to the test equipment by soldering to avoid the unwanted vibration and backlash of the specimen. After the test, the soldered specimen can be removed without destruction and a new specimen can be fixed.
The specimen B was cut from the male connector as it can be seen in Fig. 2.
Specimen B was attached to the copper sample holder using screws.
Figure 3. E10000 electrodynamic test equipment with the developed fretting test holders
Figure 4. Schematic illustration of E10000 electrodynamic test equipment
The test equipment The tests are carried out on the E10000 electrodynamic test equipment with the developed fretting test
holders as it can be seen in Fig. 3 and 4. The soldered horizontal part was created the uniaxial clamping force between the specimen A and B. The copper sample holder moved vertically in accordance with the given frequency and amplitude. The specimens are electrically insulated from the rest of the equipment so the electrical resistance change can be measured (Figs. 3-4).
Electrical resistance measurement is performed using a Keithley 2410 resistance meter. Temperature measurement was also carried out on the specimens during the fretting tests by thermocouples.
The lifetime test plan was:
In the first series of tests, they were carried out with a force of 5N at room temperature (23˚C) with a relative humidity of 50% at a frequency of 30 Hz.
The variable parameter was the amplitude.
In the second series of tests, the effect of the compressive force was tested up to a pressure of 10 N.
In the third series of tests, aged specimens were examined. Aging was done at 140 °C for 14 days.
In addition, development of the wear track was studied by measuring the surface roughness using Altisurf surface profiler with CL2 chromatic confocal sensor and the dimensions of the crater created by the wear track using a microscope. For this purpose, measurements were made up to different parts of the previously measured number of failure cycles, and the craters thus obtained were examined by surface profiler. The selected test parameters were 10 μm amplitude, 30 Hz frequency, 5 N load, 23 C ambient temperature and 50% humidity. In this case, the maximum number of cycles was 35620, at which we reached the critical value of the electrical resistance of failure. An additional 5 measurements were made up to 1/6, 2/6, 3/6, 4/6, 5/6 of the maximum cycle count.
2.1 Evaluation procedure for lifetime experiments
In the experiments, electrical resistance- cycles graphs were recorded. The actual
electrical resistance values cannot be accurately determined even with the electrical resistance measured on the wires and connections During the electrical resistance measurement, only the electrical resistance change is recorded, which was used to determine the cycle value of the failure, i.e.
when the critical resistance value is reached.
The value of the critical electrical resistance for each sample is different, depending on the size of the contact surface. Therefore, for each specimen, the extent of the critical resistance change was determined individually, based on the measured contact surface after the test, calculated by the following equation:
(1)
R1 is equal to 10 mΩ. Aspecimen is the measured contact area on the specimen which varies in size around 0.09 mm2 as a function of the test amplitude and cycle number. Aterminal
is the measured contact area on the terminal of the electrical connector of which size is around 2.91 mm2. Thereby, the critical electrical resistance to be measured on the surface is increased from the required 10 mΩ to more than 300 mΩ.
Knowing the defined critical resistance values, the critical cycle number for the test amplitude can be read from the electrical resistance - cycle number diagrams obtained from the experiments.
3. COUPLED NUMERICAL MODEL
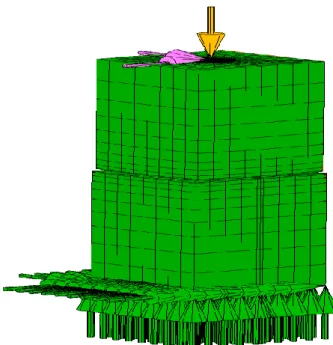
FE analysis of contact properties of specimens of fretting experiments was carried out. The finite element model was a coupled model containing structural, wear, thermal and electrical analysis. The modelled geometry of specimens can be seen in Fig. 5.
However, to save calculation time, only a small part of bodies of specimens were modelled around the contact area where the contact exerts its effect. In that parts of the bodies, a mesh were created as it can be seen in Fig. 5. The mating surfaces are smooth and the FEM was quasi-static.
268 16th International Conference on Tribology - SERBIATRIB ‘19
There were 3 μm thick tin layers on mating surfaces while the material of other element in the body is copper. Because of the elastic model is more conservative and the calculation time was shorter than the elasto- plastic model the elastic model was used for this study.
Mechanical properties of industrial purity copper:
Young’s modulus: 117000 MPa
Poisson ratio: 0.33
Density: 8960 kg/m3
Mechanical properties of industrial purity tin:
Young’s modulus: 41600 MPa
Poisson ratio: 0.33
Density: 7310 kg/m3 Boundary conditions:
The nodes on the bottom surface of the part of specimen B are fixed
The motion parallel to the mating surface and the clamping force were defined on one node on the upper surface of the part of specimen A
The friction coefficient between the mating surfaces 0.15
There was no buckling of the parts of the bodies which was ensured by links defined on the side nodes
The boundary condition can be seen in Fig.
5 where the fixing is marked with green arrows, the motion definition with pink arrows and the clamping force definition with orange arrow.
The clamping force was 5N. The motion was defined by sine curve where amplitude 10 μm and frequency 30 Hz.
Electrical properties of the coupled model:
Specific resistance of copper: 1.68·10-8 Ωm
Specific resistance of tin: 1.09·10-7 Ωm Boundary conditions:
0V potential sinks defined on the nodes of the upper surface of the part of specimen A
25 piece of point current source are defined on bottom surface of the part of specimen B, 4 mA in each of them
20 mΩ was the assumed contact electrical resistance between the mating surface.
Figure 5. Meshed parts of the specimens A and B with structural boundary conditions
The electrical boundary condition can be seen in Fig. 6 where 0V potential sinks is marked with green arrows and electrical sources with purple arrows.
Figure 6. Meshed parts of the specimens A and B with electrical boundary conditions (sources and sinks)
Thermal properties of the coupled model:
Thermal conduction of copper: 400 W/(m·K)
Thermal conduction of tin: 67 W/(m·K)
Specific heat capacity of copper: 385 J/(kg·K)
Specific heat capacity of tin: 210 J/(kg·K)
Transition thermal conduction between the mating surfaces: 10000 W/(m·K)
The given value of transition thermal conduction is an overestimation of the real value which was unknown before the examination.
The initial condition was 293 K. With the exception of the mating surfaces, there was not heat transfer through boundary surfaces on both bodies.
The frictional heat and the Joule heat were calculated together with the heat transfer.
For numerical simulations MSC Marc finite- element software was used.
Wear was modelled by Archard’s equation. This equation is the most widely used for adhesive and abrasive wearing simulation [7-16]. MSC Marc implements wear by moving the nodes of the contact surface to the direction of wear with the extent of the wear depth.
The wear depth can be calculated by the next time-dependent equation based on the Archard’s equation [7]:
̇ (2) where ̇ [mm/s] wear rate (temporal change in wear depth), k[mm3/(Nm)] is the specific wear rate, σ[MPa] is the normal stress on the contacting surface and vrel[m/s] is the relative velocity in a mating point of the contact surfaces. The exact value of k was determined by comparison with validation measurements.
For reducing the time consuming of the coupled model an acceleration technique was used for the wear model where the increase of the wear depth calculated for a step was multiplied by a factor. In case of the acceleration method, the (3) equation was used to calculate the position change of the nodes of the contact surface due to wear in each time step:
̇ (3) where [mm] and [mm] are the position of a node in n-th and (n+1)-th time step, f [-] is the acceleration factor, ̇ [mm/s]
wear rate (temporal change in wear depth), [s] is the time step of the FEM calculation.
4. RESULTS AND DISCUSSION 4.1 Experimental results
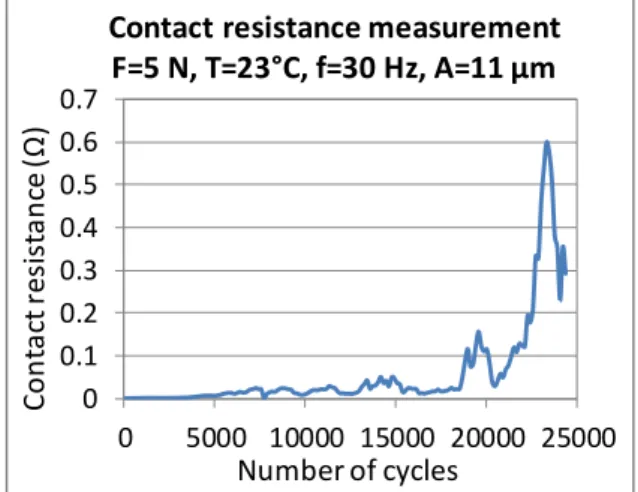
The experimental lifetime tests were performed for given force, ambient temperature, frequency, amplitude and the electrical resistance data were recorded as it can be seen in Fig. 7. When the magnitude of the resistance change belonging to the failure phenomenon was reached, the test was stopped. After measuring the wear trace, the value of the exact critical electrical resistance of the failure is determined based on Eq. (1). The lifetime of the critical resistance was then determined inversely from the diagrams similar to Fig. 7 obtained from the measurements. This allowed us to determine a point on the strain- cycles-like amplitude-cycle curve.
Figure 7. Measured electrical resistance as a function of the number of cycles for fixed
parameters
Figure 8. Lifetime diagram for fixed force temperature and frequency
0 0.1 0.2 0.3 0.4 0.5 0.6 0.7
0 5000 10000 15000 20000 25000
Contact resistance (Ω)
Number of cycles
Contact resistance measurement F=5 N, T=23°C, f=30 Hz, A=11 µm
y = 64.513x-0.177 R² = 0.571
4
1000 100000 10000000
Amplitude (µm)
Number of cycles to failure Number of cycles to critic contact
resistance - Amplitude graph F=5 N, T=23 °C, f=30 Hz
Damaged Not damaged
8 µm 8
12 16
270 16th International Conference on Tribology - SERBIATRIB ‘19
According to the test plan, only the amplitude was changed with fixed force, frequency, humidity and ambient temperature in the first measurement series. The resulting amplitude-cycle lifetime curve can be seen in Fig. 8. As it can be seen, there is an 8 µm limit amplitude value below which the failure phenomenon does not occur.
In case of the second measurement series, the clamping force was increased. The resulted lifetime diagrams can be seen in Fig. 9-10. Fig.
10 clearly shows that with increased power, lifetime was increased. Also the limit amplitude belongs to “infinite” lifetime was increased with the clamping force.
Figure 9. Lifetime diagram in case of 5 N and 10 N clamping force (logarithmic scale)
Figure 10. Lifetime diagram in case of 5 N and 10 N clamping force
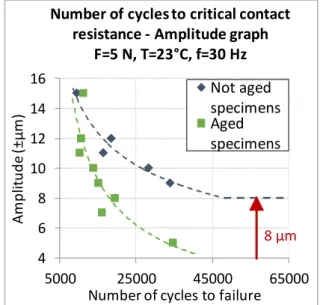
In case of the third measurement series, the lifetime results of aged specimens were compared to results of the first measurement series where the clamping force was 5 N. The resulted lifetime diagrams can be seen in Figs.
11-12. The results are indicated that the aging process decreasing the lifetime of the electrical connectors. After 14 day aging the decreasing of the lifetime was so large that the limit amplitude belongs to “infinite life” was become less than 4 µm.
Figure 11. Comparison of the lifetime curves of aged and without aged specimens
Figure 12. Comparison of the lifetime curves of aged and without aged specimens
For later validation of the coupled FEM model, wear traces were examined by surface profiler as the wear trace evolved. The maximum cycle was obtained by the previous
y = 64.513x-0.177 R² = 0.571
y = 56.854x-0.16 R² = 0.2896 4
1000 100000 10000000
Amplitude (± µm)
Number of cycles to failure Number of cycles to critical contect
resistance - Amplitude graph T=23 °C, f=30 Hz
Damaged, F=5 N Damaged, F=10 N Not damaged, F=10 N
8 µm 8
12 16
4 6 8 10 12 14 16
5000 25000 45000 65000
Amplitude (µm)
Number of cycles to failure Number of cycles to critical contact
resistance - Amplitude graph T=23°C, f=30 Hz
5 N 10 N
8 µm
y = 64.513x-0.177 R² = 0.571
y = 3034.2x-0.604 R² = 0.6258 4
1000 100000 10000000
Amplitude (± µm)
Number of cycles to failure Number of cycles to critical contact
resistance - Amplitude graph F=5 N, T=23 °C, f=30 Hz
Not aged specimens
8 µm 8
12 16
4 6 8 10 12 14 16
5000 25000 45000 65000
Amplitude (±µm)
Number of cycles to failure Number of cycles to critical contact
resistance - Amplitude graph F=5 N, T=23°C, f=30 Hz
Not aged specimens Aged specimens
8 µm
lifetime measurements which was equal to 35620. And additional 5 measurements were made up to 1/6, 2/6, 3/6, 4/6, 5/6 of the maximum cycle count.
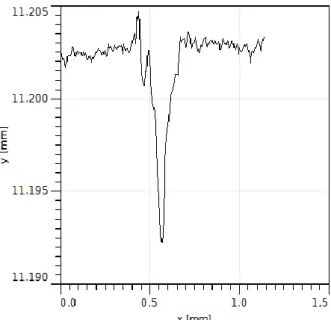
It was found that the wear depth has already been reached 11 µm at sixth of the total lifetime which depth is more than three time bigger than the thickness of the tin coating layer. Only the specimens B of each measurement was taken into account for validation because of its plain geometry since the wear depth can be more accurately determined. These results can be seen in Fig. 13-15.
Figure 13. Wear depth measured by surface profiler for sixth of lifetime of given force (5 N),
temperature (23 °C), humidity (50%) and frequency (30 Hz)
Figure 14. Wear depth measured by surface profiler for half of lifetime of given force (5 N),
temperature (23 °C), humidity (50%) and frequency (30 Hz)
Figure 15. Wear depth measured by surface profiler for total lifetime of given force (5 N), temperature (23 °C), humidity (50%) and
frequency (30 Hz)
As it can be seen in Table 1, the diameters and areas of the wear traces are also stabilized around a constant value very fast as the number of cycles increased.
It is assumed that after the fast fretting wear, the oxidation process of the copper- copper contact takes over the role until the failure phenomenon is reached. In this second period, the extent of wear is negligible because of the wear trace geometry and the debris accumulation between the contacting surfaces.
Table 1. Sizes of wear traces measured by optical microscope in case of measurements carried out different part of the total lifetime
1/6 of lifetime
1/2 of lifetime
Total lifetime
#Cycles 5937 17 810 35620
Length of
trace 382 µm 419,5 µm 419,2 µm Width of
trace 304 µm 279,5 µm 276,3 µm Area 0,09241
mm2
0,09561 mm2
0,09493 mm2 Wear
trace (100x zoom)
272 16th International Conference on Tribology - SERBIATRIB ‘19
4.2 Result of numerical calculation
With the help of FEM numerical analysis the wear stage of the fretting corrosion was studied. So the total number of cycles was 5937 in this case.
Half model was used for the calculation with a symmetry plain which lays in the middle of the meshed parts of specimens parallel to the relative movement.
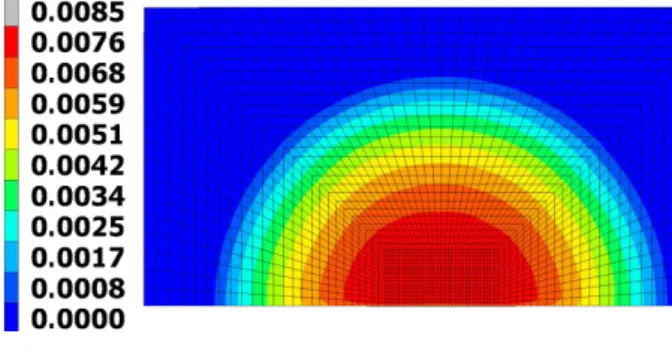
First, the coupled FEM model was validated by the measured sizes of the wear craters. The wear depth was measured by surface profiler. For the latitude measurements of wear trace optical microscope was used since the wear under 3 μm is difficult to identify with surface profiler due to the adhered debris and the surface roughness of the same size. By contrast, the areas affected by the contact with the optical microscope are well identifiable.
Figure 16. Calculated wear depth of the specimen B as the numver of cycles is 5937th
Figure 17. Calculated wear depth of the specimen A as the number of cycles is 5937th
In the end of the validation procedure the obtained specific wear rate (k) for the contacting materials was 1.4·10-3 mm3/(Nm).
The obtained length of the trace was 483 μm and the width was 237 μm for the B part of the specimens which is quite comparable with the measured values in the Table 1. As it
can be seen in Fig. 16, the calculated wear depth is the same with the results of the surface profiler.
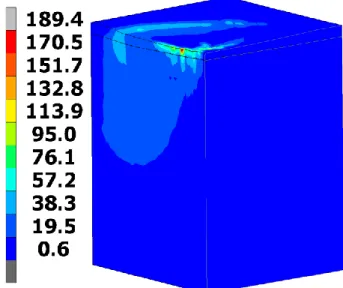
Structural analysis was carried out by the validated model. The changes of the distribution of the normal stress on the mating surface can be seen in Figs. 18-21. It can be seen that contact surface was increased and the structure of the distribution of the maximum normal stress changed significantly.
Figure 18. Normal stress distribution on the mating surface in the beginning of the wear process
Figure 19. Normal stress distribution on the mating surface in the 25th cycle
Figure 20. Normal stress distribution on the mating surface in the 5919th cycle
Figure 21. Normal stress distribution on the mating surface in the 5937th cycle
Figure 22. Von Mises stress distribution in specimen B in the beginning of the wear process
Figure 23. Von Mises stress distribution in specimen B in the 25th cycle
Figure 24. Von Mises stress distribution in specimen B in the 188th cycle
Figure 25. Von Mises stress distribution in specimen B in the 5919th cycle
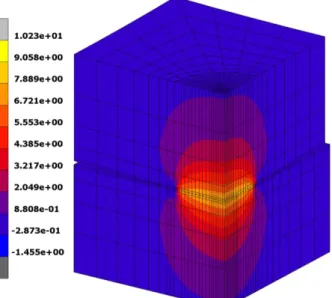
The changes of the distribution of the Von Mises stress inside of the specimen B can be seen in Figs. 22-26. In the beginning of the process, until 180th-200th cycle, the maximum of Von Mises stress locates under the mating surface inside of the body.
In case of the first cycles, the Von Mises stress reaches its maximum value below the mating surfaces of 25 μm which is much larger distance than the thickness of tin layer (Figs. 22-23).
However, in case of larger cycles, the maximum of the Von Mises stress moves to the mating surface (Figs. 24-26). This phenomenon accelerates the crack initiation and propagation in the surface layers, i.e. the contact fatigue, and tearing of small pieces out of the body.
Figure 26. Von Mises stress distribution in specimen B in the 5937th cycle
274 16th International Conference on Tribology - SERBIATRIB ‘19
Figure 27. Current density distribution in the beginning of the wear process
Figure 28. Current density distribution in the 5937th cycle
Figure 29. Current density distribution on the contact surface in the beginning of the wear
process
The electrical analysis can be seen in Figs.
27-29. It can be seen that in the wear stage of the lifetime, the area where the current flows between the two contact bodies is equal to the contact area. In the initial phase, the current density in this area is evenly distributed, only with the exception of a 9 μm band on the boundary (Fig. 29).
The thermal analysis showed that there is only 3 °C temperature rise in the experimental specimens which distribution is quasi- homogeneous, even with the consideration of the Joule and friction heat. This result coincides with the results of temperature measurements performed during the experiments.
5. CONCLUSION
In this work, a procedure was developed comprising of experimental and numerical calculation methods to analyse the ability of fretting corrosion failure of electrical connectors of cooling fans used in electrical cars.
In order to better understand of the contact conditions of the electrical connector, test specimens were made from material of the connector and carried out fretting experiments with them.
Lifetime curves similar to the short cycle fatigue strain-cycle diagram were determined by electrical resistance measurements during fretting tests. In these diagrams, amplitude- cycle relationships are determined in case of fixed parameters.
In our case, it was found that there was a value similar to the endurance limit in the case of amplitude, where practically endless life belongs to the value smaller than this limit.
The effect of the load force and the pre-aging on the lifetime curves were examined.
Lifetime was increased with increasing load, while aging was significantly reduced lifetime and amplitude limit for practically endless life.
In addition, the evolution of the fretting wear process was examined by measuring the sizes of the wear trace as a function of the number of cycles within a given lifetime. In our study, it was found that a 10-11 µm deep crater
was worn out quickly compared to the total lifetime, and then the corrosion of the resulting copper-copper contact surface led to the failure of the electrical connector. The fretting wear process takes place during the sixth life, and then no significant wear can be detected.
Numerical coupled FEM model was built that allowed us to carry out structural, wear, electrical, thermal analysis in the knowledge of the measured transition electrical resistance increase. The coupled model was validated using the measurements of crater size of the wear process and determined the specific wear rate for the particular case.
Structural analysis of the validation measurements was shown the change in the contact trace and movement of points of maximum of Von Mises stress from inside the body to the surface as fretting cycles increase, which accelerates contact fatigue and tearing out of small particles from the surface. It was found that after 3-4% of number of cycles of the fast-wear, the maximum Von Mises stress is already on the contact surface, accelerating the formation of debris.
Examining the distribution of the current density of the validation measurements, it was found that the size of the A-spot was the same as that of the contact area and was distributed quasi-uniformly on this area in the initial cycles.
The temperature analysis showed that 3 °C temperature increase in the test specimens occurred during the whole lifetime, confirmed by measurements.
Complementing of our examining procedure by the thermodynamic analysis of corrosion and metallurgical processes can be used to create a knowledge base for the contact conditions of the tested electrical connectors, which can be used to develop accelerated standardized lifetime tests for the electric car industry.
ACKNOWLEDGEMENT
This research was supported by Bilateral Serbian-Hungarian project TÉT_16-1-2016- 0164, the Bolyai Fellowship of the Hungarian Academy of Sciences, the únkp-18-4 new
national excellence program of the Ministry of Human Capacities and National Research, Development and Innovation Office - NKFIH, K115701 project, titled „Some selected problems in computational mechanics”
furthermore by the European Union and the Hungarian State, co-financed by the European Regional Development Fund in the framework of the the GINOP-2.2.1-15-2017-00090 project, titled „E-mobility from Miskolc:
Improvement of Coolant Pump and Engine Cooling Fan Taking into Account the Higher Quality Requirements in Electric Vehicles”.
REFERENCES
[1] J. Laporte, O. Perrinet, S. Fouvry: Prediction of the electrical contact resistance endurance of silver-plated coatings subject to fretting wear using a friction energy density approach, Wear, Vol. 330-333, pp. 170–181, 2015.
[2] X.Y. Ji, Y.P. Wu, B.H. Lu, V.C. Pascucci: Fretting corrosion degradation of non-noble metal coated contact surfaces: a theoretical model, Tribol. Int., Vol. 97, pp. 31–37, 2016.
[3] P. Jedrzejczyk, S. Chad, S. Fouvry, P.
Chalandon: Impact of the nickel interlayer on the electrical resistance of tin–tin interface submitted to fretting loading, Surf. Coat.
Technol., Vol. 203, pp. 1624–1628, 2009.
[4] W. Ren, P. Wang, Y. Fu, C. Pan, J. Song: Effects of temperature on fretting corrosion behaviors of gold-plated copper alloy electrical contacts, Tribol. Int., Vol. 83, pp. 1–
11, 2015.
[5] T.S.N.S. Narayanan, Y.W. Park, K.Y. Lee:
Fretting corrosion of lubricated tin plated copper alloy contacts: effect of temperature, Tribol. Int., Vol. 41, pp. 87–102, 2008.
[6] S. Hannel, S. Fouvry, Ph. Kapsa, L. Vincent: The fretting sliding transition as a criterion for electrical contact performance, Wear, Vol.
249, pp. 761–770, 2001.
[7] J.F. Archard: Contact and rubbing of flat surfaces, J. Appl. Phys., Vol. 24, pp. 981–
988, 1953.
[8] J.M.J. Challen, P.P.L.B. Oxley, B.S.B.
Hockenhull: Prediction of Archard's wear coefficient for metallic sliding friction assuming a low cycle fatigue wear mechanism, Wear, Vol. 111, No. 3, pp. 275–
288, 1986.
276 16th International Conference on Tribology - SERBIATRIB ‘19
[9] L. Rodriguez-Tembleque, R. Abascal, M.H.
Aliabadi: A boundary elements formulation for 3D fretting-wear problem, Eng. Analysis Bound. Elem., Vol. 35, pp. 935–943, 2011.
[10] I.R. McColl, J. Ding, S.B. Leen: Finite element simulation and experimental validation of fretting wear, Wear, Vol. 256, pp. 1114–
1127, 2004.
[11] J. Ding, I.R. McColl, S.B. Leen, P.H. Shipway: A finite element based approach to simulating the effects of debris on fretting wear. Wear, Vol. 263, pp. 481–491, 2007.
[12]P.H. Shipway, E.J. Williams, S.B. Leen, J.
Ding: A multi-scale model for fretting wear with oxidation-debris effects, Proc. Inst.
Mech. Eng. Part J, J. Eng. Tribol., Vol. 223, pp. 1019–1031, 2009.
[13] A. Cruzado, S. B. Leen, M. A. Urchegui, X.
Gómez: Finite element simulation of fretting wear and fatigue in thin steel wires, International Journal of Fatigue, Vol. 55, pp. 7- 21, 2013.
[14] N. Ohmae, T. Tzukizoe, Wear, Vol. 27 p. 281, 1974.
[15] P. Kennedy, L. Stallings, M. B. Peterson, ASLE Trans., Vol. 27, p. 305, 1984.
[16] S. Siiderberg, T. Colvin, K. Salama, 0. Vingsbo, J. Eng. Mater. Technol., Vol. 108, p. 153, 1986.
[17] S. Soderberg, U. Bryggman, T. McCullough, Wear, Vol. 110, p. 19, 1986.