Dissertationes Archaeologicae
ex Instituto Archaeologico
Universitatis de Rolando Eötvös nominatae Ser. 3. No. 5.
Budapest 2017
Dissertationes Archaeologicae ex Instituto Archaeologico Universitatis de Rolando Eötvös nominatae
Ser. 3. No. 5.
Editor-in-chief:
Dávid Bartus Editorial board:
László Bartosiewicz László Borhy Zoltán Czajlik
István Feld Gábor Kalla
Pál Raczky Miklós Szabó Tivadar Vida Technical editors:
Gábor Váczi Dávid Bartus
Proofreading:
Szilvia Szöllősi Zsófia Kondé
Available online at http://dissarch.elte.hu Contact: dissarch@btk.elte.hu
© Eötvös Loránd University, Institute of Archaeological Sciences Budapest 2017
Articles
András Füzesi – Norbert Faragó – Pál Raczky 7
Tiszaug-Railway-station. An archaic Middle Neolithic community on the Great Hungarian Plain
Zsuzsanna Siklósi – Zsuzsanna M. Virág – Viktória Mozgai – Bernadett Bajnóczi 67 The spread of the products and technology of metallurgy in the Carpathian Basin
between 5000 and 3000 BC – Current questions
Attila Király 83
Grd-i Tle knapped and ground stone artefacts, excavation seasons 2016–2017
Tamás Dezső 97
The arrowheads from Grd-i Tle (Rania Plain, Iraqi Kurdistan)
Bence Soós 113
Early Iron Age burials from Tihany, Hungary
Abdullah Bakr Othman 207
The Middle Assyrian Ceramics at Sheikhi Choli Tomb
Katalin Vandlik 241
Le renard dans les fables antiques et ses représentations
Lajos Juhász 251
Burning money – a coin hoard from Brigetio
Bence Simon 259
Physical landscape and settlement pattern dynamics around Aquincum and Carnuntum – A socio-economic approach
Anna Herbst – Ágnes Kolláth – Gábor Tomka 287
Beneath the Marketplaces. Árpádian Age (10th–13th century) settlement traces from the city centres of Pápa and Győr, Western Hungary
Field Reports
Zoltán Czajlik – Saša Kovačević – Georg Tiefengraber et al. 343 Report on magnetometer geophysical surveys conducted in Hungary, Austria and Croatia in the framework of the Interreg Iron Age Danube project
Tamás Dezső – Gábor Kalla – Barzan Baiz Ismail et al. 361 Preliminary Report on the Hungarian Archaeological Mission (Eötvös Loránd University) at Grd-i Tle (Saruchawa) in Iraq. Second Season (2017)
Márton Szilágyi – Kristóf Fülöp – Eszter Rákos – Nóra Szabó 393 Rescue excavations in the vicinity of Cserkeszőlő (Jász-Nagykun-Szolnok county, Hungary) in 2017
Dóra Hegyi – Gergely Szoboszlay 401
Short report on the excavations in the Castle of Sátoraljaújhely in 2017
Thesis Abstracts
András Rajna 413
Changes in Copper Age Networks of Connections in Light of the Material Excavated in the Danube-Tisza Interfluve
Anikó Bózsa 423
Instruments of beauty care from the Hungarian part of Pannonia
Zsolt Körösfői 439
Die Marosszentanna-Kultur in Siebenbürgen
around Aquincum and Carnuntum
A socio-economic approach
1Bence Simon
Institute of Archaeological Sciences Eötvös Loránd University
simonben.c@gmail.com
Abstract
Roman rural settlement is believed to be driven by the need to exploit natural resources to produce an ag- ricultural surplus to the market. As with all human settlement, this task is also limited by the surrounding physical and cultural landscape. In Roman Pannonia two prominent towns, Carnuntum (Deutsch-Altenburg/
Petronell, Austria) and Aquincum (Budapest, Hungary) were not only the capital cities of Upper and Lower Pannonia after the beginning of the 2nd century, but they were both garrisoned by a legion. In Roman frontier economies, such towns and military garrisons were the main places of agricultural surplus consumption, trading and industrial production. Our present study examines the regional settlement locations around these urban and military centres to outline how they adapted to the landscape and the pressure for surplus produc- tion. In the hinterland of Aquincum the network of Roman villages is also compared to that of the pre-Roman era to define long-term changes.
Ita enim salubritas, quae ducitur e caelo ac terra, non est in nostra potestate, sed in naturae, ut tamen multum sit in nobis, quo graviora quae sunt ea diligentia leviora facere possimus.
Varro, rust. 1.4.4.
Roman settlement, economy and landscape
Landscapes are heterogenous physical and cultural entities containing vast information about the economic and social behaviour of past societies.2 It is a clear assumption that settlement locations were consciously chosen by settlers. We can make these decisions visible only with a landscape archaeological approach. In Roman times, the inhabitants of towns and military garrisons were not self-sufficient. Their agricultural hinterland3 supplied them with most of their daily needs.4 This rural sector was also socially and economically highly integrated into
1 The present study is part of my doctoral research at Eötvös Loránd University, Budapest, Hungary with the title: “Aquincum és Brigetio mezőgazdasági hátországa és a katonaság ellátásának lokális rendszere. The agricultural hinterland of Aquincum and Brigetio and the local system of the army supply”. Hereby I would like to express my gratitude to my director of studies, Prof. László Borhy who assists me through my studies and Eli Weaverdyck for his comments and advices.
2 Smith 2014.
3 Hinterland studies were introduced by British schools engaged in mapping the rural areas economically tied to ancient towns using non-invasive techniques for identifying archaeological sites (field surveys, aerial archaeological photography, geophysical surveys, etc.), with an emphasis on archaeological topographical methods. Bintliff et al. 2007; Gaffney et al. 2007.
4 On the intertwined economic relation between a Roman city (or a military related settlement: camp, cana- bae, vicus) and its hinterland see: Erdkamp 2001; This complicated economy is also attested on the northern frontier at Vindolanda: Evers 2011.
Roman life: taxes had to be paid and there was also their effort to live as a Roman. In relation to this we can assume that the landscape somehow bears the traces of their endeavour to satisfy these needs.
Spatial analysis on the regional level can show overall changes in settlement pattern and past preferences towards various affordances in the landscape.5 To determine what was considered important for a farmer living in ancient times requires a careful interpretation of literary sources. The other problem is the human qualitative perception of the landscape.6 We cannot completely reconstruct this, but the landscape features in this study did and still shape human decisions and they are quantifiable and thus available for statistical analysis. In Roman ar- chaeology, the study of interaction between landscape, human settling and economy became widespread with the advance of GIS. Most of these studies analysed the socio-economic land- scape along different approaches in the hinterland of a town or the line of military garrisons.7 The present study can be listed among these research projects.
5 On the history and methods of spatial analysis in archaeology see: Verhagen 2018.
6 Goodchild 2013, 63–66.
7 Some team projects (Arhcaeomedes, ArchaeDyn) tried to develop the hierarchical classification and recon- struct the dynamics and economic relations of archaeological settlements and their territories through time in the South of France: Gandini et al. 2012. The interaction between paleo-environment and settlement was under investigation in the Dutch Roman limes: Kooistra et al. 2013; van Dinter et al. 2014. Set- tlement patterns were also analysed with the assistance of GIS in doctoral dissertations. The hinterland of Rome: Goodchild 2007; Town hinterlands in Boeotia: Farinetti 2009; Roman settlements north of Lake Balaton, Hungary: Firnigl 2012; The hinterland of Köln, Germany: Jeneson 2013; The hinterland of the Moesian limes: Weaverdyck 2016.
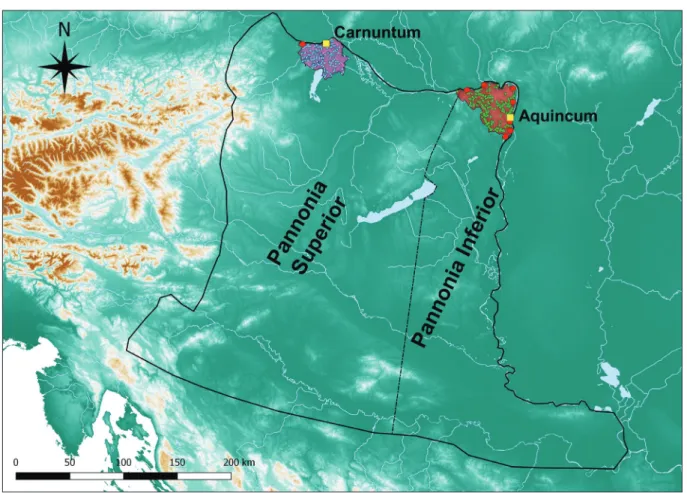
Fig. 1. Study areas in the Roman provinces of Pannonia Inferior and Superior.
Study area
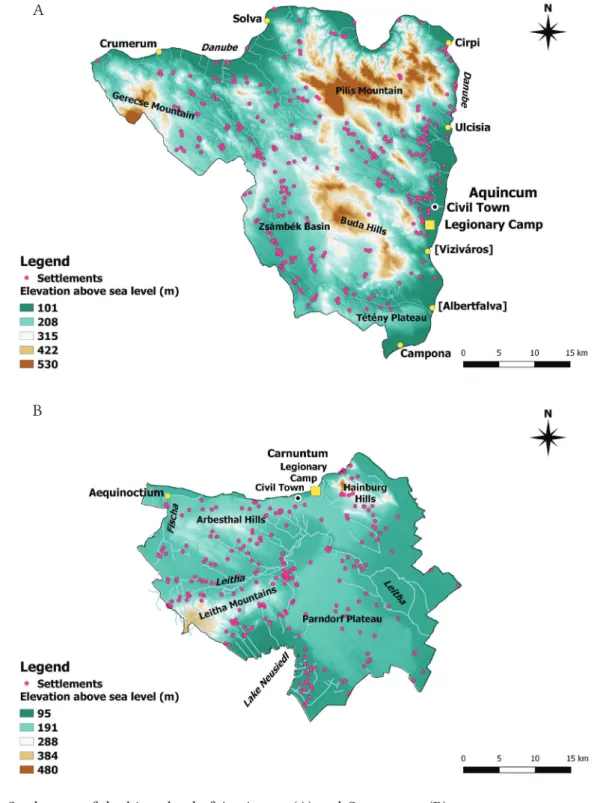
The study areas of my present paper include the north-eastern part of the ancient province of Pannonia Inferior now situated on the modern territory of Hungary and the north-western part of Pannonia Superior in Austria (Fig. 1). The borders themselves align with the bounda- ries of modern administrative districts so they do not reflect historic circumstances. The study area in Hungary is geographically more diverse (Fig. 2, A). The area is bordered by the Danube to the north and east, the Tétényi Plateau to the south and the Gerecse Mountain to the west.
The higher part of the region in the east consists of two mountains, the Pilis and Buda, while the lowest and most fertile part is the Zsámbék Basin to the west. The north-western part and the area between the Pilis and Buda Hills is crossed by numerous valleys, creating a hilly and divers terrain. The border of the study area in Austria is the Danube to the north, the national border to the east, Lake Neusiedler to the south, and the Fischa to the west (Fig. 2, B). The area is divided by the Leitha, which flows past the Leitha Mountains and runs into the Danube to the east. The gentle slopes of the Arbesthal hill country are situated to the west of Carnuntum, on the right bank of the Danube. Similarly, the Hainburg Hills rise next to the Danube, form- ing the area of highest relief in the region aside from the Leitha Mountains. The southeast of the area is dominated by the windy Parndorf Plain.
Database and methods
The results of landscape archaeological analysis are greatly affected by the databases on which they are based, so it is necessary to introduce our sources. To study the hinterland of Aquin- cum I built a database combining information from field-walking, excavation and literary sources. I could also use the data from official Hungarian national archaeological site register,8 which is mainly based on the systematic Hungarian Archaeological Topography Program started in the 1960’s.9 In the database there are 294 Roman settlements that did not develop next to a military site (camp, watchtower etc.). To study the interactions between settlement and landscape over the long term, 176 pre-Roman, “Celtic” sites were also documented in the territory of Aquincum.10 In the database of the hinterland of Carnuntum I recorded 237 settlement sites based on information from the annually published Austrian archaeological reports and literary sources dating back to the 19th century, which was supplemented with data gathered from the georeferenced map of H. Zabehliczky11 and the most recent publica- tion summing up the settlement traces in the hinterland of Carnuntum.12
To study rural settlement, I employed zonal statistical analyses on two spatial scales to make human choices visible.13 Although statistics are mathematically precise, data must be correctly handled and selected for calculations. I used a DEM with a 10×10 m pixel reso-
8 I hereby say thanks for the assistance of Rita Csákvári former director of the Registration Office at the For- ster Gyula National Heritage and Asset Management Centre providing me the actual national archaeological record in November 2016.
9 On the history of topographical data collection and its institutional organisation in Hungary see: Bondnár 2017. Results of the archaeological topography program in county Pest and Komárom-Esztergom see: Hor- váth et al. 1979; Dinnyés et al. 1986.
10 The pre-Roman database contains only rough data, obtained from the national site register. Cf. note 8.
11 Zabehliczky 2006, 355, Abb. 1.
12 Ployer 2015, Abb. 1.
13 I used a free statistical software, Past 3.18 available to download from: https://folk.uio.no/ohammer/past/
lution in both areas,14 from which slope, aspect and sun exposure were calculated. To cre- ate the soil and river systems, I combined information from maps handed over to me for scientific purposes and digitized data from publicly accessible databases.15 With these maps I made zonal calculations on the level of the actual settlements and on the supposed level of intensive agricultural cultivation.
14 To study the hinterland of Aquincum I used a DEM generated from contours of national cadastre maps.
The DEM for Carnuntum is publicly accessible from: https://www.data.gv.at/katalog/dataset/dgm/resource/
b347b029-3fd5-448a-8c2c-07f483c2c56e
15 Both soil and river system maps will be discussed in respective chapters.
Fig. 2. Study area of the hinterland of Aquincum (A) and Carnuntum (B).
A
B
My two samples for the zonal analysis were the frequency of settlement locations falling within each class16 and an expected number calculated from the portions of classes and the sum of settlements. Human selection of landscape features can be observed by finding statistically significant differences between settlement locations and the expected numbers.
At the scale of the actual settlements (200 m radius), I used a chi square test on goodness of fit to identify landscape features that played significant role in choosing settlement lo- cations, a common method among landscape studies.17 All landscape features were catego- rized into classes where the number of the settlements was recorded. This distribution was tested against the number of random points per classes. As information was not sufficient to correctly date the sites around Carnuntum, this area was studied only on the level of settlement.
Agriculture, the cultivation of various crops can be viewed as a complex system in which any person, who is an active partaker tries to minimize his energy to complete any tasks.
Landscape is the space which defined the options of a farmer. As travelling requires time and energy, it has been observed that pre-industrial intensive farming was not far from the village itself. With this understanding, we can assume that landscape preserved in the network of settlements traces of ancient economic behaviour. In his study M. Chisholm found that intensive cultivation extended to between 1 to 2 km distance from the settle- ments, while extensive agricultural works were performed up to 5 km away.18 As we cannot reconstruct the territory of any settlements in the hinterland of Aquincum I used a circle with a radius of one Roman mile (1481 m) to represent the supposed territory available for intensive farming. E. Weaverdyck used this method regarding Northern-Bulgarian Roman settlement with promising results so I found it useful to adopt his methods along with his view on treating settlements as places. The environment where an agent’s practical opera- tions (including sleeping) were performed consist of many but not undifferentiated places.
Settlements as places can be viewed as one of the most important part of the “taskscape”, but they are not the “taskscape” itself.19 Recorded archaeological sites do not reflect the economic reality of the past in a straightforward way. This can be easily understood when three sites divided by a stream are in the immediate neighbourhood of each other with the same chronological horizon (Fig. 3). As settlement structure was loose in Roman times, they must have formed only one economic unit, one place, where everyday tasks were per- formed. Based on the excavations uncovering villas around Aquincum, I joined sites with the same date that were not more than 500 m apart from each other.20
16 Sites were analysed as polygon centroids (point features).
17 Similar method was applied in: Goodchild 2007; Jeneson 2013; Weaverdyck 2016; The conditions of chi square test – random sampling, classes (categories) with counts, minimum frequency in each cell is at least 5 – were met.
18 Chisholm 1979, 33–62, 94–105. F. Bertoncello and L. Nuninger with the aid of archaeological finds the- oretically reconstructed the “permanent agricultural zones” in the South-East of France. They used the same maximum distance (1500 m radius) in selecting the manuring zones for settlements. Bertoncello – Nuninger 2010, 143, Fig. 6.
19 On viewing the landscape as a “taskscape” see: Weaverdyck 2016, 24–25. Citing: Ingold 1993, 162.
20 Cf. Weaverdyck 2016, 113. A 250 m buffer was generated around all settlement points and if they touched another buffer or the polygon of a site, they were joined. In the immediate neighbourhood of Aquincum based on the network of rural villas was thick, they were nearly 500 m far from each other. Láng 2009, 84;
On map see: Havas 2011, fig. 12: no. 3. – “Csúcshegyi villa” – “Testvérhegyi villa”. The villa landscape on the modern territory of Budapest was looser than this, with a 1–2 km gap between them. Zsidi 1991, 152.
As discussed above, when intensive cultivation was prevalent in the landscape, settlement territories would expect to be different from random ones. I used the same classes of landscape features as on the previous level and two statistical analyses were applied to the zones in ques- tion. With the unequal variances t-test (Welch’s test) the mean values of settlement zones with random zones were compared.21 As normality cannot be always guaranteed for parametric tests, I used the non-parametric Kolmogorov-Smirnov test to verify that the two samples are really from a different population.22 The t-test could also demonstrate the direction of connec- tion with various classes of landscape features i.e. positive or negative attitude towards them.
This kind of t-test has the advantage against z-test (or u-test) that it is not necessary to know the hypothetical standard deviation of the two populations.23 The hinterland of Aquincum produced more information about the date of settlements making it also possible not only to assess the Roman Age as a whole, but to detect some other tendencies throughout Roman rule.
Roman landscape on the level of settlement Landscape features
24Elevation
Roman agronomists commonly allude to the well-known fact, that the cultivation of certain crops highly depends on the relief of terrain. Varro distinguishes four types of land (ager):
plain (ager campestre), hilly (ager collinus), mountainous (ager montanus) and the mixture of
21 Welch’s t test enables us compare samples even when their variances are different, which has been the case in many occasions during my statistical calculations. On the mathematical background of the statistical tests, see: https://folk.uio.no/ohammer/past/past3manual.pdf
22 Same method has been used by Eli Weaverdyck in his dissertation. Weaverdyck 2016, 131–132.
23 On the advantages of Welch’s t-test see: Ruxton 2006; Delacre et al. 2017.
24 Landscape features were selected in relation to Roman agronomists’ recommendations as it will be dis- cussed at each feature.
Fig. 3. Joined sites of one chronological horizon in Epöl. Green dot represents the place.
the three (ex iis tribus). He differentiates these regarding their cultivation and their climate.25 It is not a coincidence, as elevation determines agricultural works – temperature changes with shifting altitude affecting precipitation, mean annual temperature and humidity.26
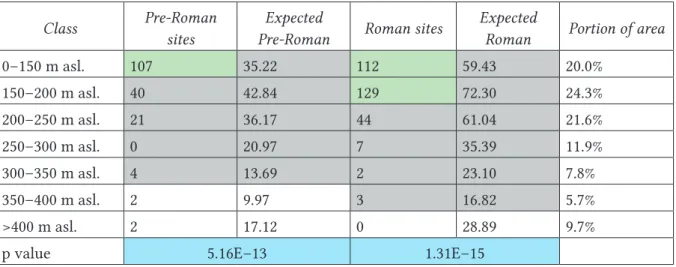
Class Pre-Roman
sites
Expected
Pre-Roman Roman sites Expected
Roman Portion of area
0–150 m asl. 107 35.22 112 59.43 20.0%
150–200 m asl. 40 42.84 129 72.30 24.3%
200–250 m asl. 21 36.17 44 61.04 21.6%
250–300 m asl. 0 20.97 7 35.39 11.9%
300–350 m asl. 4 13.69 2 23.10 7.8%
350–400 m asl. 2 9.97 3 16.82 5.7%
>400 m asl. 2 17.12 0 28.89 9.7%
p value 5.16E–13 1.31E–15
Tab. 1. Chi square test on elevation around Aquincum.
Class Roman sites Expected Roman Portion of area
0–150 m asl. 62 76.77 32.4%
150–200 m asl. 148 128.38 54.2%
200–250 m asl. 22 20.22 8.5%
250–300 m asl. 5 6.96 2.9%
300–350 m asl. 0 2.70 1.1%
350–400 m asl. 0 1.71 0.7%
>400 m asl. 0 0.27 0.1%
p value 0.287
Tab. 2. Chi square test on elevation around Carnuntum.
To study human preferences, 7 classes were created. The lowest was from the lowest altitude of both landscapes to 150 m above sea level and the last class was from 400 m to the highest point. The chi square test produced convincing results regarding settlement habits in the hinterland of Aquincum but not in Carnuntum’s (Tab. 1–2). Most of the settlements were between a height of 0 and 200 m in in the former area and no Roman settlements could be observed above 400 m.27 It is also noteworthy to mention that this result can also be the cause of bias in field surveys as higher grounds tend to be covered with forests where the traditional archaeological data collection faces many difficulties (Fig. 4). Despite this, results correspond to other studies of Roman settlement in the hinterland of Rome, Köln and north of the Lake
25 Varro, rust. 1.6.2, 5.
26 Human settlements in Hungary are present in the lowest parts of the Earth’s atmosphere i.e. troposphere.
In this atmospheric section with increasing altitude, temperature decreases. Jacobson 2005, 24–26, fig. 2.4.;
Altitude also influence cloud development causing precipitation. Jacobson 2005, 606–607; Fig. 18.5.
27 This height was also a natural boundary for Roman sites on Brač Island. Stančič – Veljanovski 2000, 152.
Balaton in our province.28 Pre-Roman and Roman sites preferred the lowest segment of the landscape and they have shown close similarities. The terrain around Carnuntum is some- what lower, therefore differences could not be statistically detected.
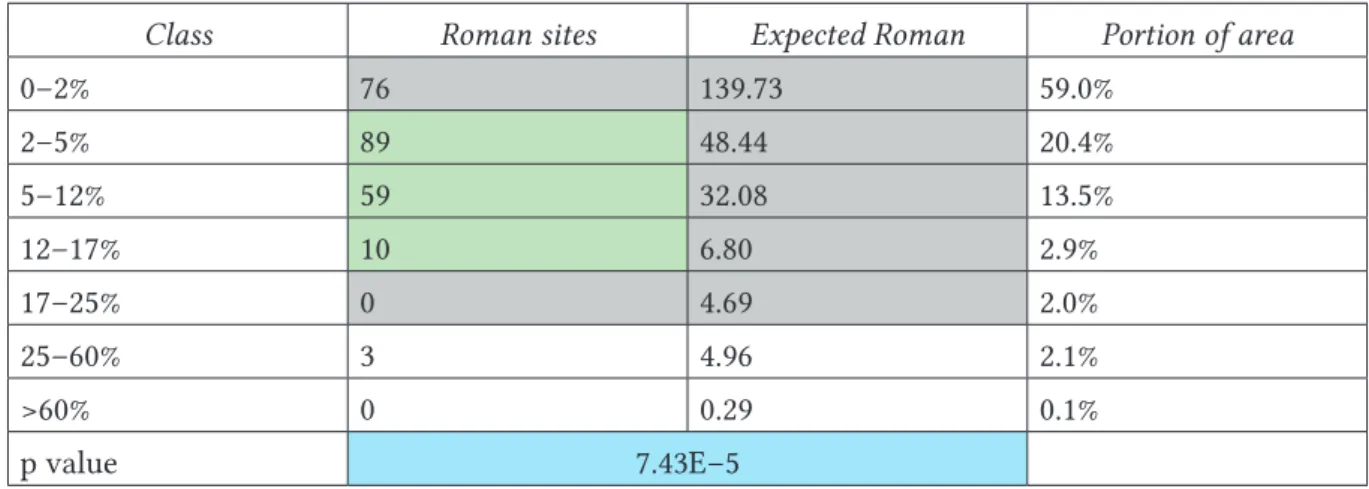
Slope class
Roman farmers were aware of the slope of terrain. Hills and moderately sloping, nearly flat areas were suitable for grain cultivation – plains were used as arable land (arvum), grazing land (pratum), willow grove (salicetum) or reed thicket (harundinetum),29 but even they (cam- pi) should have had some slope or ditches dug to prevent water from stagnating.30 We cannot reconstruct what was considered moderate or steep slope for the ancients, therefore I used the Hungarian Soil Science Society’s recommendation for slope gradient classes.31 Around Aquin- cum pre-Roman settlements tended to be established on land with a gradient of less than 12%
and mostly chose an inclination between 2% and 5% (Tab. 3–4). This was also true of Roman sites around Aquincum and Carnuntum, but in the hinterland of the latter nearly flat areas (0–2%) were avoided. All samples under investigation proved to be statistically significant.
This result can be compared to the studies of H. Goodchild and E. Weaverdyck who came to the same conclusion, that the lowest grades were not so densely populated, gently sloping land was considered the best for agricultural practices.32
28 Goodchild 2007, 123–125; Jeneson 2013, 186–191; Firnigl 2012, 85–87.
29 Colum. 1.2.3–4.
30 Colum. 2.2.1; Colum. 2.16.5.; The necessity of a moderate slope is also recognized in Varro, rust. I.6.6.
31 http://cms.talaj.hu/wp-content/uploads/2016/09/Geomorfologia.pdf (downloaded: 2:10 PM, 03.11.2016) 32 Weaverdyck 2016, 132–134; Goodchild 2007, 126–132. Comparing modern and ancient rural sites the dif-
ference between practices is obvious: Goodchild 2007, 131, Fig. 4.2.
Fig. 4. Relation of registered Roman sites and forests in the hinterland of Aquincum.
Class Pre-Roman sites
Expected
Pre-Roman Roman sites Expected
Roman Portion of area
0–2% 39 29.52 55 49.81 16.8%
2–5% 55 28.11 139 47.44 16.0%
5–12% 50 47.60 101 80.33 27.0%
12–17% 13 22.94 2 38.72 13.0%
17–25% 11 22.13 0 37.34 12.6%
25–60% 8 24.73 0 41.74 14.1%
>60% 0 0.96 0 1.63 0.5%
p value 1.91E–4 7.47E–20
Tab. 3. Chi square test on slope around Aquincum.
Class Roman sites Expected Roman Portion of area
0–2% 76 139.73 59.0%
2–5% 89 48.44 20.4%
5–12% 59 32.08 13.5%
12–17% 10 6.80 2.9%
17–25% 0 4.69 2.0%
25–60% 3 4.96 2.1%
>60% 0 0.29 0.1%
p value 7.43E–5
Tab. 4. Chi square test on slope around Carnuntum.
Soil
Soil was the most important natural resource for the Roman agronomists, as they noted when writing about sowing and harvesting.33 Unfortunately ancient soil categories are not compatible with present soil sciences34 and moreover, several types of erosion, leaching and human land-use influence the stability, fertility and potential of different soils. Soils can change over a brief period depending on local topography. Steep slopes and low lands adja- cent to great or even minor waters are exposed to serious changes through time.35 Despite these environmental and human impacts the geological parent material and the topsoil are closely related through the process of soil genesis.36 Therefore it is useful to study the rela- tion between present soils and the ancient settlement pattern. 37
33 The productivity of a sown seed was the result of the locality and the type of soil it was planted in. Varro, rust. 1.44.1–2.
34 Weaverdyck 2016, 142.
35 Holliday 2004, 234–235.; Soil formation takes much more time, than soil deposition, which can rapidly happen in various landscapes exposed to erosion or aggradation. Holliday 2004, 141–142. Case study on physical soil erosion see: Farsang et al. 2012; Case study on historical human impact on soil erosion see:
Jordán et al. 2015.
36 Holliday 2004, 43, Fig. 3.1.; Farinetti 2009, 19–20.
37 Loess soils in Germania Inferior determined the development of a villa-landscape. Roymans – Derks
Class Pre-Roman sites
Expected
Pre-Roman Roman sites Expected
Roman Portion of area
Ideal 87 72.50 204 122.35 41.2%
Suitable 15 16.65 27 28.09 9.5%
Unsuitable 14 16.01 34 27.02 9.1%
No data 60 70.84 32 119.54 40.2%
p value 5.05E–1 1.97E–15
Tab. 5. Chi square test on soil around Aquincum.
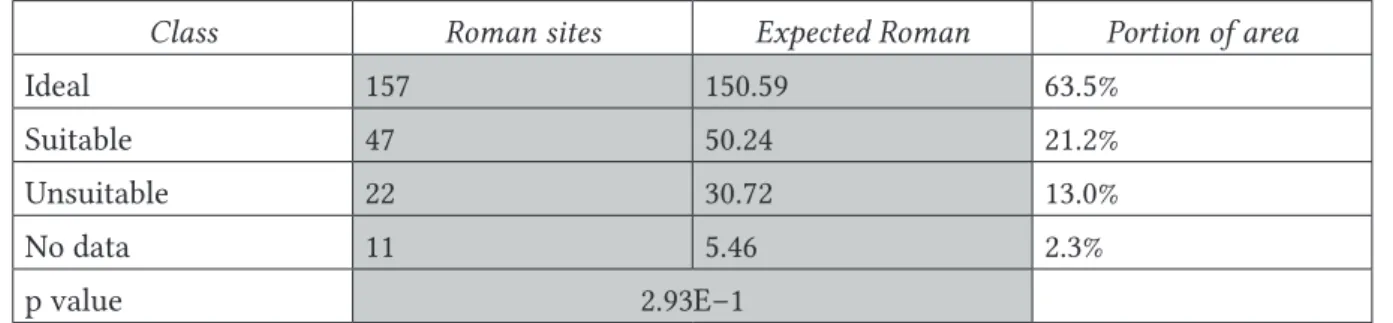
Class Roman sites Expected Roman Portion of area
Ideal 157 150.59 63.5%
Suitable 47 50.24 21.2%
Unsuitable 22 30.72 13.0%
No data 11 5.46 2.3%
p value 2.93E–1
Tab. 6. Chi square test on soil around Carnuntum.
I found contemporary arable land values to be useful in modelling ancient agricultural preferences as not only the soil-type, but its thickness and other features are generally con- sidered during evaluation.38 For my studies I created four classes to study soils regarding cultivation: ideal, suitable, unsuitable and no data, where information was lacking because of modern settlements or forests. The classification and my maps were generated with the assistance of the free 1×1 km resolution digital soil map of Austria39 and the Digital Krey- big Soil Information System database.40 Despite its previously anticipated importance, the chi square statistical analysis has shown that soil did not influence pre-Roman settlement around Aquincum and Roman settlement around Carnuntum. Roman settlements in the hinterland of Aquincum on the other hand were established where soils were ideal and they did not avoid unsuitable ones either (Tab. 5–6). Many villages were formed along the main regional road connecting Aquincum and Crumerum (Diagonal Road), which runs through higher grounds and unsuitable, sallow soils between the Buda Hills and Pilis Mountains.
Therefore the observed dichotomy is the result of the preference for good soils and neigh- bourhood of a road connecting the farm with markets.41
2011, 3, Fig. 1; In county Somogy, Hungary it was observed that late La Tène and Roman settlements are present on Chernozem soils next to streams. Fekete et al. 2005, 101; Same conclusion was drawn be- tween soils and settlement pattern north of Lake Balaton, Hungary. Firnigl 2012, 96–97.
38 Based on the same consideration, lands have been evaluated in the Boeotian region, Greece. Farinetti 2009, 25, Tab. 2–3; On land evaluation methods in Hungary see: Juhos 2014; On current land evaluation in Austria see: http://www.bev.gv.at/pls/portal/docs/PAGE/BEV_PORTAL_CONTENT_ALLGEMEIN/0200_PRODUKTE/
PDF/ALLGEMEINE_INFORMATION_UEBER_DIE_FINANZBODENSCHAETZUNG_STAND_20150908.PDF 39 Downloaded from: https://bfw.ac.at/rz/bfwcms2.web?dok=8548 (October 2016).
40 I hereby say thanks to László Pásztor (MTA ATK TAKI) for handing over the database for my studies. Pász- tor et al. 2010; Pásztor et al. 2012; The soil layers of the Kreybig database were augmented with the land values publicly available from the Agrotopo database making it available for classification. (http://www.
enfo.hu/gis/korinfo/).
41 Varro, rust. 1.16; Cato, Agr. 1.3; Colum. 1.2.3.
Aspect
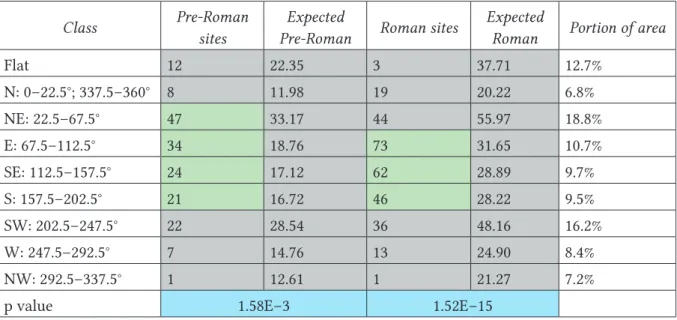
The aspect of the land was probably the second most important factor for Roman farmers besides soil. Aspect affects the duration of direct sunlight, but recent studies have shown, that aspect can be best interpreted in relation to main wind directions in a Roman landscape.42 This duality can be also attested in ancient agronomist works – they considered south and east facing slopes the best for cultivation,43 but windy places had to be avoided as it threatened wheat and barley alike.44
Class Pre-Roman
sites
Expected
Pre-Roman Roman sites Expected
Roman Portion of area
Flat 12 22.35 3 37.71 12.7%
N: 0–22.5°; 337.5–360° 8 11.98 19 20.22 6.8%
NE: 22.5–67.5° 47 33.17 44 55.97 18.8%
E: 67.5–112.5° 34 18.76 73 31.65 10.7%
SE: 112.5–157.5° 24 17.12 62 28.89 9.7%
S: 157.5–202.5° 21 16.72 46 28.22 9.5%
SW: 202.5–247.5° 22 28.54 36 48.16 16.2%
W: 247.5–292.5° 7 14.76 13 24.90 8.4%
NW: 292.5–337.5° 1 12.61 1 21.27 7.2%
p value 1.58E–3 1.52E–15
Tab. 7. Chi square test on aspect around Aquincum.
“Celtic” sites in the North-Eastern Dunántúl were mostly on the north-eastern to the south side of the slopes (Tab. 7–8). This way they could avoid intense north-western winds which is the most general wind direction in the area.45 In the territory of Carnuntum, Roman farmers favoured south-east to west facing lands as they were not exposed to the local north-west, south-east wind corridor and received more sunlight.46 Statistical analysis showed that villag- es were established on the eastern to the south side of slopes around Aquincum as it is was recommended by Varro, Cato and Columella. This way they were protected from winds and received much sunlight.
Sun exposure
Sunlight has probably the greatest effect on local climate. It enables cultivated crops to devel- op and grow, determines average daily temperature and the wetness of the land. The second part of the vegetative cycle of the winter wheat’s growth, when the plant is the most sensitive to weather conditions falls between the end of April and the end of May in Hungary.47 This is
42 Goodchild 2007, 133–140; Weaverdyck 2016, 137–140.
43 Varro, rust. 1.39.1., 1.12.1; Cato, Agr. 1.3; Colum. 1.2.3.
44 Thphr. HP 8.10.3; Besides common crops, Latin authors mention vines and olives in relation to winds. (Cato, Agr. 6.2; Colum. 3.12.6).
45 Radics et al. 2002, 1993, Fig. 3; http://www.met.hu/eghajlat/magyarorszag_eghajlata/altalanos_eghajla- ti_jellemzes/szel/images/abra1.png
46 Kumer et al. 2016, 903, Fig. 6.a.
47 Varga-Haszonits – Varga 2013, Tab. 1.
the time for shooting, heading and flowering, the crucial time to develop a good crop. Planting wheat in a sunny place was also recommended by ancient authors.48
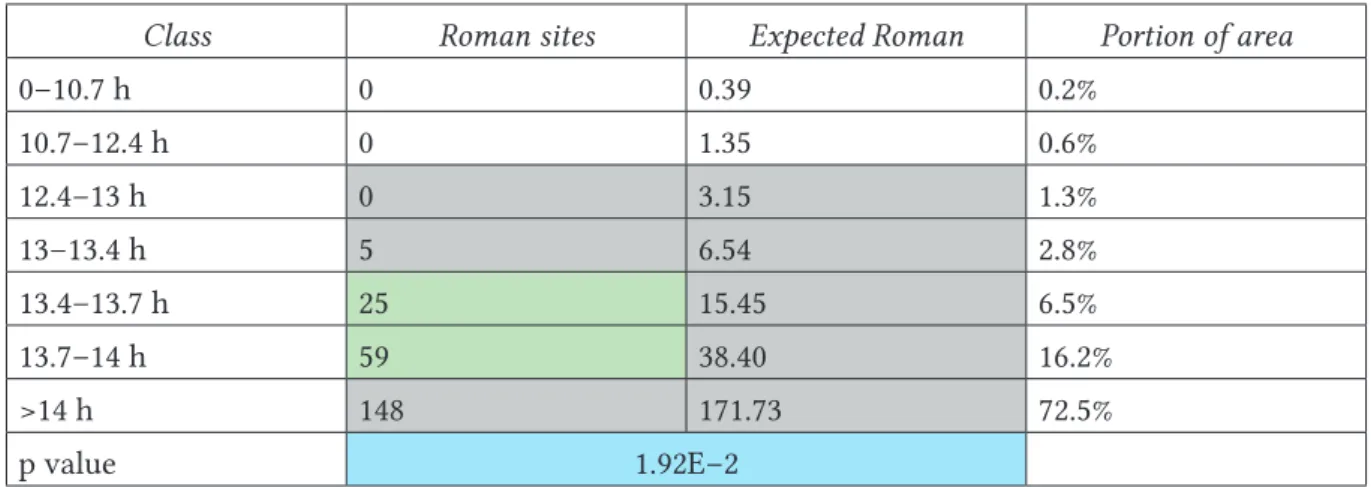
In the geographical regions in question, there were slightly fewer sunny hours in April and May than in Northern Bulgaria, but they still exceeded 12 hours in some regions (Tab. 9–10).
The chi square test enabled us to reject all null hypotheses on each studied sample. Both “Celtic”
and Roman sites tended to be in the sunniest places around Aquincum. In the hinterland of Carnuntum, Roman sites avoided lands with longest sunny hours like the Parndorf Plain, which has nearly no slope and is exposed to heavy storms and frequent winds.49
Class Roman sites Expected Roman Portion of area
Flat 0 0.09 0%
N: 0–22.5°; 337.5–360° 0 28.62 12.1%
NE: 22.5–67.5° 3 34.65 14.6%
E: 67.5–112.5° 20 32.98 13.9%
SE: 112.5–157.5° 74 32.50 13.7%
S: 157.5–202.5° 70 38.50 16.2%
SW: 202.5–247.5° 43 28.46 12.0%
W: 247.5–292.5° 22 19.86 8.4%
NW: 292.5–337.5° 5 21.34 9.0%
p value 7.02E–18
Tab. 8. Chi square test on aspect around Carnuntum.
Water supply
Water is the most basic natural resource for life: it is essential to humans, animals and plants likewise, so it was probably one of the key factors in choosing settlement location.50 Rainfall in our area must have been sufficient for growing winter wheat,51 with serious crop loss only occurring in years of drought. Accordingly, the study of the river system of the area around Aquincum and Carnuntum provides information about animal and human water needs and water supply is only investigated on the level of settlement and not in subsequent chapters.
It is difficult to reconstruct ancient surface waters much more riverbeds in the Roman Age,52 but we can assume that smaller streams did not leave the confines of their present valleys.
The river system map in the hinterland of Aquincum was created by the manual digitalisation of waters depicted on national cadastral maps and the one of Carnuntum using the OpenLay- ers Plugin of QGIS.53 Without any quantification, results were roughly verified with a flow
48 Cato, agr. 34.2–35,1; Colum. 9.2.3.
49 The hinterland of Carnuntum was mostly flat, therefore to detect some more detailed preferences the seven sun- light duration classes were created through the reclassification of the solar radiation map along natural breaks.
50 Vitr. De architectura, 8.1.1.; Colum. 1.3.4–5.
51 Cf. Average soil moisture is ideal for wheat during its growth season, as it rarely drops below 20% of bene- ficial moisture: Varga-Haszonits – Varga 2013, 14, Fig. 3.
52 Recent material on the riverbed evolution of the Leitha river see: Zámolyi et al. 2015. On the immediate Roman Age area of Aquincum (Budapest, Hungary) see: Schweitzer – Kérdő 2014.
53 https://plugins.qgis.org/plugins/openlayers_plugin/
accumulation map generated from the 10×10 m DEMs.54 The hinterland of Carnuntum as previously mentioned is far flatter, than Aquincum’s. Because of this, surface waters are not so frequent and the landscape is dominated by the Leitha river. Around Aquincum small and medium streams in their deepened valleys are the most common surface waters, all running into the Danube.
Class Pre-Roman
sites
Expected
Pre-Roman Roman sites Expected
Roman Portion of area
0–9 h 0 0.38 0 0.65 0.2%
9–10 h 0 1.55 0 2.61 0.9%
10–11 h 4 8.73 1 14.73 5.0%
11–11.5 h 2 13.79 7 23.27 7.8%
11.5–12 h 14 30.07 30 50.74 17.1%
12–12.5 h 70 60.99 154 102.92 34.7%
12.5 > h 86 60.49 105 102.08 34.4%
p value 3.89E–4 3.94E–7
Tab. 9. Chi square test on direct sunlight duration around Aquincum.
Class Roman sites Expected Roman Portion of area
0–10.7 h 0 0.39 0.2%
10.7–12.4 h 0 1.35 0.6%
12.4–13 h 0 3.15 1.3%
13–13.4 h 5 6.54 2.8%
13.4–13.7 h 25 15.45 6.5%
13.7–14 h 59 38.40 16.2%
>14 h 148 171.73 72.5%
p value 1.92E–2
Tab. 10. Chi square test on direct sunlight duration around Carnuntum.
To measure distance from rivers, buffers at 500 m, 1000 m and 1500 m were generated, then the number of sites in each of the zone was recorded. Their number was compared to random sites per classes55 with a chi square test (Tab. 11–12). More than half of the “Celtic” settlements can be found close to waters, but nearly one-third of them are farther than 1500 m. As it was not possible to reconstruct the riverbed of the Danube I excluded it from my analysis, which produced the seemingly distant settlements. Pre-Roman sites were frequent on the bank of the Danube, where limes garrisons were situated in the Roman Age. Most of the settlements
54 http://pro.arcgis.com/en/pro-app/tool-reference/spatial-analyst/how-flow-accumulation-works.htm
55 Classes: 200-500 m; 500-1000 m; 1000-1500; >1500 m. As it was not possible to calculate an area, portions were calculated from 1000 randomly distributed points. Points were distributed with ArcGIS ‘Create Ran- dom Points’ tool: http://pro.arcgis.com/en/pro-app/tool-reference/data-management/create-random-points.
htm.
(89%) around Aquincum were established within 500 m of surface waters, meaning a five- minute-long walk. In the hinterland of Carnuntum, as fewer streams are present and the terrain is gentler, Roman sites were further from water, but still 77% of them were in the 1000 m neighbourhood of streams.
Results
Settlement tendencies observed in the hinterland of Aquincum and Carnuntum highlighted that preferences did not change significantly between the pre-Roman and Roman Age. “Celt- ic” settlements around Aquincum were established on low lying, almost flat, sunny lands, near the Danube or close to waters, where the main winds did not threaten them. Roman farmers chose somewhat higher and more sloping, but still sunny grounds. Their settlements populated most of the landscape and show a close connection with the advice given by an- cient authors.
Roman landscape on the economic level
Eras of the Roman Age in North-Eastern Pannonia
To detect diachronic trends I included pre-Roman “Celtic” sites56 in my investigation and I dated Roman sites to more specific periods (Fig. 5). This was mostly based on topographic surveys (i.e. volumes of Magyar Régészeti Topográfiája) augmented with reports and other publications. Three different eras could be clearly distinguished. The first one is from the Roman occupation (mid-first century AD) to the time of the Marcomannic-Sarmatian wars (166 AD), which was the time of economic and social stability in the region. The second phase is dominated by the Severan dynasty, which was a flourishing epoch in the province with a re-established and broadened economic network and a possibly changing population in the cities and in the countryside.57 This period ends in the mid-third century, around the 250’s AD, when the cities in Northern-Pannonia (Aquincum and Brigetio) were abandoned. This event marks a significant change in the economy of the province, as with the desertion of these towns their hinterlands do not need to contribute to their sustenance as before.58
The date of settlements was defined based on archaeological finds. In the first period (1–2nd century AD) I included sites where pottery in the Celtic tradition, early Samian ware, coins or some traditional Pannonian (or other foreign) garment accessories, like fibulae and belts were
56 All sites determined as “Celtic” were collected from the national site register.
57 The epoch is marked by new constructions in the main towns and in the rural area. Kovács 2012;
Ottományi 2012, 334–353. This is the time of the appearance of municipal middle estates in the region and tighter relations between Aquincum and its countryside. Alföldy 1959; Mráv – Szabó 2012. Based on the names depicted on stone monuments a higher migration rate from the Orient was assumed (litera- ture summarized: Budai Balogh 2011, 81, note 79.), but the question is interpreted differently these days:
Budai Balogh 2011, 77.
58 Aquincum civil town: Lassányi – Vass 2015; Brigetio civil town: Based on the numismatic evidence L. Juhász concluded that only one coin (Pupienus) was discovered after the coins of Trebonianus Gallus from the civil town of Brigetio: Juhász in press. New results of the excavation in the canabae of Brigetio also show that the territory of the military town was also abandoned and used for burial purposes from the end of the 3rd century. The causes of abandonment cannot be explained satisfactorily, but the reign of Gallienus was a time of serious Sarmatian and Quadian raids into Pannonia (Eutr. 9.8), and we still do not know the severity of the so-called plague described by Cyprian (c. 249–270 AD), which probably affected the Empire deeply: Harper 2015.
found. As the Marcomannic-Sarmatian wars were traumatic in the province’s settlement his- tory and many new villae were established after this time,59 only those sites with 2nd century material and no 3rd century material were dated to the first period. The hinterland of Aquincum was most densely populated in the second era. All settlements with finds dated to the 2nd cen- tury found together with pottery produced until the end of Severan age were included in this period. Settlements were dated to the last phase of Roman occupation when finds were called
“late Roman” or a more precise dating was available. All sites which could only be dated as “Ro- man” formed a separate category as no closer information was available regarding their age.
Landscape feature analyses60
Analyses were performed on the landscape features presented above with the distinc- tion that this time the real composition of the zones not a mean value was used. Land- scape features were divided into classes and the area (m2) of each class in each investi- gated zone was measured. As landscape features were described above, I will only discuss the results which were significantly different (p=0.05) from the mean of random zones.61
59 Ottományi 2007, 263.
60 As intensive cultivation was the presupposed economic behaviour under investigation, water supply deter- mined mostly settlement.
61 All Kolmogorov–Smirnov tests were significant on a p=0.05 level where the unequal variance t-tests were statistically different from random zones, therefore their table is not present in this paper.
Fig. 5. Summarizing maps of places of different eras in the hinterland of Aquincum.
In the Welch’s t-test tables green cells represent a positive human attitude towards a cer- tain class, while red ones a negative approach.
Comparison of pre-Roman (“Celtic”) and all Roman places62
As previously anticipated, a greater difference could be observed between pre-Roman and Roman places than between the periods of Roman era (Tab. 13–17). Pre-Roman economic operations were performed in two geographical areas. They preferred a lower altitude than Romans, but they did not avoid the highest grounds, steepest slopes and unsuitable soils. This can be explained by the presence of hillforts, which were placed on high and easily protect- ed hilly terrain.63 All other statistical analyses on landscape features seem to show the same results between the discussed periods. Pre-Roman and Roman farmers preferred lands with wind-protected slopes or plains, a lot of sunny hours and soils ideal for cultivation.
Class Pre-Roman sites
Expected
Pre-Roman Roman sites Expected
Roman Portion of area
0–500 m 99 83.95 261 141.67 47.7%
500–1000 m 16 49.98 19 84.35 28.4%
1000–1500 m 13 26.22 8 44.25 14.9%
>1500 m 48 15.84 9 26.73 9.0%
p value 1.20E–4 1.09E–23
Tab. 11. Chi square test on distance from surface water around Aquincum.
Based on these statistics, the pre-Roman era can be described as having an inclination towar- ds intensive cultivation, which was not necessarily the only mode of agricultural practice.
This picture does not exclude the presence of other economic behaviour such as pastoralism, extensive farming or even fishing64 during the pre-Roman Age, but they did not play a consi- derable role in the evolution of the settlement pattern. The composition of Roman Age zones also reflects the dominance of intensive cultivation.
Class Roman sites Expected Roman Portion of area
0–500 m 141 72.76 30.7%
500–1000 m 43 56.64 23.9%
1000–1500 m 19 34.84 14.7%
>1500 m 34 72.76 30.7%
p value 4.19E–9
Tab. 12. Chi square test on distance from surface water around Carnuntum.
62 Only the results of Welch’s t test are compared, not the population of pre-Roman to all Roman places. As no chronological differentiation was made among pre-Roman places, it made sense to compare them with all Roman and not only 1–2nd century places.
63 On the possible subsistence strategies of Iron Age oppida see: Danielisová – Hajnalová 2014.
64 The frequency of settlements near the Danube can be also explained with this economic activity.
Places 0–150 m asl.
150–200 m asl.
200–250 m asl.
250–300 m asl.
300–350 m asl.
350–400 m asl.
>400 m asl.
Number of places
Pre-Roman 5.189 3.035 0.955 -1.337 -2.056 -0.497 -1.511 134
all Roman 3.035 3.961 2.455 0.191 -3.317 -3.654 -4.502 216
1–2nd century 3.175 6.331 4.073 0.895 -3.817 -1.619 -2.379 86 2–3rd century 3.825 5.162 3.312 1.023 -1.653 -4.137 -4.785 111 3–4th century 3.130 6.062 4.781 2.386 -1.428 -1.960 -2.282 67
“Roman” 2.598 5.790 5.452 3.393 0.285 -3.262 -3.171 72
Proportion of
random zones 19.7% 26.8% 22.3% 12.3% 7.6% 5.2% 6.2%
Tab. 13. Welch’s t-test on elevation around Aquincum.
Places 0–2% 2–5% 5–12% 12–17% 17–25% 25–60% >60% Number
of places
Pre-Roman 5.147 4.598 2.886 1.158 0.035 -1.315 -1.644 134
all Roman 3.207 4.348 3.414 1.725 0.575 -1.801 -2.023 216
1–2nd century 4.488 7.306 7.620 4.430 2.719 0.067 -0.841 86 2–3rd century 4.172 5.821 5.868 4.116 2.805 -0.027 -1.233 111 3–4th century 4.818 6.686 6.208 3.984 2.679 -0.052 -2.980 67
“Roman” 4.101 6.296 6.663 4.905 3.267 0.280 -0.808 72
Proportion of
random zones 16.7% 16.9% 27.4% 12.9% 12.3% 13.4% 0.5%
Tab. 14. Welch’s t-test on slope around Aquincum.
Comparison of places from the Roman period
During the Roman Age, places followed the tendencies described above, but some slight changes could be defined by summarizing the tables.65 Farmers in the first period chose the most confined area regarding elevation. They avoided places higher than 300 asl. Only be- cause of few places in the heart and close neighbourhood of Pilis Mountain they were neutral to the class between 350–400 m. During the 2nd and 3rd century broader territories were con- sidered available for intensive cultivation; attitude towards fields between 300–350 m became neutral. In the late Roman period, the neutral attitude towards higher places continues. This can probably be linked to the crisis of the 3rd century and the ongoing barbarian attacks, which made the strategic view to be more important.66
Interestingly, moderately steep slopes (17–25%) were also preferred in the Roman period com- pared to random territories, which also points to the usage of this type of land for agricultural
65 Aspect was a landscape feature that didn’t give useful results for interpretation as in all periods the average value of classes was significantly higher than in random zones. This could be due to low sample size com- pared to the 1000 random zones, as pre-Roman and all Roman places produced good results.
66 Cf. note 58; Settlements deep in valleys were abandoned and the last occupants of villae around Aquincum were also probably military persons by the end of the 4th century: Póczy 1971, 91.
production, supposing trenching or terracing.67 The other examined landscape features also reflect a uniformity throughout the Roman Age: ideal soils and much sunlight were pre- ferred. Statistics also show a preference towards unsuitable soils regarding the late Roman Age, which is because places in the mentioned period chose territories next to the foot of a hill in greater numbers compared to the second-third century places. Those places which are only defined as “Roman” show close resemblance to the last period of the Roman occupation.
Places Ideal Suitable Unsuitable No data Number of
places
Pre-Roman 4.210 1.026 1.507 0.201 134
all Roman 4.677 0.249 -14.725 -1.257 216
1–2nd century 7.799 0.382 -7.607 0.082 86
2–3rd century 6.958 0.741 -11.712 0.082 111
3–4th century 6.705 1.562 2.075 0.067 67
“Roman” 5.108 0.954 3.202 1.132 72
Proportion of
random zones 13.0% 32.8% 45.8% 8.4%
Tab. 15. Welch’s t-test on soil around Aquincum.
Places Flat North North-
East East South-
East South South-
West West North- West
Number of places Pre-Roman 4.632 1.398 2.891 2.558 1.912 1.212 1.743 0.640 0.842 134 all Roman 3.271 -0.599 3.339 2.890 2.503 1.282 1.840 0.616 0.919 216 Proportion
of random zones
11.5% 7.8% 18.5% 10.6% 9.9% 9.4% 16.4% 8.6% 7.3%
Tab. 16. Welch’s t-test on aspect around Aquincum.
Comparison of rural economic centre locations to all other Roman places68
In the Roman landscape around Aquincum many settlements emerged during the Roman oc- cupation which produced some significant field walking material. This enabled me to make a basic hierarchical classification of recorded sites.69 I defined archaeological sites to be signifi- cant, where building material (stone and tegulae/imbrices or mortar) suggested a Roman-style building and pottery implied that the settlement had intra- and interprovincial economic
67 H. Goodchild came to the same results in her dissertation: Goodchild 2007, 131; Goodchild 2009, 775. This type of land would have also been more available for viticulture than growing crops.
68 The aim of the comparison is to shed light on the reasons for economic centre development in the area, namely the centres’ ideal placement.
69 On most of the recorded archaeological sites, other finds from different historical ages were present and the precise extent of the Roman settlements was not defined. This prevented me from using extent as a factor to set up a more detailed hierarchy as it was done in the South-East of France. Bertoncello 2002. Therefore I could not define the observed sites as a villae or a civilian vici using only field walking material.