OPTIMISATION AND INTEGRATION OF RENEWABLE ENERGY GENERATION AND MANAGEMENT OPTIONS
PhD Thesis Andreja NEMET
Supervisor:
Prof Dr Jiří J. Klemeš, DSc Co-supervisor:
Prof Dr Zdravko Kravanja
Doctoral School of Information Science and Technology University of Pannonia
Veszprém 2014
DOI: 10.18136/PE.2014.552
II
MANAGEMENT OPTIONS
(A MEGÚJULÓ ENERGIA ELŐÁLLÍTÁS ÉS KEZELÉSI LEHETŐSÉGEINEK AZ OPTIMALIZÁLÁSA ÉS INTEGRÁLÁSA)
Értekezés doktori (PhD) fokozat elnyerése érdekében Írta:
Andreja NEMET
Készült a Pannon Egyetem Informatikai Tudományok Doktori Iskolája keretében Témavezető: Dr. Klemeš Jiří J.
Elfogadásra javaslom (igen / nem) ...
(aláírás) Témavezető: Dr. Kravanja Zdravko
Elfogadásra javaslom (igen / nem) ...
(aláírás) A jelölt a doktori szigorlaton ... .... %-ot ért el,
Veszprém ...
a Szigorlati Bizottság elnöke Az értekezést bírálóként elfogadásra javaslom:
Bíráló neve: ... igen / nem ...
(aláírás)
Bíráló neve: ... igen / nem ...
(aláírás)
Bíráló neve: ... igen / nem ...
(aláírás) A jelölt az értekezés nyilvános vitáján ... %-ot ért el
Veszprém, ...
a Bíráló Bizottság elnöke A doktori (PhD) oklevél minősítése: ... ...
Az EDT elnöke
III
The research work presented in this thesis took place at the Research Laboratory of Process Integration and Intensification (CPI2) at the Faculty of Information Technology, University of Pannonia, Hungary. First and foremost I offer my sincerest gratitude to my supervisor, Prof Dr Jiří Jaromír Klemeš, DSc who supported me throughout my thesis with his patience and knowledge, whilst allowing me the space to work in my own way. Special words go to my co-supervisor Prof Dr Zdravko Kravanja from the Laboratory for Process Systems Engineering and Sustainable Development, Faculty of Chemistry and Chemical Engineering, University of Maribor, Slovenia who also gave me support during my research whenever I needed it. I would also like to express my thanks to Dr Petar Varbanov for the discussions and a help during the daily work. Thank you all for your advice, scientific support and also for the flexibility, steady support, and guidance.
I would also like to thank Prof Dr Ferenc Friedler, DSc the Rector of the University of Pannonia for welcoming me to the Department from the very beginning, Dr Rozália Pigler-Lakner, the Dean and also the Secretary of The Information Technology PhD School, Ms Orsolya Ujvári and Ms Zita Vereskuti, the School‘s Project Officers for their administrative support.
Furthermore, I would like to thank, Prof Dr Petr Stehlík from Brno University of Technology, Czech Republic and Prof Dr. György Kozmann from the University of Pannonia, who gave helpful support and advice when preparing me for the comprehensive examination.
During my daily routine I was blessed with friendly and cheerful people. I would like to take this opportunity to show heartfelt thanks to my colleagues, Dr Zsófia Fodor and DDr Lam Hon Loong who gave me helping hands whenever needed and Mr Máté Hegyháti for the collaboration and help with the exams.
Finally, I would like to express my heartfelt gratitude to my family. Thank you for your understanding and selfless support. Without you I would simply not have finished this study.
IV
1 Introduction ... 1
1.1 Problem statement ... 2
1.2 Research objective ... 3
1.3 Methodology and research strategy ... 4
1.4 Outline of the Thesis ... 5
2 Literature review ... 7
2.1 Waste and Biomass ... 9
2.1.1 Thermo – chemical technologies ... 10
2.1.2 Biological processes ... 15
2.2 Geothermal Energy ... 17
2.3 Wind ... 17
2.4 Solar Energy ... 18
3 Creating Combined Time Slices ... 21
3.1 Time Slice for supply ... 21
3.1.1 Approximation of irradiation profile ... 21
3.1.2 MILP model formulation ... 23
3.1.3 Optimisation procedure ... 24
3.1.4 Selection of tolerance ... 24
3.2 Time Slices for demand ... 25
3.3 Combining Time Slices ... 26
3.4 Summary ... 27
4 Ensuring feasible integration of solar thermal energy ... 28
4.1 Heat Integration ... 28
4.1.1 Composite Curves (CC) ... 28
4.1.2 Grand Composite Curve (GCC) ... 29
4.1.3 Total Site Profiles (TSP) ... 30
4.2 Minimal Capture Temperature Curve ... 32
4.2.1 Temperature difference feasibility: MCTCT construction ... 34
4.2.2 Feasibility of the Heat Exchange - Heat Capacity Flow-rate ... 36
4.3 Summary ... 36
5 Estimation of solar collector area and storage size requirement ... 38
5.1 Estimating solar collector area ... 38
5.2 Estimation of storage size requirement ... 41
5.3 Summary ... 42
6 Case study... 43
V
6.1.1 Determining Time Slices for a solar irradiation ... 43
6.1.2 Determining Time Slices for the process demand side ... 45
6.1.3 Combined Time Slices from Solar Irradiation and the demand side ... 47
6.1.4 Estimation of required solar collector area and storage size ... 48
6.1.5 Economic evaluation ... 53
6.2 Summary ... 54
7 Monitoring/ Short-term estimation of integrated amount of solar thermal energy during operation55 7.1 Determining outlet temperature from solar thermal collectors... 56
7.2 Determining storage temperature ... 58
7.3 Determining the amount of heat exchanged within Time Slices ... 59
7.4 Application of the model in an Excel spreadsheet ... 62
7.5 Summary ... 66
8 Nomenclature ... 67
9 Summary of accomplishments ... 71
9.1 Original Contributions ... 71
9.1.1 Creating Combined Time Slices for integration of Solar Thermal Energy ... 71
9.1.2 Ensuring feasible integration of Solar Thermal Energy ... 71
9.1.3 Estimation of integrated amount of Solar Thermal Energy ... 72
9.1.4 Model for monitoring and short term estimation of integrated amount of solar thermal energy 72 9.2 List of publications ... 72
10 References ... 77
VI
Figure 1: Dimensionality of the integration of a) the power from solar source and b) the Solar Thermal
Energy ... 3
Figure 2: Steps of solar thermal energy integration to processes with heat demand and its presentation in the Thesis ... 6
Figure 3: Types of waste and available technologies for treatment ... 10
Figure 4: Outputs and their treatment/ utilisation of thermo – chemical WTE processes ... 13
Figure 5: Outputs and its treatment/ utilisation of bio–chemical WTE processes ... 17
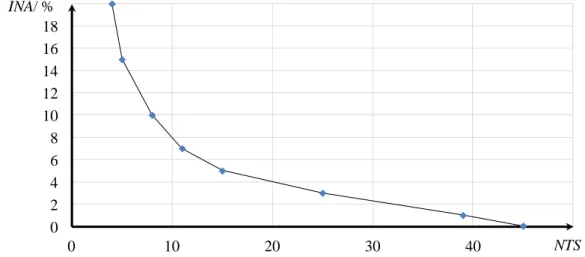
Figure 6: Discretisation of the measured profile/ input data for optimising the number of Time Slices (Nemet, et al., 2012a) ... 21
Figure 7: Determining the inaccuracy between the input and approximated supply (Nemet, et al., 2012a) ... 22
Figure 8: Acceptance/ rejection of the candidate time interval boundary as a Time Slice boundary (Nemet, et al., 2012a) ... 22
Figure 9: Selecting an acceptable inaccuracy (Nemet, et al., 2012a) ... 25
Figure 10: Heat demand of a representative day from each season. (Shaneb et al., 2011)... 26
Figure 11: Gantt chart for those TSs for supplying A) Solar thermal energy, B) Heat demand and C) Combined for both (Nemet, et al., 2012a). ... 26
Figure 12: Composite Curves (for details see Klemeš et al, 2010) ... 29
Figure 13: Grand Composite Curve (Townsend and Linnhoff, 1983) ... 29
Figure 14: Total Site (after Perry et al, 2008) ... 30
Figure 15: Total Site Profile consists from Sink and Source Profile (TSP) (after Fodor et al, 2010) ... 31
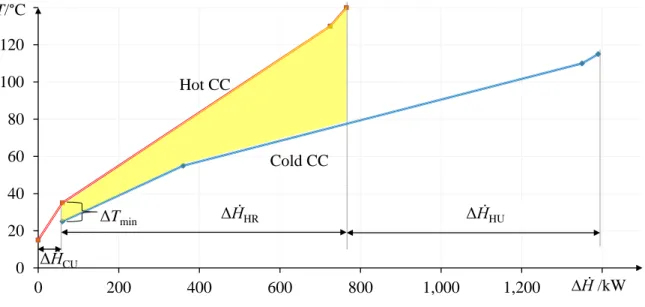
Figure 16: Heat recovery with temperature difference required and utility requirement in TSP ... 32
Figure 17: Solar Thermal Capture system (Nemet et al., 2012b) ... 33
Figure 18: Algorithm for constructing the MCTC when A) using storage and B) the heat is transferred directly (Nemet et al., 2012b) ... 34
Figure 19: Construction of MCTCT when storage mechanism is: a) sensible thermal, b) latent thermal and c) chemical (after Nemet et al., 2012b) ... 35
Figure 20: Constructing MCTC when a) CPMCTC > CPRH and b) CPMCTC < CPRH (Nemet et al., 2012b) ... 36
Figure 21: Determining the demand that can be potentially covered from solar thermal ... 39
Figure 22: Basis for determination of solar thermal collector area ... 40
Figure 23: Selecting an acceptable inaccuracy (Nemet, et al., 2012a) ... 44
Figure 24: Time Slice boundaries for irradiation. ... 44
Figure 25: Reduced Time Slice for irradiation ... 45
Figure 26: GCC of the process demand for Time Slice: a) 0-6, b) 6-15, c) 15-17, d) 17-20 and e) 20-24 ... 47
Figure 27: Combining solar and demand Time Slices (TiSl) into Combined Time Slices (cTiSl) ... 48
Figure 28: Determining the potential enthalpy flow that can be covered form solar source of energy ... 49
Figure 28: Scheme of the system for indirect heat integration of solar thermal energy ... 58
Figure 29: Heat transfer of a) process heat surplus to storage and b) from storage to heat demand ... 60
Figure 30: Possible options of a)-c) storing heat from process or d)-f) covering process heat demand from storage ... 61
Figure 31: Time interval enumeration and the solar irradiation, together with the ambient temperature presented in the Excel Spreadsheet ... 63
Figure 32: Input and calculated data regarding the solar collector system in the Excel spreadsheet ... 64
Figure 33: Part of the Excel Spreadsheet regarding the storage ... 64
Figure 34: Part of the Excel spreadsheet connected to the process heat demand ... 65
Figure 35: Part of Excel spreadsheet dedicated to the process heat surplus ... 65
VII
List of tables
Table 1: Advantages and Disadvantages of renewable energy sources ... 7
Table 2: List of streams after heat recovery as input data ... 45
Table 3: Matrix of presence/absence of a certain stream within certain time intervals... 46
Table 4: Determining the amount of heat demand that can be potentially covered by solar source of energy 49 Table 5: Determining amount of heat potentially gained during one typical sunny day ... 50
Table 6: Required area of solar collectors for different time periods of storage ... 51
Table 7: Determining the load of solar thermal energy supply and the utility with constant load. ... 52
Table 8: Determining storage size ... 53
VIII
Inspite of several negative impacts such as air pollution, depletion of the ozone layer, excessive soil erosion and pollution caused by various substances, water pollution as well as energy dependence, limited sources of energy, centralisation of energy sources etc., the primary energy productions are still based mainly on fossil energy sources. The aim of this research was to support the integration of renewable energy sources within various types of processes according to heat demand. Whilst studies have dealt with the integration of solar energy sources in the form of electricity, fewer has been done on the topic of integrating Solar Thermal Energy. The goal of this work was to fill this gap. A multi-period model was created with an assumed steady load within time intervals of supply and demand. The following developments have to be achieved in order to allow the integration of Solar Thermal Energy:
1. Creating combined Time Slices for the integrating of Solar Thermal Energy. The integration of Solar Thermal Energy has to be performed separately within each Time Slice. The number of Time Slices on both the supply and demand sides have to be decreased as much as possible in order to reduce the complexity of integration. This has to be performed carefully as any reduction in Time Slices leads to lower accuracy of the model. A mixed- integer linear model has to be developed based on the trade-off between the number of Time Slices and inaccuracy.
2. Ensuring feasible integration of Solar Thermal Energy. After determining a proper number of Time Slices the focus is then on the feasible integration of heat. The driving force for heat exchange is the appropriate temperature difference, which depends on i) the required minimal temperature difference and ii) correlation of heat capacity flow rates of the two streams between which the heat exchange occurs. A Minimal Capture Temperature Curve (MCTC) and an algorithm for its construction has to be created in order to obtain a feasible heat exchange.
3. Estimation of storage size and required solar collector area. The storage size and solar collector area should be estimated in order to evaluate the whole design of the Solar Thermal Energy integration system. The size of the solar collector area and solar panels is determined based on the number of sunny and shady days. This ratio is then used to determine the size of solar panel surfaces by considering the solar panel surface for a single day and multiply it by this ratio in order to obtain the total for all days. The storage size depends on the quantity of heat, which is the sum of the number of shady days, a single night demand and heat losses. By determining the size of the solar panels and collector area
IX integration of solar energy.
4. A model for the monitoring/short-term estimation of the integrated amounts of solar thermal energies. The preliminary analysis for evaluation of a Solar Thermal Energy integration system would be based on the average values of solar irradiation as well as on the more probable heat demands of the process. However, when the integration system is operating, the loads on both the supply and demand sides could differ quite significantly from those forecasted average values made at the preliminary analysis stage. Therefore, the real time performance of the system needs to be monitored and used for short-term estimation. A model was created for this purpose and once applied regarding the outlet temperatures of the collector the storage temperatures at the ends of each time interval could be determined together with the amounts of heat at both heat exchanges.
Az elsődleges energiatermelés még mindig elsősorban a fosszilis energiaforrások felhasználásával zajlik, a sok negatív hatás ellenére – beleértve a légszennyezést, az ózonréteg elvékonyodását, a túlzott talajeróziót és annak szennyezését a különböző szennyezőanyagokkal, a vízszennyezést, valamint az energiafüggőséget, a korlátozott energiaforrásokat, az energiaforrások központosítását stb. A tanulmány célja a megújuló energiaforrások integrálásának a támogatása – különböző hőigényes folyamatokba. Számos tanulmány készült a napenergia integrálására villamos energia formájában, viszont a termikus napenergia használata nagyüzemi méretekben nem része a szokásos gyakorlatnak, ezért ez a tanulmány erre a területre összpontosít. Egy olyan multi-periódus modell lett kifejlesztve, amely állandó terhelést tételez fel a periódusokban a kínálat és a kereslet oldalán is.
Az alábbi fejlesztésekre volt szűkség a termikus napenergia integrálására:
1. Az ún. combined Time Slices (egyesített időszeletek) a termikus napenergia integrálására. A termikus napenergia integrálása az egyes időszeletekben külön-külön van kivitelezve. Az időszeletek száma a kínálat és a kereslet oldalán is csökkentve volt az integrálási feladat bonyolultsága csökkentése érdekében. Ezt fokozott figyelemmel kell kivitelezni, hiszen az időszeletek csökkentése a modell pontatlanságának a növeléséhez vezet. Egy vegyes egész lineáris modell lett kifejlesztve az időszeletek száma és a pontatlanság „trade-off‖-ja alapján.
2. A termikus napenergia integrálásának a megvalósíthatósága. A megfelelő számú időszeletek meghatározása után a hangsúly a megvalósítható hő-integráláson van. A hőcsere mozgatóereje a megfelelő hőmérséklet-különbség, amely a 1) minimális hőmérséklettől és 2) a hőt cserélendő folyamok hő-áram kapacitásának az összefüggésétől függ. Az ún.
„Minimal Capture Temperature Curve‖ (minimális előállítási hőmérsékleti görbe) és ennek szerkesztésének az algoritmusa került kifejlesztésre.
3. A tároló méretének és a napkollektorok területének becslése. A tároló mérete és a napkollektorok területének a becslése a termikus napenergia integrálási rendszerének az elemzésére lett kifejlesztve. Az elemzés keretét a napos és az azt követő árnyas napok száma adja meg. A napkollektorok területét az összes nap (napos és árnyas) és a csak napos napok hányadosa alapján határozzuk meg. Ez a hányados tényezőként szolgál a napkollektorok területének a növelésére, méghozzá az egy napos napra meghatározott terület növelésére úgy, hogy az eleget tegyen az összes nap hőigényének. A tároló méretének a becslésére az árnyas napok hőigénye és egy éjszakai hőigény, valamint a hőveszteségek összege az alap.
A kifejlesztett módszerek által a termikus napenergia integrálási rendszerének elsődleges elemzése végezhető el.
II
távú előrejelzésére kifejlesztett modell. A termikus napenergia integrálási rendszerének elsődleges elemzése az átlagos napsugárzási értéken, valamint a legvalószínűbb folyamat hőigényein alapul. Amikor azonban az integrálási rendszer működésben van, a terhelés mindkét (keresleti és kínálati) oldalán jelentősen eltérhet az elsődleges elemzés alatt előrelátott átlagos értékektől. Ezért a rendszer valós idejű teljesítményét folyamatosan kell követni, és az itt szerzett adatokat felhasználva rövid távú előrejelzést is ki lehet vitelezni.
Ennek érdekében egy modellt hoztunk létre, amely által a napkollektorok kimeneti hőmérsékletét, a tároló hőmérsékletét az időszakok végén és a hőcsere mennyiségét mindkét hőcserére meg lehet határozni.
III
Trotz der vielen negativen Einflüsse wie z.B. die Luftverschmutzung, der Abbau der Ozonschicht, übermäßige Bodenerosion und durch unterschiedliche Substanzen verursachte Bodenverschmutzung, Wasserverschmutzung, wie auch Energieabhängigkeit, begrenzte Energieträger, Zentralisierung von Energieträgern usw., basiert die primäre Energieerzeugung immer noch an fossilen Energiestoffen. Das Ziel dieser Forschung ist es die Integration von erneuerbarer Energie in unterschiedlichen Prozessen mit Wärmebedarf zu unterstützen. Im Mittelpunkt steht der Gebrauch von Solar Thermal Energie, deren Integration (vor allem im Bezug auf die Solarenergieträger wie z.B. der Strom) das Thema zahlreicher Studien war. Viel weniger dagegen wurde über die Integration von Solar Thermal Energie geschrieben. Das Ziel dieser Studie ist es diese Lücke zu fällen. Zu diesem Zweck wurde ein Mehrperiodenmodel mit angenommen konstanten Angeboten und Nachfragen erstellt. Die Integration von Solar- und Thermalenergie verlangte folgendes:
1. Die Erschaffung von kombinierten Zeitscheiben für die Integration von Solar Thermal Energie. Die Integration von Solar Thermal Energie tretet binnen jeder Zeitscheibe getrennt auf. Die Menge von Zeitscheiben wurde bei Angebot und Nachfrage möglichst reduziert, um so die Komplexität der Integration zu verringern. Das sollte allerdings nur mit großer Vorsicht ausgeübt werden, denn die Verringerung von Zeitscheiben kann zu einer niedrigeren Modelgenauigkeit führen. Demzufolge wurde ein gemischtes ganzzahliges lineares Model entwickelt, das an einem „Trade-off― zwischen der Zeitscheibenmenge und Ungenauigkeit basiert.
2. Versicherung einer durchführbaren Integration der Solar Thermal Energie. Nach Festlegung der richtigen Menge von Zeitscheiben wird der Focus auf die durchführbare Wärmeintegration übertragen. Die treibende Wärmekraft tauscht den passenden Temperaturunterschied aus; dieser hängt von i) dem benötigten minimalen Temperaturunterschied und ii) der Korrelation der Wärmekapazität-Durchflussmenge der zwei Strömungen, zwischen denen der Wärmeaustausch stattfindet, ab. Um einen durchführbaren Wärmeaustausch zu verschaffen, wurden die minimale festgenommene Temperaturkurve (MCTC) und ihr Algorithmus entwickelt.
3. Einschätzung der Größe des Lagerungs- und Sonnenkollektorgebiets. Für die Einschätzung des gesamten Integrationssystems für Solar Thermal Energie soll man die Größe der Lagerungs- und Sonnenkollektorflächen festlegen. Die Größe der Sonnenkollektoren und
IV
für die Festlegung der Solarpanelfläche verwendet. Dabei wird die Grüße der Solarpanelle, deren Energie für einen Tag ausreicht, mit dieser Maßzahl multipliziert um die Gesamtanzahl aller Tage festzulegen. Die Größe des Lagerungsgebiets hängt aber von der Wärmemenge ab; diese wird als Summe der Schattentage, des Energiebedarfs für eine Nacht und der Wärmeverluste festgelegt. Durch die Festlegung der Größe der Sonnenkollektor- und Solarpanelflächen kann man eine Analyse des Integrationssytems der Solar- und Thermalenergie für die Integrierung von Solarenergie vorzeitig vorbereiten.
4. Das Model für die kurzfristige Einschätzung der integrierten Menge von Solar Thermal Energie. Die Voranalyse für die Einschätzung des Integrationssystems der Solar Thermal Energie basiert auf dem Durchschnittswert der Sonneneinstrahlung und des wahrscheinlichsten Wärmebedarfs beim Prozess. Während das Integrationssystem läuft, können die Belastungen bei Angebot und Nachfrage wesentlich von dem angesagten und in der Anfangsphase vorhergesehenen Durchschnittswert abweichen. Die tatsächliche Leistungsfrist des Systems sollte überwacht und für kurzfristige Einschätzungen verwendet werden. Für diesen Zweck wurde ein besonderes Model erschaffen, das bei Anwendung die Austrittstemperatur der Stromabnehmer, die Aufbewahrungstemperatur auf beiden Enden jeder Zeitscheibe und die Wärmemenge bei beiden Wärmeaustauschen festlegen kann.
1
1 Introduction
Nowadays, primary energy production is mainly based on fossil energy sources as the oil share of global energy consumption in 2011 was 33.1 %, the share of coal 30.3 % and that of natural gas 23.7 %, which altogether represents 87.1 % (BP, 2012). The utilisation of fossil fuels have many negative impacts which are manifold: (i) on the environment: air pollution, depletion of the ozone layer, excessive soil erosion and its pollution by various substances, water pollution etc., and (ii) also on the economy: energy dependence, limited sources of energy, centralisation of energy sources. For example in 2011 the Middle East held 48.1 % of the proven global reserves of oil (BP, 2012). For natural gas the Middle East held 38.4 % while Europe and Eurasia 37.8 % of the proven reserves. Most of the proven reserves of coal were held by Europe and Eurasia (35.4 %).
Additionally, the energy demand was increasing, in the year 2011 2.5 % was the energy growth regarding world primary energy consumption (BP, 2012). Therefore, the consequences of utilising fossil fuel might have led to a socio-economic crisis of because of an unreliable supply of energy, with high environmental impact, which would consequently have also seriously affected human beings. Certain urgent actions to reduce fossil fuel consumption had already been performed in the past. Firstly, and the most valuable approach, had been increasing the efficiency of energy consumption, as it also reduces the impact. However, despite the enormous development of methodologies for reducing energy consumption, the population on the earth is constantly growing therefore the energy demand is still also growing. It can be observed from the following data that the primary energy consumption has grown in OECD countries by 0.8 %, whilst in the non-OECD countries by 5.3 % (BP, 2012). Additionally, the people from developing countries are also increasing their consumption per capita. All these observations have led to the conclusion that other sources of energy are needed in order to cover the energy consumption within an environmentally friendlier way. Alternative options, which are becoming reality, are the renewable sources of energy. However, their share in global energy consumption is still quite low, 1.6 % in 2011 (BP, 2012). The two targets set by Directive 2009/28/EC for achievement by 2020 in the EU are the following: 20% share of energy from renewable sources, and a 10% share of energy from renewable sources for transport regarding Community energy consumption (EC, 2009). IEA is predicting a share of renewables in the world energy mix of almost one-third by the year 2035 for electricity production (IEA, 2012). According to the definition of the Texas Renewable Energy Industries Association –TREIA renewable energy is ―Any energy resource that is naturally regenerated over a
2
short time-scale and derived directly from the sun (such as thermal, photochemical, and photoelectric), indirectly from the sun (such as wind, hydropower, and photosynthetic energy stored in biomass), or from other natural movements and mechanisms of the environment (such as geothermal and tidal energy). Renewable energy does not include energy resources derived from fossil fuels, waste products from fossil sources, or waste products from inorganic sources.―
(TREIA, 2013). A simpler definition of renewable sources is that they are energy sources that can be easily and quickly replenished, therefore they have unlimited supply.
Their main advantages are:
Sustainability, as long as the sun is available,
Usually decreased environmental impact when utilising them,
Local availability, thus resulting in energy independence, and
Low costs or even free regarding the sources.
There are many different sources with their own specific properties. The more common sources are biomass, solar, wind, and geothermal. These energy sources are highlighted briefly in the following section 2. Literature review.
1.1 Problem statement
The wind and solar sources of energy are types of renewable sources, which are available almost everywhere all around the world. However, when integrating them they have an important property of a significantly varying supply that needs to be taken into account.
Therefore, a methodology is needed that accounts for these variations. In order to overcome them either energy storage or connection within a larger scale grid needs to be established. In this presented thesis the focus is on the solar source of energy. It is a source of energy the utilisation of which is growing more rapidly than any other renewable energy source (IEA, 2012). There are two common ways of obtaining energy from the solar source namely:
(i) Power using photovoltaic (PV) cells (ii) Heat using thermal collectors
On the smaller scale (in residential areas) heat is usually produced while on a larger scale (in industry) PV is the common solution. Significant differences can be observed, when comparing the efficiencies of the diverse systems. The efficiencies of PV panels are usually within the range of 12 – 18 %, whilst thermal collectors‘ efficiencies are within the range of 45 – 60 %. As the efficiency of the heat collection system is triple that of PV panels, utilisation of thermal collectors within large-scale industrial plants would be a more efficient solution. However, the complexity of the problem is higher when producing thermal energy.
3
Figure 1: Dimensionality of the integration of a) the power from solar source and b) the Solar Thermal Energy
The power supply from PV panels can be described as having two variables: power and time (Figure 1a). For comparison, when supplying heat the problem can be presented as having three variables: time, temperature, and load (Figure 1b). Despite the complexity of the problem, installing solar thermal collectors might also be a better option for the larger-scale however, a proper design is inevitable for obtaining reliable and economically-viable utility supplies
1.2 Research objective
The objective of this research was to develop a methodology that would provide for the integration of Solar Thermal Energy within processes regarding heat demand. An important view of this integration was to consider the available energy and the heat requirements simultaneously. The integration of renewables into a process system or another energy use needs a specific approach due to variations in energy supply availability from renewable sources, as well as fluctuations in the users‘ energy demands. Two approaches were possible for this purpose:
i. A dynamic model formulation, followed by dynamic optimisation.
ii. A multi-period model involving a series of steady states associated with time intervals within the modelling horizon.
The advantage of dynamic models is that they describe the systems‘ behaviour very precisely. They are usually employed for solving servo- and regulatory tasks during process control. There are dynamic models that describe those plants using Solar Thermal Energy as a utility (Chaabene and Annabi, 1998). However, dynamics models are often too complex for solving larger scale problems so this work applied a multi period steady-state model. A high number of periods are applied during this approach therefore its horizon is short enough for a steady state to be assumed with
Electrical energy/kWh
Time/h Power/
kW
Amount of heat/kWh
Time/h Load/kW
Temperature/°C
a) b)
4
insignificant error. This approach was thus applied when obtaining the design for the presented Solar Thermal Energy system. There were two main aims set by this thesis. The first one was to determine a thermodynamically feasible design with minimum utility requirement, besides Solar Thermal Energy. This aim was important during decision-making about the system before it was constructed. The second aim was to develop a method for the monitoring and short-term estimation of integrated amount of solar thermal energy based on a weather forecast, which is usually quite reliable for a couple of days in advance. This aim when achieved could support decision-making during the operation of the system.
1.3 Methodology and research strategy
An analogy from batch process integration was used for the integration of solar irradiation. The Heat Integration of batch processes is a well described field of research that uses steady-state.
During batch processes, energy demands vary over time. In order to account for these variations Batch Process Integration was initiated by Kemp and Deakin (1989), who developed two models:
(i) Time Average Model, where the heat loads are averaged through the time horizon, and (ii) Time Slice Model, where the Time Slices can be obtained by combining the starting and
ending time points when the involved process streams are present.
Within these Time Slices the Heat Integration can be performed in the same manner as for the continuous processes. The analogy is done by applying the Time Slice Model (TSM). However, in the case of solar irradiation there is no time starting and ending time of the stream, instead the profile is increasing or decreasing continuously.
A somewhat different approach was developed. Firstly, Time Slices (TiSl) had to be obtained for the supply having an assumed constant load. A mixed-integer linear programming (MILP) model was developed for this purpose. It had a multi-objective optimisation, with two objectives - to minimise:
(i) The number of TiSl.
(ii) The inaccuracy.
It could be created either by two-stage optimisation or by combining within one-stage optimisation as well. When the TiSl for the supply side is obtained the TiSl from the demand side has to be determined. This is done similarly to Batch Process Integration by applying the starting and ending times of the streams present. When the Time Slices from the supply and demand sides are set, they have to be combined. After obtaining Combined Time Sliced (cTiSl) an inevitable part of methodology is to obtain feasible integration of solar thermal energy within each TiSl separately.
Two major properties have to be evaluated for this purpose:
5 (i) The temperature difference.
(ii) The heat capacity flow-rate.
The following step was to estimate the required minimal storage size and the minimum solar collector area requirement. A more complete design can be obtain by making these estimations.
On average irradiation curves are applied when creating a design for the integration system of Solar Thermal Energy. However, in reality greater deviation from average values is possible. Therefore, a methodology for analysing the integrated amount of solar thermal energy based on real-time forecast should be performed, in order to forecast the external utility consumption for a couple of days in advance. The evaluation of the integrated amount of solar thermal heat and the performance of the integrated system could be monitored in this way. A basic model for short-term evaluation was developed based on the heat balances of the integration system.
1.4 Outline of the Thesis
This thesis has been constructed in such a way as to present each important step of the methodology separately. In Section 2 – Literature reviews the more common renewable energy sources and their properties with special emphasis on solar thermal energy. The following Sections 3-5 are dedicated to the presentation of our own developed methodology for integrating solar thermal energy before operating the system. Section 6 contains a case study putting the previously developed methodology into practise. Figure 2 presents each important step of the methodology within each section for integrating solar thermal energy together where each step is described individually. The first important step of the methodology is the cTiSl, described in Section 3, obtained from the supply and demand side within which the steady state might be assumed. After obtaining cTiSl the integration of Solar Thermal Energy is performed for which the ground is set in Section 4. For this purpose the temperature and heat capacity flow-rates should be evaluated in order to ensure feasible heat exchange. After obtaining the feasible heat exchange and therefore successful integration of solar thermal energy, the third important design aspect of the system is its storage size and the solar collector area requirement. This issue is discussed in Section 5. As the investment and maintenance of the storage are directly proportional to the storage size, it should be as minimal as possible, however still allowing the required capacity. After all the theoretical ground has been presented in detail, a case study is performed, in order to present the methodology application of the developed methodology. This case study is based on a real case taken from the literature and is presented in Section 6. Section 7 includes the model developed for evaluating the system‘s performance during the operation. It contains monitoring the outlet temperature of the collector, the storage temperature at the end of the time interval and the actually integrated amount of solar thermal energy. The
6
subsequent section 8 contains the nomenclature of symbols used in the thesis. The summary is included in Section 9. The last section contains the reference list.
Figure 2: Steps of solar thermal energy integration to processes with heat demand and its presentation in the Thesis
TIME SLICES FOR SUPPLY
TIME SLICE FOR DEMAND
COMBINATED TIME SLICES
INTEGRATION OF SOLAR THERMAL ENERGY WITHIN EACH TIME SLICE
SEPARATELY
ESTIMATION OF STORAGE SIZE AND
SOLAR THERMAL COLLECTOR AREA
TARGET OF INTEGRATED SOLAR THERMAL ENERGY TO
PROCESSES Section 4
Section 5 Section 3
7
2 Literature review
This section presents the more common renewable energy sources - biomass, wind, geothermal and solar sources of energy. Additionally, a non-renewable energy source ‗waste‘ is presented as a source of energy as waste production is also increasing and has significant impact on the environment. Waste-to-energy technologies have a double positive effect: (i) reducing the amount of waste for landfilling and (ii) producing energy.
The advantages of utilising renewable sources of energy are numerous: they are sustainable, considered to be virtually inexhaustible, usually have low environmental impact, and support energy independence due to local availability, etc. However, all renewable energy sources have their own disadvantages. The common property of biomass and waste is their low energy density therefore; transportation has to be conducted carefully. The technologies for organic waste treatment and biomass are presented within the same section as the basic methodologies of those processes that are similar for both energy sources. The following source of energy discussed is the geothermal source of energy. The main weakness of this energy source is the local availability of it and its remote source points from the actual energy utilisation point. After presenting those sources that have mainly constant availability, the overview focuses on the wind and solar sources of energy that have varying availabilities. The fluctuating properties of the wind and solar sources of energy require special attention when designing a system for integrating energy from those sources to a utility system. An overview of the main advantages and disadvantages of renewable energy is presented in Table 1.
Table 1: Advantages and Disadvantages of renewable energy sources Energy
source
Advantages Disadvantages
biomass • Unless direct combustion, there is minimal environmental impact
• Fuels produced by biomass are efficient, viable, and relatively clean-burning
• Widely available in some regions
• Agriculture wastes – added- value to agricultural crops.
• Low density of energy- high transportation cost- high emission into the environment
• Competition between areas for food and energy production
• Contribute to global warming and particulate pollution if directly burned
8
• On a smaller scale - likely a net loss of energy
Waste • Double benefit: reducing the landfilled waste and simultaneous production of energy
• Concentrates hazardous substances to ash for burial
• Proper control can reduce air pollution
• Potential to recover and sell metals and other raw materials
• High Capital cost: it costs more than short-distance transport to be landfilled
• Some air pollution and CO2
emissions
• Output approach, which encourages waste production
• Can compete with recycling for burnable materials such as newspapers
• The public acceptance is poor Geothermal
source
• Energy costs may be lower when compared to many other energy sources.
• Low environmental impact when using geothermal.
• Geothermal heat pump systems can reduce energy use by storing heat from the summer/sun and making use of it during the nights and the winter. Low maintenance systems.
• Localised Depletion: should never be transported over longer distances.
• The heat source is mostly close to volcanic activity of some sort
• High Cost
- Drilling and exploration
- Corrosion and fouling maintenance can outweigh benefit
wind • Less space required compared to an average power station.
• Wind turbines can be a range of different sizes
• When combined with solar
electricity provides a steady, reliable supply of electricity.
• Unreliability factor; in many area winds‘ strengths are too low
• Wind turbines generally produce less electricity than the average fossil-fuelled power station
• Wind turbine construction can be very expensive
• The noise pollution from commercial wind turbines
• Protests and/or petitions usually confront any proposed wind farm development
Solar • Good for remote applicants e.g. • Currently, electricity from PV
9 rural hospital equipment in developing countries
• On the spot source of energy, no transportation costs
• The sources are free
• Can provide energy independence
systems is more expensive than electricity produced from fossil fuel
• Expensive equipment
• Requires engineering expertise to design and install
• Large areas needed to produce sufficient amounts of energy
• Sunlight is never constant, thus varying availability of supply:
additional sources of energy and/or storage are required
2.1 Waste and Biomass
Wastes are very heterogeneous materials therefore different classifications of wastes have been performed in several different ways. Some ways of classification are directly included within legislation (such as distinguishing between hazardous and other waste), other classifications correspond to the intentions the waste is to be used. As an example of purpose classification one can list the classification of municipal waste according to Speight (2008) or industrial waste classification according to Lee and Byeon (2009) created when conducting a study for South Korea.
Amongst the basic possibilities of waste classification can be included the classification according to (Tabasová et al., 2012):
State of matter
Hazard
Resource category
Thermal decomposition
Utilisation of waste is divided into several groups based on whether the waste is only incinerated or a fuel, for later utilisation or is produced. The production of fuel from waste can take place either by thermal decomposition (gasification, pyrolysis, and hydrolysis) or by biological processes (anaerobic digestion, fermentation), as presented in Figure 3.
10
Figure 3: Types of waste and available technologies for treatment 2.1.1 Thermo – chemical technologies
The benefits of applying thermo-chemical treatment of the waste are the lower volume and the utilisation of chemically bonded energy within the waste. Chemically bonded energy can be converted into heat and/or electric power and for producing alternative fuels. Another reason for applying incineration is the destruction of hazardous matters that can represent significant environmental and public health risks. It is necessary to take into account that thermal processing (treatment) of waste can also bring negative impacts in the form of possibly generating emissions of contaminants in flue gas; the presence of hazardous substances in the ash, pollution of water used in particular technological points of the incineration equipment etc.
The legal requirements on equipment for the thermal processing of waste are constantly being tightening up. It is for this reason that development of technologies used within units for the thermal processing of waste has gone through rapid development over last few years. The incineration process involves the burning of combustible materials in the presence of an oxidizer. This process converts the waste to flue gas, heat, metal, and ash. Flue gas is a mixture of N, O2, water vapour and CO2. Within its contents are sulphur oxides, nitrogen oxides and mineral acids (hydrochloric acid).
This gas could be usable directly as a heat source or within a steam turbine for producing electricity or a combination of both. The incineration of waste is one of the more widespread technologies for the thermal processing of waste. Its benefit is that it can be applied to various types of waste (C- Tech Innovation, 2003). The process of incineration needs a surplus of oxygen (complete oxidation). When applying this process it is possible to reduce its initial volume by 90 % and its weight by 75 % when incinerating solid municipal waste.
The main stages of the incineration process (C-Tech Innovation, 2003):
W A
S T E
Combustible
Organic Hazardous
Heavy metals
T E C H N O L O G Y Incineration
Gasification Pyrolysis Anaerobic digestion Alcohol fermentation
Landfilling
11 1. Drying and degassing
2. Pyrolysis and gasification 3. Oxidation
Currently there are two of the more common types of incineration design, namely the incineration of municipal solid waste or hazardous and industrial wastes, however there are also plenty of specialised units. They are e.g. incineration plants for industrial sediments, those for pulp and paper production (Oral et al, 2005). Incineration of cleaning plants‘ sediments takes place in multiple hearth combustion chambers with fluidised beds. Coal firing is also used within grated combustion systems that burn coal during industrial processes. Sewage sludge often contains high content of water and requires drying or the addition of additional fuel to ensure stable and effective combustion (Oral et al, 2005).
Gasification is often defined as the partial oxidation of waste in the presence of an oxidant amount lower than the required stoichiometric combustion. In contrast pyrolysis is carried out in the absence of oxidant. It is a process of decomposition of the waste. The product of both gasification and pyrolysis is the syngas. This is mainly a mixture of H2 and CO, but it contains other gases too.
There are different types of gasification. Plasma arc gasification is a well-known type. Plasma is a gas of which at least some percentage of its atoms or molecules has been partially or totally ionised.
This is achieved by an electric arc created by high voltage between two spaced apart electrodes. An inert gas passes through the arc to the waste.
Another type of gasification is supercritical water gasification (SCWG). During this process biomass is converted to hydrogen-rich gaseous products. A lesser known technology is also the
―fast‖ pyrolysis of waste cooking oil (WCO), waste lubricant oil (WLO) and waste plastics (WP), off which a large amount is generated. Singhabhandhu and Tezuka (2010) investigated the pyrolysis of the mentioned wastes and their mixtures by comparing their cost–benefits, scales and sensitivities. They concluded that an integrated co-processing of WCO, WLO and WP to produce pyrolytic oil would be a profitable alternative in comparison with the usual practices of waste management. During a sensitivity analyses they also discovered no effect on the benefit-cost ratio at increased electricity costs. The ratio was no worse, not even in the case of a 100 % increase in transport costs.
The operational concepts of equipment for the thermal processing of waste are generally the same.
Incineration plants consist of the thermal part, heat recovery block, and a system for the cleaning of generated flue gas. The process usually contains storage, equipment for the manipulation and preparation of waste, and equipment for processing solid and liquid products during incineration, (Stehlík, 2009). The aim of the designers of current technologies is to substitute a major part of the
12
energy imported into technology with produced heat and electricity. Energies from outer networks are only used for starting and shutting down the incineration plant, or in emergencies. Cogeneration systems are especially suitable for this approach, when technology itself covers its own consumption of power along with steam production.
The performances of incineration plants in the EU must follow the best available technologies (BAT) according to the referential documents of the BAT methodology released by the EC. BAT for waste incineration (EC, 2006) deals directly with the incineration of waste. During the first stage of incineration (thermal block) the thermal decomposition of flammable parts of waste occurs, releasing almost all the heat contained within the combustible part of the waste. It takes place in combustion chambers with moving grates, rotary kilns, and additionally incineration within a fluidised bed may be used. Some preliminary modification or waste separation is necessary in order to meet the particle size requirement for the MSW incineration.
Incinerations of the MSW on the grate and the modelling of this process were investigated by Asthana et al. (2010). The thermal decomposition process and oxidation of combustible substances is finished in the burning-out part – secondary combustion chamber (SCC) that constitutes the second combustion stage. A proper construction of the device ensures necessary time for the flue gas to remain within the areas of high temperatures for the decomposition of even the more stable compounds within the flue gas. The walls of the secondary combustion chamber often have a built- in tubular heat exchange system from the evaporating part of the boiler, which connects the thermal block with the released heat utilisation system (Jegla et al., 2010). Recirculation of a share of flue gas from the end of the flue gas pathway back into the thermal block is often technologically favourable but there are also opinions against this solution (Liuzzo et al., 2007).The flue gas is then led into the released heat utilisation block and into the flue gas cleaning system.
In order to minimise the environmental impact, it is crucial to overview the emissions and effluents that can appear in each of the technologies. This section provides an overview of the emissions and effluents of the thermo chemical WTE technologies (Figure 4); including the latest development/research regarding cleaning.
13
Figure 4: Outputs and their treatment/ utilisation of thermo – chemical WTE processes
2.1.1.1 Off–gas treatment
The major components of flue gas are nitrogen, oxygen, water vapour, and carbon dioxide. There are also small amounts of sulphur oxides, nitrogen oxides, and mineral acids (hydrochloric acid, when the PVC is combusted). If the combustion is incomplete the flue gases might contain significant amounts of carbon monoxide and unburned or partly burned organic materials; also polychlorinated dibenzo p –dioxin and dibenzo furan compounds of polyclinic organic matter, etc.
can appear in the flue gases. The flue gas has to be cooled-down in general to 230 – 370 °C, if the flue gas is discharged to mechanical equipment. There are at four methods for cooling it down (Niessen, 2010):
(i) By water evaporation, introducing water into the hot gas stream and evaporation occurs.
(ii) By air dilution, where the hot flue gas is diluted by air.
(iii) By heat withdrawal, which uses a convection boiler where heat is removed by steam generation and
(iv) Steam plumes by adding water during wet scrubbing. As a result the flue gas leaving the stack could contain significant amounts of water vapour, which will condense under certain atmospheric conditions resulting in a steam plume.
2.1.1.2 Fly ash treatment
Fly ash is the fine ash that becomes airborne within the primary chamber and either settles in the Incineration
Gasification
Pyrolysis
Flue gas
Fly ash Bottom ash
Syngas
Process/
equipment
Heat production/
heat exchanger Cleaning/
Filter Cleaning/
Conveyor belt
Electricity production/
Steam turbine Thermo chemical
WTE technologies Output
14
ducts and devices of the incinerator or ultimately becomes an inlet loading of particulate matter. Fly ash includes those rejected constituents that have been volatilised at the high temperature zones of the furnace and condensed as particulate. It may contain heavy metals and high molecular weight hydrocarbons (Niessen, 2010).
In the paper of Huang et al. (2011), for each tonne of MSW incinerated within a mass burn unit, 15 – 40 kg of hazardous waste is created which requires further treatment and landfilling as hazardous waste. This waste is usually part of the flying ash. The more significant amounts of heavy metals present in fly ash are Pb and Zn, when the raw material is MSW. Other very toxic organic compounds can be found in residue traces, namely polycyclic aromatic hydrocarbons (PAH), chlorobenzenes (CB), polychlorinated biphenyls (PCB) and polychlorinated dibenzo-p-dioxins (PCDD) and furans (PCDF) (Huang, et al., 2011).
Mechanical cleaning of the flue gas with the aim of collecting the remaining particulates is performed in an Electro-Static Precipitator (ESP). Part of flue gas (off-gas in terms of incineration terminology) leaving this unit is recycled back to the combustion chamber and the remaining part enters the block of off-gas cleaning comprising a dioxin filter (DEDIOX®) and a wet scrubber. This is an important feature of up–to–date incinerators as recycling contributes to decreasing the exhaust emissions‘ amount. Based on the lower off–gas flow-rate, the size of the unit forming the final part of the off-gas cleaning system is lower as well.
There are at least four technologies applied for acid gas removal: Dry neutralisation with Ca(OH)2 or with NaHCO3, semi-dry neutralisation with milk of lime, and wet scrubbings. All these listed technologies are dry treatments and are unable to ensure pollutant concentrations smaller than the regulatory limits (European directive 2000/76/CE: 10 mg/Nm3 HCl, 50 mg/ Nm3 SO2). Wet scrubbers are more powerful but they produce wastewater. Wet scrubbing plants are applied in downstream operations of dry neutralisation with Ca(OH)2 in order to strongly reduce both the amount of acid gases and the wastewater production. The flue gas cleaning system can affect the plant‘s electrical efficiency because of the heat losses related to the liquid water within flue gas.
The injection of liquid water is always present during semi-dry neutralisation. According to calculations this is one of the more disadvantageous technologies because drying leads to about 50 °C reduction in flue gas temperature (Grieco and Poggio, 2009).
In order to meet the regulatory requirements, the flue gas cleaning system needs to have been designed according to the specific environmental aspects of the plant. Dry ash for handling usually arrives along enclosed screw conveyors. These conveyors are low cost and efficient for handling the fine dust collected within the electrostatic precipitators (ESP) and bag housings (Niessen, 2010).
The latest are a device for air pollution control that removes particulates from the air or gas released
15 combustion for electricity generation.
2.1.1.3 Bottom ash treatment
Bottom ash is the non-combustible part of the waste that is a residue from incinerated waste. There are two systems for treating bottom ash. One is the wet system where the ash is immersed within water through the discharging end of the grate. The water quenches any burning materials and minimises the dusting. Water recovery is usually carried out by compression and passes up the discharge ramp. The final ash solid contains about 80 – 85 %. The second system is the dry system for bottom ash treatment. Quina et al. (2008) conducted an overview regarding municipal solid waste. A report was made concerning 11 municipal solid waste incinerators in England, where it could be seen that the bottom ash was around 25-30 % by weight of the waste put into incinerators.
The production of bottom ash was approximately 300 kg of waste per tonne of MSW. In regard to animal waste treatment at temperatures of 400 – 900 °C, the ash yield was 25.3 – 20.7 % for the swine manure, 43.6 – 30.2 % for the layer manure, 34.3 – 32.1 % for the cattle manure, and 8.4 – 7.5 % for the cornstalk (Huang et al., 2011).
Münster and Mainborn (2011) performed an optimisation of investment and production within the energy system. Their conclusion was that the best economic performance is achieved when incineration is applied of mixed waste, anaerobic digestion of organic waste, and gasification of part of the refuse derived at fuel.
2.1.2 Biological processes
During bio–chemical processes certain types of microorganisms convert the organic matter into fuel and residue. The better known bio–chemical processes are:
(i) Anaerobic digestion and (ii) Alcoholic fermentation and (iii) Microbial fuel cells.
In the process of anaerobic digestion a set of micro-organisms convert the organic waste or biomass to biogas and solid residue. The main components of biogas are CH4 and CO2 but it also contains traces of hydrogen, ammonia, and carbon oxide. The solid residue can be used as fertiliser but other treatment, even WTE technologies, are also known.
Biogas is a mixture of methane (50 – 75 % vol), CO2 (25 – 50 % vol) and other gases such as N2, O2, H2, NH3, H2S (<1 % vol ) (Goswami, 2008). The raw biogas requires cleaning. The more basic cleaning includes cooling and drying after production. Usually, it has to be cleaned in regard to the content of hydrogen sulphide (H2S). The H2S content in biogas, at levels higher than 300 – 500
16
ppm, damages the energy conversion equipment. Today biological cleaning reduces the content of hydrogen sulphide to a level below 100 ppm (Holm-Nielsen et al., 2009).
Biogas can be utilised either raw or upgraded. There are several utilisation options:
(i) Production of heat and/or steam (the lowest value chain utilisation).
(ii) Electricity production with combined heat and power production (CHP).
(iii) Industrial energy source for heat, steam and/or electricity and cooling.
(iv) Upgraded and utilisation as vehicle fuel.
(v) Production of chemicals and/or proteins.
(vi) Upgrading and injection into the natural gas grids (vii) Fuel for fuel cells.
A remarkable example of upgrading biogas and using it for vehicle fuel is in Sweden, where the market for such biogas utilisation has grown rapidly over the last decade. There were 15,000 vehicles driven in 2009 on upgraded biogas in Sweden, and the forecast is of 70,000 vehicles, running on biogas supplied from 500 filling stations, by the years 2010 – 2012. As biogas cannot always be used near production facilities and within farming areas, injecting upgraded biogas into the natural gas grids widens up the opportunities for transporting and utilising biogas within the larger energy consumption areas, where the population concentration is situated.
Biodegradable wastes contain carbohydrates that could be converted into sugar. Fermentation is an anaerobic procedure, where the microorganisms, mainly yeast, convert the sugar into alcohol called bioethanol which is used as fuel. Bioethanol can be used as vehicle fuel as a 5 % blend with petrol, which does not requires engine modification. With engine modification a bioethanol can be used at higher levels, for instance 85 % of bioethanol (Demirbas, 2007).
The biodiesel is based on vegetable oil and animal fat and is an alkyl (methyl, ethyl, propyl) ester. It can be used itself as a fuel, or in a mixture with petroleum–based diesel in different ratios. There are some concerns that raw materials for biodiesel production may compete with food production, for this reason the best option is to use the waste raw materials as food residues for biodiesel production (Demirbas, 2011).
The biodegradable waste contains carbohydrates that can be converted into sugar. Fermentation is an anaerobic procedure where the microorganisms, mainly yeast, convert the sugar into alcohol called bioethanol and used as a fuel.
In microbial fuel cells microorganisms convert acetic acid to CO2, protons and electrons on the anodes of the cell. Acetic acid is a product of waste fermentation. Protons and electrons form hydrogen on the cathode side of the fuel that is then used as cleaner fuel for vehicles. The anode and cathode are kept separate using an ion-exchange membrane.
17
An overview is presented in Figure 5 of the main bio-chemical WTE technologies, their outputs and their utilisation in the processes.
Anaerobic digestion
Alcohol fermentation
Biodiesel production
Bio chemical WTE technology
Output
Biogas
Bioethanol
Biodiesel Solid residue
Liquid residue
Heat and electricity production /
CHP unit
Fertilizing/
? Process/
equipment
Fuel burning/
car?
Figure 5: Outputs and its treatment/ utilisation of bio–chemical WTE processes
2.2 Geothermal Energy
A geothermal energy is the heat contained in the Earth‘s interior. Commonly, there are two types of well, the high-temperature (above 150 °C) and low- temperature (below 150 °C) (Barbier, 2002).
The geothermal utilisation can be divided into two categories: (i) electric energy production and (ii) direct uses. Conventionally, the high temperature well is used for electric energy production, while from the low temperature well the heat is used directly. However, also an in-between solution can be obtained by applying organic Rankine cycle (this is a case, when the outlet temperature of the geothermal fluid is usually above 85 °C. An example of utilisation of Rankine cycle, combined with the gathering heat tracing (GHT) station and the oil recovery system when oil well are used as geothermal wells and geothermal power plants is presented by Li et al (2012). Applying this combined system 8,163 t of oil is saved and about 34,600 t/y of oil is recovered per year in a case study presented. Therefore, even when covering only part of the fuel needs a significant improvement by integration renewable energy sources might be obtained.
When developing generation of electricity from geothermal source, 50 % of total cost is related to identification and characterisation of reservoirs and mainly, to the drilling of production and reinjection wells, 40 % goes to power plants and pipelines and 10% to other activities (Barbier, 2002).