DOI: 10.1556/606.2018.13.2.11 Vol. 13, No. 2, pp. 107–116 (2018) www.akademiai.com
DESIGN RAINFALL ANALYSIS TOOL FOR URBANIZED AREAS IN SLOVAK REPUBLIC
1 Dušan RUSNÁK, 2 Štefan STANKO, 3 Mária TROŠANOVÁ
1,2,3
Department of Sanitary and Environmental Engineering, Faculty of Civil Engineering Slovak University of Technology in Bratislava, Radlinského 11, 810 05 Bratislava, Slovakia
e-mail: 1dusan_rusnak@stuba.sk, 2stefan.stanko@stuba.sk, 3maria.trosanova@stuba.sk Received 9 January 2018; accepted 27 February 2018
Abstract: Assessments of sewer systems are key tools in verification of sewer hydraulic capacity. Rain sewers and combined sewers are most susceptible regarding system overload and so while assessing them; proper choice of design rainfall is inevitable. The calculation of design rainfall is time-consuming and inefficient and that was the reason that leads to development of design rainfall analysis tool in order to minimize the length of the calculation process of design rainfall. The tool incorporates calculation of design rainfall depending on the specified area of interest within Slovakia and chosen periodicity, allows block rain, reduced block rain and synthetic rain to be calculated with the possibility of their mutual comparison, and also serves to generate background data for further use in form of portable document format and excel files.
Keywords: Design rainfall, Analysis tool, Urbanized area, Rain sewer
1. Introduction
The functionality of sewer networks can be verified by monitoring them as well as by modeling the unfavorable situations that may occur during their existence at mathematical level. This option is provided by existing software solutions that allow performing sewer network hydraulic assessments [1]. In sewage networks, the literature itself assigns almost double the increase of the pipeline capacity flows and thus assures sufficient flow capacity of the sewerage network even in the prospective state.
Excluding sewage networks, far more significant changes occur in the rain and
combined sewer networks. In this case the calculation of the surface, which amount depends on the intensity of the rainfall, the size of the basin, the surface, slope of the terrain and the topology of the area is necessary. In the case of hydraulic assessments, it is possible to use different mathematical models; the easiest way to divide them is into static models (e.g. SeWaCAD, which uses reverse methodology of sewer networks design) and hydrodynamic models (models that allow users to monitor real-time flows in pipelines - e.g. Storm Water Management Model (SWMM) and MOUSE model of MIKE Urban [2], computational software from Danish Hydraulic Institute (DHI) company.
2. Design rainfalls
While assessing combined sewer networks, sewage water flow is negligible at times of intense rain, and the design rainfall is used to determine the design flow. In hydrodynamic modeling, it is also important to include spatial variability of the area.
[3]-[6]. Design rainfalls can be simply categorized into 2 groups - historical and mathematical rainfalls.
3. Historical rainfall
Historical rainfalls represent real - measured - rainfall events that were recorded during the review period in the area of interest. These rainfalls are individually evaluated and further used in hydraulic sewer network assessments, but they can also be used as long-term continuous simulation, including dry periods between rainfall events [7]. Mathematical rainfall can be further classified into 2 groups, namely block rainfall and synthetic rainfall.
4. Block design rainfall
Block design rainfalls have the simplest yet the least realistic character. They have constant intensity throughout their entire duration. In order for them to be used in sewer network assessments, block rainfall must be converted using mathematical calculations into rainfall curves - they have a constantly decreasing intensity over time. Formulas for rainfall curve calculations for Slovak basin have been described by several authors but currently the simplified form Eq. (1) for the timespan of design rainfalls ranging from 15 to 120 minutes and the rainfall periodicity within range of 0.1 and 5, is in the use,
−1
+
⋅
=K t B
q a , (1)
( ) ( )
115⋅15+ ⋅ − − ⋅1− −
=q p D D
K β γ , (2)
β1
β⋅ −
= p
B , (3)
α1
α p
a= ⋅ , (4)
where: q15 is the intensity of 15 minute rainfall in l.s-1.ha-1 for chosen area of interest; p is the chosen periodicity of rainfall; α, α1, β, β1, γ, D are the local parameters based on statistical measurements from 68 ombrographical stations throughout Slovakia.
With the mentioned static computational model, the block and reduced block rainfalls are used in computation due to their application using the rational method of sewer system design. The usage of hydrodynamic models allows introducing design rainfall as a boundary condition for individual sewerage districts, with the possibility of designing your own rainfall event. The use of block rain in this case is not recommended as it describes the event with constant intensity though entire duration, which is not at all similar to real-life event.
5. Synthetic design rainfalls
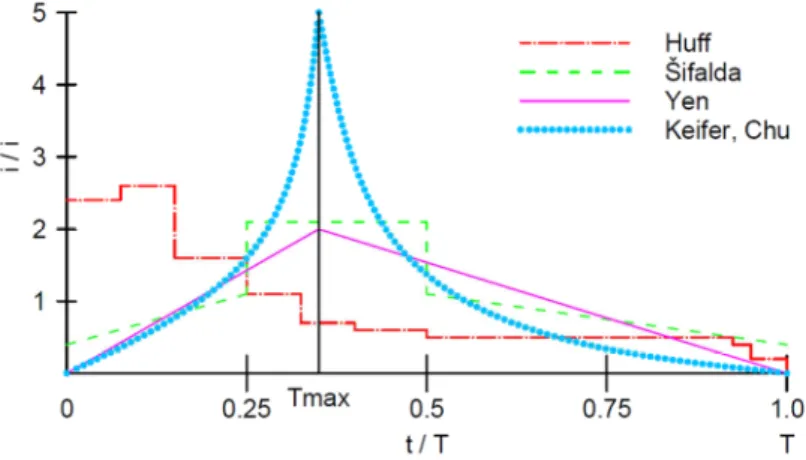
Synthetic design rainfalls with time-varying intensities simulate the variable course of intensities in the time course of real rain. Synthetic rain represents synthetic hyetographs in order to achieve more accurate design solutions compared to more detailed computational methods that describe in detail surface rainfall and mathematically simulate non-stationary flow in the sewer network. The intensity profile depends mainly on the type of rainfall. The profile of the synthetic rain is characterized by its peak, which is defined as the ratio of the maximum intensity of the synthetic rainfall and the average intensity related to the whole duration, as well as the time position of the maximum intensity.
Synthetic rainfalls can be divided into categories depending on their author characterized by varying yield curves. Some of the synthetic rainfalls are (names based on their authors): Huff [8]; Keifer and Chu [9]; Šifalda [9]; Yen [9].
Trends of yield curves by individual authors are displayed in Fig. 1.
In case of synthetic rainfalls by Huff, Šifalda and Yen, rainfall yield is dependent on ratio of maximal and average intensity in given time. Keifer and Chu yield is calculated separately for inclining and declining part of the curve based on following formulas:
( )
2 1
−
+
−
⋅
−
⋅
− +
⋅
⋅
= B
r t t r
t a t
B K k I
a v a
V v , (5)
( )
2 1
1 1
−
+
−
⋅ −
−
⋅ −
− +
⋅
⋅
= B
r t t r
t a t B K k I
a v a
Z v , (6)
T r
tv= ⋅ , (7)
where T is the total rainfall duration; r is the allocation of maximal intensity of entire rainfall; k is the unit conversion (1.0 l.s-1.ha-1; 0.36 mm.h-1; 0.006 mm.min-1); K, B, a are parameters of block rainfall curve.
Fig. 1. Yield curve trends by individual synthetic rainfall authors
6. Analytical software - DATER
The Decisive Analytical Tool for Effective Rainfall (DATER) program serves as an effective tool for calculating and deciding on design rainfalls within urbanized areas, which serve as the basis for designing and assessing sewer systems and their objects.
The program includes a comprehensive database of long-term measurements from 68 ombrographic stations in Slovakia, on the basis of which it is possible to plot the yield curves of block and synthetic rainfall for any location on the territory of Slovakia. Due to the fact that data forming the database have been measured during the mid-20th century, the program allows the user to simulate an increase in the maximum intensity of design rainfall. The program uses the built-in EXCEL software features and Visual Basic for Application (VBA) programming language to help the user to evaluate the input values and make real-time export of data in form of PDF and additional XLS files.
DATER works on an Excel basis and does not require any additional plug-ins for its functionality. Program has been tested with EXCEL version 2013 and further.
7. User interface
The Decisive Analytical Tool for Effective Rainfall (DATER) program was created using macros using the Visual Basic for Application (VBA) programming language, so it cannot be used without allowed macros in excel interface. The script does not contain
any macros that could damage the user’s system in any way, the only external action of the program is to write PDFs and XLS files to a predetermined location and create a folder in the directory where the program is located. However, this is a preceded by the prompt for the user. By enabling the program macros, an iterative calculation is initially triggered that allows the computation of reduced block rainfall curves, and the decimal separator is selected as a dot (these functions are returned to the original settings automatically before the program stops). At the beginning of the macros, the appearance of the program is also set to be as the ‘DASHBOARD’ form (also possible by pressing the CTRL + SHIFT + D keys together) to disable the user’s command line, column names and line names, and sheet grid - none of the features are necessary for the user. It is also recommended to turn off the Excel ribbon bar attachment by pressing CTRL + F1 (aesthetics only). In order to return everything to the original state, press CTRL + SHIFT + E (switch on the command line, row names and column names, and sheet grids).
In the upper bar of the program, the user sees the individual values for the calculation, including the desired rainfall periodicity and in the brackets also its verbal meaning, the area of interest for which the calculation is performed, the type of area of interest whether it has or does not have its own ombrographic station, the selected duration of rain, the value of the parameter ‘r’ determining the position of the maximum intensity for each of the synthetic rainfalls based on the Slovakia’s map of isolines and in the case of the increase of the intensity of the design rainfall, also the value that was included in the calculation. The bottom section contains links to individual program sheets that allow users to navigate between the sheets of the program. The upper section of the user interface is shown in Fig. 2
Fig. 2. User interface of DATER upper section
8. Input data
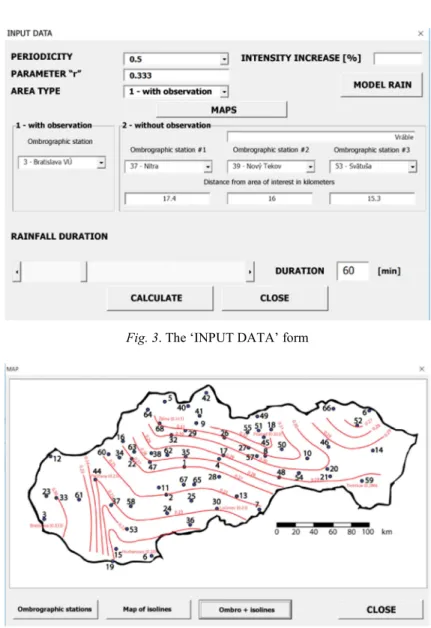
A form called ‘INPUT DATA’ was created for user to change the input values (Fig. 3). Input values are to be change only with this form; the upper section of user interface only includes reference values that have only informative character to the user.
The first item in the form is the rain periodicity. Periodicity can be selected as one of the 10 predefined values ranging from p = 0.01 (rain probability once every 100 years) to p = 5 (rain probability 5 times within 1 year). In the upper right corner, user can change the values in the database by the amount of % selected for this calculation. If the user does not want to change the intensity, the item is left blank. Parameter ‘r’ is based on the Slovak map of isolines and represents the position of the maximum yield of the synthetic design rainfall. The map of the isolines and also the map of the ombrographic stations of Slovakia are included directly in the program and it can be seen in Fig. 4.
Fig. 3. The ‘INPUT DATA’ form
Fig. 4. Combined map of isolines and ombrographic stations in Slovakia
The window allows the user to choose between the map of the ombrographic stations of Slovakia, the map of the isolation of Slovakia or a combination of both of them. In the area type, the user chooses one of the two options - either the locations have their own ombrographic observations or not. If the option ‘1 - with observation’ is selected, only the values from the left side of the table where the user only chooses the desired ombrographic station are included in the calculation (Ombrographic stations can also be found in the map in Fig. 4). In the case of option ‘2 - without observation’, the user uses the right side of the table where he has to select the 3 closest ombrographic
stations from the location and assigns the distance for each of the stations from the area of interest in kilometers. The program further interpolates between these values.
The user determines the duration of the rainfall for the calculation himself changing it either numerically or using slider. This serves, for example, for hydrodynamic models which allow the calculation of flows for different simulation lengths.
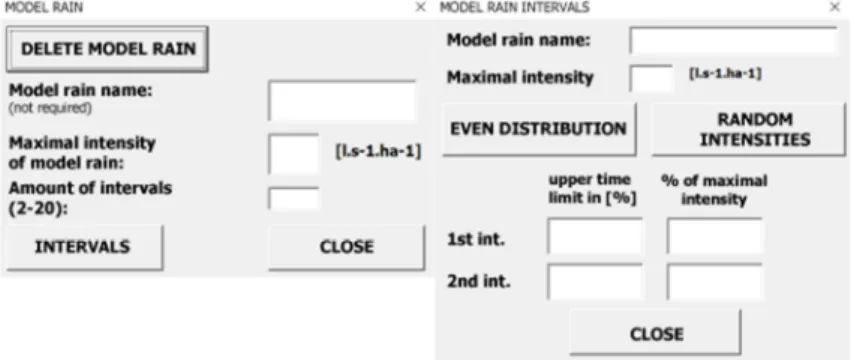
Due to the progression of synthetic rainfall curves and monitoring their intensity at individual intervals the possibility of creation of their own rainfall has been created. The
‘INPUT DATA’ form contains a reference to the ‘MODEL RAINFALL’ form (Fig. 5) where it is possible to choose a custom design rainfall not based on the database. The user has the option of assigning the name to this rain, choosing its maximum intensity in l.s-1.ha-1 and the number of intervals into which the rain will be divided. Intervals serve as time sections in which the rain reaches the predefined intensity ration. After selecting the input values, the interval selection is followed by the opening the window depending on the number of desired intervals. The name and maximum intensity of rain are used as reference values, but they can also be changed directly in this window. The user has the option of splitting time intervals according to his own choice (the value entered in the left column is used to allocate the upper limit of the interval, and the last line must contain value 100), or may allow the program to divide the intensity evenly throughout entire rainfall. The rainfall intensity is chosen as a percentage of the maximum (of user predefined value), the user can also choose the values for the individual intervals himself, or user can use the possibility of random allocation of all intensities.
Fig. 5. Model rainfall creation
After selection of the rainfall, the user returns to the INPUT DATA’’ form by closing the window. After selecting the desired data, user presses the button to calculate.
The calculation time, depending on the computer’s parameters, may take from several seconds up to several minutes. The conversion involves approximately 2000 iterations (especially due to the character of the reduced block rain calculation), and it is recommended (but not required) for the calculation to take place on a computer with an Solid-State Drive (SSD) disk and at least 8 GB of Random Access Memory (RAM) (or just enough of the physical memory to not exhausted by the running processes of the computer).
The program includes a ‘HISTORICAL RAINFALL’ sheet which allows the insertion of measured historical rainfall data that can be used to compare the curves and characteristics of measured rainfalls with calculated mathematical ones. The user has the ability to enter up to 10 historical rains at the same time. For the calculation, the user has to set the rainfall in the t-q curve format where t represents the time in minutes from the beginning of the event and q represents the rainfall intensity in l.s-1.ha-1. The date range must be continuous and the rainfall duration must be at least 15 minutes and no more than 180 minutes long. The program produces results in the form of graphs and tables where the names are dynamically altered and therefore the user can characterize the measured rainfall (e.g. date, time, location or similar, preferably descriptive names).
If the historical rainfall is entered in the correct format, the whole calculation is calculated on the duration of the historical rainfall rather than the rainfall duration selected in the ‘INPUT DATA’ form.
9. Program results
After the calculation, the program produces the results in the form of a table in the
‘SUMMARY’ sheet, which contains the characteristics of the selected rain, e.g. the basic curve parameters K, B, a from, which the design rainfall has been calculated, the maximum intensity of the rainfall [l.s-1.ha-1], location of maximal intensity (in minutes), average rainfall intensity [l.s-1.ha-1] and total surface runoff from an area of 1 hectare over the entire rainfall duration [m3.ha-1]. For historical rains, the maximum intensity of the strongest rainfall events is highlighted in the table and also the rainfall with the largest total surface runoff. The ‘SUMMARY’ sheet contains both tabular and graphical results. Graphs are created using the combination of pivot tables and pivot charts and the application of the slicers that allow dynamic and, in particular, rapid change of graphical outputs by choosing the desired variables. In the ‘SUMMARY’ sheet, only the rainfall of the selected periodicity is given at the beginning, but it is possible to observer the same data for all other periodicities with the possibility of their mutual comparison.
The program also generates graphical outputs for the curves of individual rainfalls.
These outputs can be viewed in the ‘GRAPHS’ sheet. The sheet contains separate block rainfall curves for a selected periodicity, synthetic rainfalls for the selected periodicity, combinations of block, synthetic and historical rainfall curves for the selected periodicity, separate historical rainfall curves, and eventually a combination of all rainfalls included in the calculation for all periodicities. Each graph is has slicer that allows the user to filter the search for desired curve or curves for a simple comparison between them.
10. Data export
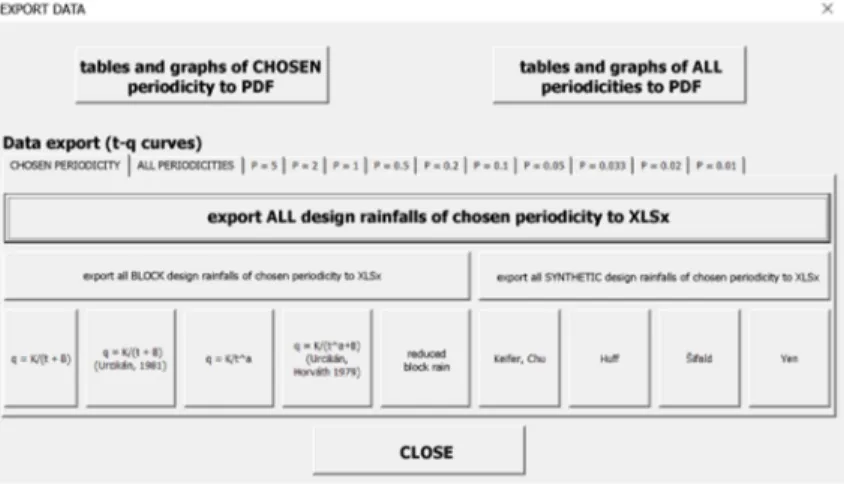
The program allows user to quickly export results in PDF and XLS files format.
This is provided by the ‘EXPORT DATA’ form (Fig. 6) located in the upper section of the user interface under the ‘EXPORT DATA’ button. This form allows users to export
calculated data to PDF files from the selected periodicity or all periodicals at the same time. The program saves PDFs and creates a directory in the folder where the
‘DATER.xlsm’ file is saved. The directory name is selected according to the name of area of interest, if the directory with the name already exists, the PDF simply creates and saves it with the name format: ‘LOCATION p=X date.pdf’ for example: ‘Bratislava p=0.5 26-May-2017.pdf’.
Fig. 6. ‘EXPORT DATA’ form
The form also allows user to export t-q curves for each rainfall to XLS for further use e.g. in mathematical models where they serve as input data. The user has the option of exporting either selected individual curves separately or multiple curves (e.g. all block or all synthetic rainfalls), or exporting all the curves of all rains at a time.
Exporting data creates a separate XLS file by creating a ‘Data_export’ subfolder in the project name folder (depending on the name of chosen area of interest). If this subfolder does not exist, it is automatically created and the files are stored in it.
11. Conclusions
This article describes software - a tool for calculating and analyzing design rainfall in used to assess and design sewer networks in Slovakia. The program was developed to accelerate and facilitate the calculation of rainfall curves, their parameters and the calculation of the basic rainfall characteristics. The program also includes the ability to generate user’s own rain event. The results of the calculation can be applied to design rainfall but also as a basis for hydrodynamic simulation of sewer networks. The use of the program eliminates the time required to search through database and allows user to calculate curves immediately. The next step is to create a script to speed up the creation of tabular data entered as input values into hydrodynamic models - e.g. MIKE URBAN, where the choice of simulation length and rainfall location will be applied.
Acknowledgements
This article was created with the support of the Ministry of Education, Science, Research and Sport of the Slovak Republic within the Research and Development Operational Programme for the project ‘University Science Park of STU Bratislava’, ITMS 26240220084, co-funded by the European Regional Development Fund and by the Slovak Research and Development Agency under the contract No. APVV-0372-12.
References
[1] Julínek T., Říha J., Assessing stream water quality influenced by storm overflows from sewers, Pollack Periodica, Vol. 12, No. 2, 2017, pp. 117‒128.
[2] Rusnák D., Stanko Š., Škultétyová I., Rain model - boundary condition in sewer network appraisal, Pollack Periodica, Vol. 11, No. 2, 2016, pp. 105‒112.
[3] Peleg N., Blumensaat F., Molnar P., Fatichi S., Burlando P. Partitioning the impacts of spatial and climatological rainfall variability in urban drainage modeling, Hydrol. Earth Syst. Sci, Vol. 21, 2017, pp. 1559‒1572.
[4] Bruni G., Reinoso R., van de Giesen N. C., Clemens F. H. L. R., ten Veldhuis J. A. E. On the sensitivity of urban hydrodynamic modeling to rainfall spatial and temporal resolution, Hydrol. Earth Syst. Sci, Vol. 19, 2015, pp. 691‒709.
[5] McRobie F. H., Wang L. P., Onof C., Kenney S. A spatial-temporal rainfall generator for urban drainage design, Water Science and Technology, Vol. 68, No. 1, 2013, pp. 240‒249.
[6] Ochoa-Rodriguez S., Wang L. P., Gires A., Pina R. D., Reinoso-Rondinelet R., Bruni G., Ichiba A., Gaitan S., Cristiano E., van Assel J., Kroll S., Murlà-Tuyls D., Tisserand B., Schertzer D., Tchiguirinskaia I., Onof C., Willems P., Veldhuis M. C. Impact of spatial and temporal resolution of rainfall inputs on urban hydrodynamic modeling outputs: A multi- catchment investigation, Journal of Hydrology, Vol. 531, Part 2, 2015, pp. 389‒407.
[7] Urcikán P., Rusnák D. Sewer systems and wastewater treatment I, In: Design of sewer systems, (in Slovak) Slovak University of Technology in Bratislava, 2004, pp. 210‒215.
[8] Huff F. A. Time distribution of rainfall in heavy storms, Water Resources Research, Vol. 3, No. 4, 1967, pp. 1007‒1019.
[9] Arnell V. Analysis of rainfall data for use in design of storm sewer systems, Chalmers University of Technology, Göteborg, 1978.