0139–3006 © 2018 The Author(s) DOI: 10.1556/066.2018.47.1.13
MEASURING OF FOOD ADDITIVES VIA POLYETHYLENE FOILS BY NIR SPECTROPHOTOMETERS USING DIFFERENT OPTICAL
ARRANGEMENTS
J. SLEZSÁK, É. SZABÓ, S. GERGELY and A. SALGÓ*
Department of Applied Biotechnology and Food Science, Budapest University of Technology and Economics, H-1111 Budapest, Szent Gellért tér 4. Hungary
(Received: 9 June 2017; accepted 11 September 2017)
Near-infrared (NIR) spectrophotometers with different optical arrangements were used to measure the diffusely refl ected electromagnetic radiation of different types of food additives in polyethylene (PE) foils. Eight compounds, frequently used in food process – but also in other industries –, were measured by different NIR spectrophotometers.
The detected (‘as is’) and mathematically transformed (by scatter correction, second derivative combined with smoothing) NIR spectra were processed with multivariate data analysis (MDA). In this matter, unsupervised methods like principal component analysis (PCA) and cluster analysis (CA) were used, which techniques do not require prior information and reference measurements. The aim of the present study was to distinguish food additives by the help of the applied chemometric methods based on NIR spectra detected via the PE foils. Results indicated that distinction of different food additives and compounds with NIR methods is possible not only with the conventional sample preparations and handlings, but also without breaking the packaging.
Keywords: near-infrared spectroscopy, PAT, chemometrics, principal component analysis, cluster analysis, polyethylene foils
The new concept of quality management is Quality by Design (QbD), which is continuously spreading in several sectors, including food industry. Compared to the previous quality management paradigms, the QbD represents a bold and effective innovation: the quality of the products and the risk estimation should be achieved by a holistic, proactive process design instead of post-production testing (VANDEN BERG et al., 2013). To comply this intent, QbD is necessary to apply effi cient, real-time, and high throughput analytical tools in the whole production process in any industry (RATHORE et al., 2010). These analytical tools are included in the Process Analytical Technologies (PAT), which is originally introduced in pharmaceutical industry. Nevertheless, it is more diffi cult to accomplish the QbD in food process because of the high degree of variation in the complex chemical mixture of components in the food industry (RATHORE & KAPOOR, 2016). As a consequence, implementing the PAT concept into food industry even more accurately, requires the use of analytical tools, which allow the highly effi cient, rapid, and preferably non-destructive assays (and which may be even suitable for qualitative or quantitative analysis, too) along the entire process (VAN DEN BERG et al.,
* To whom correspondence should be addressed.
Phone: +36-1-463-1477; fax: +36-1-463-3855; e-mail: salgo@mail.bme.hu
This is an open-access article distributed under the terms of the Creative Commons Attribution 4.0 License, which permits unrestricted use, distribution, and reproduction in any medium for non-commercial purposes, provided the original author and source are credited.
2013). This requirement can successfully be met by the recently used spectroscopic methods, including fl uorescence, ultraviolet-visible absorption (UV-VIS), near-infrared (NIR), (mid- or so-called analytical) infrared (IR), and Raman spectroscopy (SKIBSTED & ENGELSEN, 2010).
Furthermore, suitable data analysis and chemometrics are needed to get the most out of the analytical data of these techniques (KHAKIMOV et al., 2015).
The most common of the spectroscopic PAT tools are NIR and Raman spectroscopy, which can complement each other regarding the analytical information that may be obtained.
However, Raman spectroscopy has different disadvantages, which may limit its widespread application as a PAT tool in food industry. The weakness of the Raman effect and the low sensitivity make it diffi cult to measure substances in low concentration or detect compounds in a complex chemical matrix like food materials, besides the heat of the intensive laser radiation can impair the sample. In addition to these, the high cost of Raman equipment can also restrict its usage (ROMERO-TORRES et al., 2010). For this reason, it can be a better choice to use NIR spectroscopy for identity testing or process monitoring. This may result in its frequent use as a food industrial PAT tool in several sectors, e.g. meat industry (RU & GLATZ, 2000), dairy industry (MUNIR et al., 2015), but it is also used for many applications in agriculture or measuring of vegetables and fruits (SHAH et al., 2016), withal the applicability of NIR methods is spreading owing to the continuous research in terms of both hardware (the equipment) and software (the data analysis).
In many cases, food producers intend to check the identity of delivered food additives or raw materials without breaking the packaging – this idea is in line with the principles of QbD.
The demand of the identity check through the primary packaging has already arisen in pharmaceutical industry, and experiments have been performed to demonstrate the applicability of NIR spectroscopy for this purpose – but only using Fourier transformed near- infrared (FT-NIR) spectroscopic methods (ULMSCHNEIDER & PÉNIGAULT, 2000; RODIONOVA et al., 2009).
In this research, the authors have attempted to use different NIR spectrophotometers with different optical arrangements to distinguish food additives with recording the NIR spectra via PE foils. If the distinction is possible based on the NIR data thus obtained, bypassing or complementing as a quick fi lter method the conventional procedure, then it means that its application possibilities are expanding as an effective PAT tool in the food industry.
1. Materials and methods
1.1. Investigated compounds
Eight compounds (starch, lactose, glucose, polyacrylic acid, ascorbic acid, citric acid, cetyl stearyl alcohol, talc) were obtained for the investigation. Choosing the samples was justifi ed by the following reasons: fi rstly, these are frequently used materials in food industry (as sweeteners, pH control agents, preservatives, etc.) that are accessible, secondly, this sample list contains varied compounds with varied chemical bonds or functional groups, which allows to obtain information about both the sensitivity and robustness of the method.
1.2. Used PE foils
Five PE foils with different thickness (19 μm, 30 μm, 35 μm, 60 μm, and 70 μm) were used to model the industrial conditions for identity check in the laboratorial environment (see below).
1.3. NIR spectroscopic methods
Each sample was measured in diffuse refl ectance mode with three NIR spectrophotometers using different optical arrangements.
1. NIR spectra were recorded using a NIRSystems 6500 spectrophotometer (Foss NIRSystems Inc., Silver Spring, MD, USA) fi tted with a Rapid Content Analyser (RCA) with ceramic reference and PbS detector. Data collection were performed with an interval of 2 nm in the 1100–2498 nm wavelength range, and 32 scans were recorded for each spectrum using Vision 3.20 software (Foss NIRSystems Inc., Silver Spring, MD, USA).
2. FT-NIR spectral data were collected with a Spectrum 400 spectrometer (PerkinElmer Inc., Waltham, MA, USA) using Near-Infrared Refl ectance Accessory (NIRA) with gold- coated reference and InGaAs detector. Data were collected with an interval of 2 cm–1 in the wavenumber range 10 000–4000 cm–1 (i.e. wavelength range 1000–2500 nm). Measurements were performed with Spectrum 6.3.2 software (Perkin Elmer Inc., Waltham, MA, USA).
3. DA 7250 NIR Analyzer with Results Plus 3.3 software (Perten Instruments AB, Hägersten, Sweden) was used for the detector-array (DA) investigations. DA measurements were carried out in the range 950–1650 nm, with a spectral step of 2 nm using Tefl on-covered ceramic reference and a thermoelectrically cooled 256-element InGaAs detector.
1.4. Sample handling
Every sample was scanned in two ways to represent the industrial conditions with performing the NIR investigations.
Firstly, spectra were recorded with the conventional method without PE foil covering using sample holder. For this purpose, Loose Powder Sample Holder (Foss NIRSystems Inc., Silver Spring, MD, USA) was used for the NIRSystems 6500 and the Spectrum 400 spectrophotometers, and a Small Sample Cup (volume is 22 ml, Perten Instruments AB, Hägersten, Sweden) was used for the DA 7520 NIR Analyzer. These measurements were needed to obtain spectral data about the specifi c absorption bands and spectral characteristic of the investigated compounds.
Secondly, NIR spectra were recorded through the PE foils. It was implemented by the followings: each PE foil was placed under the sample holder (for the NIRSystems 6500 and the Spectrum 400 instrument), and the fi lled sample cup was covered with the PE foils (for the DA 7520 NIR Analyzer).
Three parallel independent subsamples from the same batch were measured with both sample handling ways.
1.5. Data analysis
Statistica 64 13.1 (Dell Inc., Tulsa, OK, USA), The Unscrambler X 10.3 (CAMO Software, Oslo, Norway), and Microsoft Excel 2013 (Microsoft Corp., Redmond, WA, USA) software were used for data processing. Second derivative combined with smoothing (NORRIS, 1983) and multiple scatter correction (MSC) (GELADI et al., 1985) were performed in the interest of attempt to increase the effectiveness of the methods. Principal component analysis (PCA) with the fi rst three principal components (PC) and cluster analysis (CA) with 1 – Pearson correlation (r) and Ward’s method were used to implement the distinction of NIR spectra of the different materials.
1.5.1. Principal component analyses (PCA). PCA is the customary method for data compression by using orthogonal matrix decomposition. In general, factorial methods are aimed at projecting the original data set from a high-dimensional space to a few transformed coordinates only. So-called score plots can be used for a graphical presentation of sample groupings (HEISE & WINZEN, 2002).
1.5.2. Cluster analyses (CA). Distances or similarity measures are used for CA, where objects are aggregated stepwise based on the similarity of their spectral features. Informative dendrograms can be obtained from a hierarchical CA, in which the distances between the clusters are depicted graphically. We tested four possibilities by the application of the CA combining the settings of linkage distance (1 – Pearson r or Euclidean distances) and the amalgamation (linkage) rules (single linkage or Ward’s method) (HEISE & WINZEN, 2002).
2. Results and discussion
2.1. Raw spectra
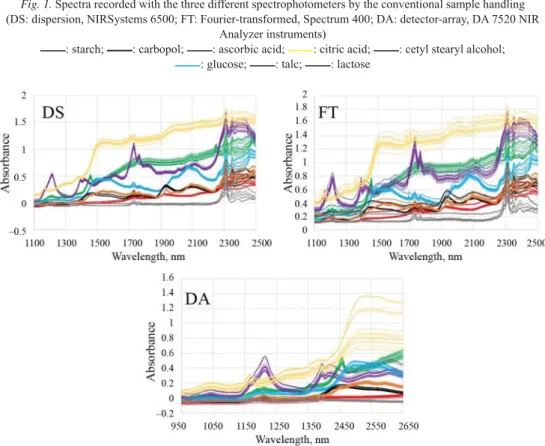
Raw (‘as is’) spectra of the investigated compounds obtained with the three different spectrophotometers are shown in Figure 1. These spectra were obtained in the way that data were recorded not through the PE foils, but with the use of the sample holders with the conventional method. Therefore (as it can be seen), each measurement resulted in well- characterized spectrum in the NIR region. This confi rms the applicability of the three investigated NIR techniques in identity testing, because each spectrum of the materials has specifi c absorption bands, which makes the results a chemical and physical fi ngerprint. The spectra recorded via the PE foils can be seen in Figure 2. As shown, differences between the spectra of compounds predominantly remain regardless of measuring through the foils or not.
The specifi c absorption bands and the NIR spectral characteristic of the materials have mostly not disappeared due to the fact that data were recorded through the foils. The exception to this is only the higher (2270–2500 nm) wavelength region, in which the absorption of spectra increased. This can be explained by the absorption of the PE foils in this region, which comes from the combination bands of C–H and C–C bonds originating from the foils (SNAVELY &
DUBSKY, 1995). It is also discernible that the absorbance of the spectra has trends in this region, since the absorbance is proportional to the foil thickness within the spectra of each compound. For the spectra recorded with the DA 7520 NIR Analyzer, this effect does not occur, because of the lower wavelength range. Due to the fact that spectra are characteristic even if recorded via the PE foils, it can be attempted to distinguish the compounds with chemometric methods based on the data obtained through the foils. Expediently such an unsupervised pattern recognition tool as PCA or CA can be used successfully for this purpose.
Fig. 1. Spectra recorded with the three different spectrophotometers by the conventional sample handling (DS: dispersion, NIRSystems 6500; FT: Fourier-transformed, Spectrum 400; DA: detector-array, DA 7520 NIR
Analyzer instruments)
: starch; : carbopol; : ascorbic acid; : citric acid; : cetyl stearyl alcohol;
: glucose; : talc; : lactose
Fig. 2. Spectra recorded through the PE foils – legend as seen in Figure 1
2.2. PCA and CA for the NIR spectra of NIRSystems 6500
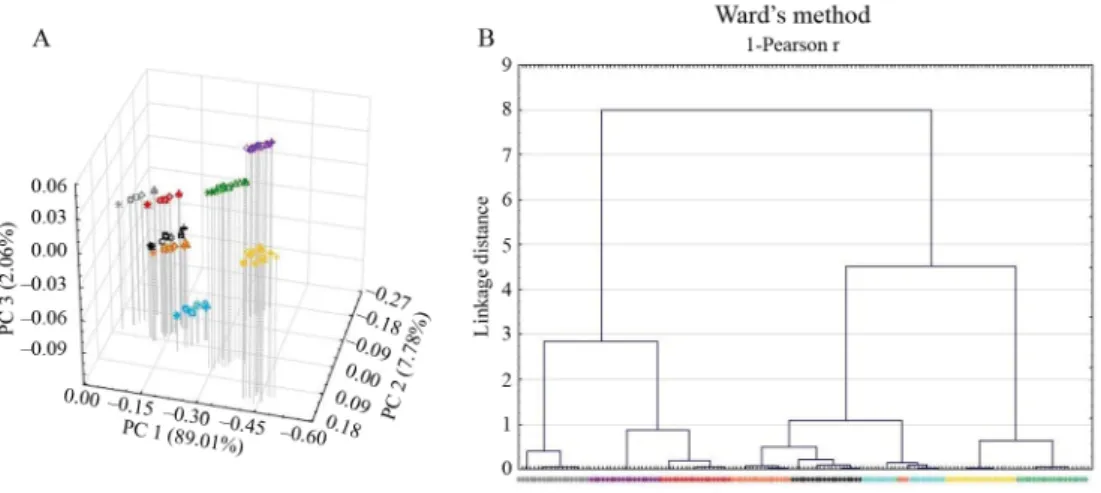
Results of PCA and CA performed with the raw spectra recorded with the NIRSystems 6500 spectrophotometer can be seen in Figure 3. For the PCA, if the fi rst three principal components are depicted as a function of each other, the scores are mostly grouped according to the materials (because of most of the variance of the spectra comes from the chemical difference between the investigated compounds). Similarly, the dendrogram illustrates that the clustering is fairly effi cient with the spectra recorded through the foils. Nevertheless, both PCA and CA have shortcomings. On the score plots, a lineal pattern (which is related to the foil thickness) can be seen, and the clustering is imperfect, too (e.g. classifi cation of different compounds among each other), which makes it impossible or at least makes it diffi cult to distinguish the materials based on those spectra. Therefore, as long as the defi ciency of distinction is associated with the “foil effect”, the solution could be reducing the wavelength range of the analysis by leaving out the polyethylene absorption bands (2270–2500 nm). The PCA and CA results for the reduced spectra (1100–2270 nm) are in Figure 4. It can be seen that the position of the PCA scores is more focused without the linear pattern caused by the “foil effect”, and the clustering is more effi cient (for the CA, e.g. suitable classifi cation of related compounds like starch, lactose, and glucose, or the higher linkage distance). The results are similar for the Spectrum 400 spectrometer (data not shown).
Fig. 3. Results of PCA (A) and CA (B) for the raw spectra for the NIRSystems 6500 instrument – legend as seen in Figure 1
Fig. 4. Results of PCA (A) and CA (B) for the reduced spectra (1100–2270 nm) for the NIRSystems 6500 instrument – legend as seen in Figure 1
2.3. Mathematical correction for the NIR spectra of DA 7520 NIR Analyzer
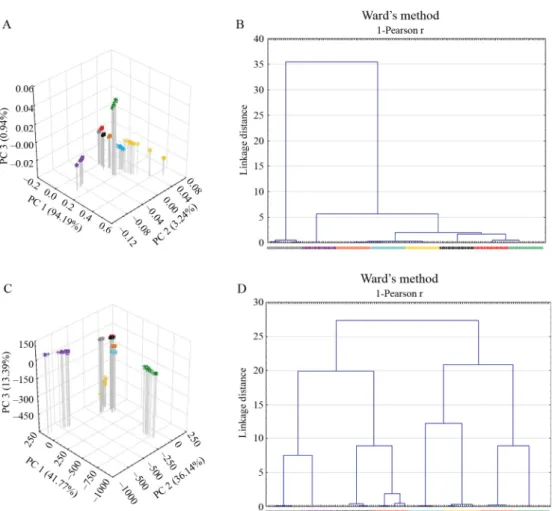
Due to the fact that the absorbance increment for the DA 7520 NIR Analyzer coming from the foil-through measurements is not signifi cant, it seemed to be subservient to investigate the effect of mathematical corrections on the distinction. Second derivative combined with smoothing (using 1 and 5 points gap and segment, respectively) has resulted in better distinction of the mathematical spectrum transformation methods we investigated. For the PCA, the second derivative combined with smoothing improved the distinction, but the trends originate from the presence of the foils have not disappeared completely. For the CA, the distance between each cluster has become bigger (Fig. 5). That is to say, second derivative combined with smoothing has a positive impact on the distinction of the compounds based on the NIR spectra measured through the foils. The MSC treatment has resulted in a similar effect (data not shown).
Fig. 5. Results of PCA (A; C) and CA (B; D) for the DA 7520 NIR Analyzer, in case of the raw spectra (A; B) or the spectra after the second derivation and smoothing (C; D) – legend as seen in Figure 1
3. Conclusions
Based on the experience of recent years, after the practised pharmaceutical application, the QbD concept and the process analytical tools are under widespread implementation in the food industry. Use of the process design has several benefi ts, but effective analytical tools and data analysis methods are needed to serve it (RATHORE & KAPOOR, 2017). The purpose of the present study was to test a possible, not widely used PAT application of near-infrared spectroscopy. Compared to such former studies, it was aimed to attempt the distinction of different food additives based on NIR spectroscopic measurements via PE foils for three spectrophotometers with different optical arrangements. Due to the chemical features of the samples, there was a possibility to obtain information about both sensitivity and robustness of the method. Results indicate that distinction of materials with chemometric tools (PCA and CA) from the foil-through NIR data recording is possible, but in some cases it is necessary to perform mathematical corrections, or trim the spectra. In conclusion, the NIR-based identity
check is certainly possible without breaking the packaging of the delivered food additives, and this method can be used successfully for several materials and several spectrophotometer types. Of course, the expansion of the obtained spectrum library is necessary for covering the variability of food additives because of the differences between manufacturers and/or the batch-to-batch variability (resulting e.g. differences in particle size and/or moisture content).
Tailoring to the dedicated applications and validation of spectrum library are also important points. On this basis an effective PAT system could be achieved and implemented into food industry effi ciently.
*
The authors gratefully acknowledge Csaba Bárdy and the Mikropakk Kft. for providing the PE foils.
This work is connected to the scientifi c programme of the “Development of quality-oriented and harmonised R+D+I strategy and functional model at BME” project. This project is supported by the New Hungary Development Plan (Project ID: TÁMOP-4.2.1/B-09/1/KMR-2010-0002).
References
GELADI, P., MACDOUGALL, D. & MARTENS, H. (1985): Linearization and scatter-correction for near-infrared refl ectance spectra of meat. Appl. Spectrosc., 39, 491–500.
HEISE, H.M. & WINZEN, R. (2002): Fundamental chemometric methods. -in: SIESLER, H.W., OZAKI, Y., KAWATA, S. &
HEISE, H.M. (Eds) Near-infrared spectroscopy – Principles, instruments, applications. Wiley-VCH Verlag GmbH, Weinheim, pp. 125–162.
KHAKIMOV, B., GÜRDENIZ, G. & ENGELSEN, S.B. (2015): Trends in the application of chemometrics to foodomics studies. Acta Alimentaria, 44, 4–31.
MUNIR, M.T., YU, W., YOUNG, B.R. & WILSON, D.I. (2015): The current status of process analytical technologies in the dairy industry. Trends Food Sci. Tech., 43, 205–218.
NORRIS, K.H. (1983): Extracting information from spectrophotometric curves. Predicting chemical composition from visible and near-infrared spectra. -in: MARTENS, H. & RUSSWURM, H. Jr. (Eds) Food research and data analysis. Applied Science Publishers Ltd, Barking, pp. 95–113.
RATHORE, A.S. & KAPOOR, G. (2016): Implementation of quality by design for processing of food products and biotherapeutics. Food Bioprod. Process., 99, 231–243.
RATHORE, A.S. & KAPOOR, G. (2017): Implementation of quality by design toward processing of food products. Prep.
Biochem. Biotech., 47(5), 435–440.
RATHORE, A.S., BHAMBURE, R. & GHARE, W. (2010): Process analytical technology (PAT) for biopharmaceutical products – a review. Anal. Bioanal. Chem., 398, 137–154.
RODIONOVA, O.Y., SOKOVIKOV, Y.V. & POMERANTSEV, A.L. (2009): Quality control of packed raw materials in pharmaceutical industry. Anal. Chim. Acta, 642(1–2), 222–227.
ROMERO-TORRES, S., HUANG, J. & HERNANDEZ-ABAD, P.E. (2010): Practical considerations on PAT analyzer selection – Raman vs. NIR spectroscopy. Am. Pharmaceutical Rev., 12(7), 12–19.
RU, Y. & GLATZ, P.C. (2000): Application of near infrared spectroscopy (NIR) for monitoring the quality of milk, cheese, meat and fi sh – review. Asian Austral. J. Anim. Sci., 13, 1017–1025.
SHAH, M.K., BHATT, C.B. & DAVE, J.B. (2016): NIR spectroscopy: Technology ready for food industries applications.
Int. J. Appl. Nat. Sci. IJANS, 5(1), 129–138.
SKIBSTED, E. & ENGELSEN, S.B. (2010): Spectroscopy for process analytical technology (PAT). -in: LINDON, J., TRANTER, G.E. & KOPPENAAL, D.W. (Eds) Encyclopedia of spectroscopy and spectrometry. 2nd ed., Academic Press, San Diego, US, pp. 2651–2661.
SNAVELY, D.L. & DUBSKY, J. (1995): Near-IR spectra of polyethylene, polyethylene glycol and polyvinylethyl ether.
N00014-95-1-0452 R&T Code 4131063 Technical Report No. 2.
ULMSCHNEIDER, M. & PÉNIGAULT, E. (2000): Direct identifi cation of key intermediates in containers using Fourier- transform near-infrared spectroscopy through the protective polyethylene primary packaging. Analusis, 28(2), 136–140.
VANDEN BERG, F., LYNDGAARD, C.B., SØRENSEN, K.M. & ENGELSEN, S.B. (2013): Process analytical technology in the food industry. Trends Food Sci. Tech., 31, 27–35.