Fitting special peak shapes of prompt-gamma spectra
László Szentmiklósi
Nuclear Analysis and Radiography Department, Centre for Energy Research, Hungarian Academy of Sciences, 29-33 Konkoly-Thege Miklós street, 1121 Budapest, Hungary.
Abstract
Special spectrum regions, like around the annihilation peak at 511 keV, the boron peak at 478 keV, the Ge-triangles, as well as complicated multiplets or heavily distorted intense peaks require special attention when evaluating Prompt-gamma Activation Analysis (PGAA) spectra. A computer code and the related analytical practice of the Budapest PGAA facility is presented to improve the spectroscopy of these cases beyond the past practice relying on the well-known Hypermet-PC software.
Keywords
Prompt gamma activation analysis, spectrum evaluation, weighted nonlinear least squares fit, annihilation peak, Doppler-broadened boron peak, inelastic neutron scattering, Ge triangles
Introduction
In prompt-gamma activation analysis (PGAA) [1], the spectrum is acquired during the irradiation with a beam of neutrons. The source of the analytical information is in almost all cases the radiative neutron capture, i.e. the (n,) reaction. Some important exceptions, such as the (n,) reaction on 10B [2-4] and (n,n′) reaction in the HPGe crystal [5], however, create structures in the gamma spectra that are specific to PGAA, making the evaluation of
containing the annihilation peak also require special attention due to its broadened peak width [6-7].
Due to the large number of peaks present in a PGAA spectrum [8], the interferences are more abundant and severe than in conventional gamma spectrometry, requiring adequate numerical methods to deal with the complicated multiplets, especially if at the same time the peak shapes become distorted due to high count rate [9] or due to the neutron damage of the crystal [10]. The missing right skew component of the peak shape model might make necessary in such cases to insert satellite peaks at the high-energy side of the peak and/or getting rid of the step component of the background, potentially biasing thereby the peak position and peak area determination of the main peak.
During position-sensitive PGAI-NT measurements [11-12], or in beam catalysis experiments [13–15], tens or hundreds of similar spectra are collected. Here we don’t need to evaluate the entire spectrum, only selected regions, where the variations are expected, but these shall be fitted very consequently with the identical peak pattern throughout all spectra, in order to reveal the small (few percent) differences between them. In these cases, the definition of the initial peak positions and the peak pattern comes from a priori knowledge (spectra of pure materials, library data) rather than from peak search algorithms.
We named this approach knowledge-driven batch fit. Batch fit generates a table of results that can directly serve as an input file to the ProSpeRo element analysis software [16], thereby including these fits in the concentration calculation stage.
In the last 15 years, Hypermet PC [17–19] has been the ultimate evaluation software at the Budapest PGAA facility to analyze the prompt gamma spectra, allowing the generation of accurate nuclear data [20-21] and reliable element analysis results [22]. However, over the years, the above listed limitations of the software are realized and attempts were made to overcome them by developing an adequate piece of software.
A utility relying on the Microsoft .NET framework 4.6.1 and running on Windows OS was coded to complement Hypermet PC’s features in this context. It was created with the intention to leave all control in the hands of the analyst. It can fit regular regions with many peaks (in Hypermet-PC, no more than 10 lines in a region is allowed), or regions containing
regular analytical lines together with the Doppler-broadened boron peak [23], annihilation peak or Ge inelastic scattering triangles. Its peak shape profile optionally includes the right skew term, to handle the distorted peaks. In the present code, each component of the peak shape and background function can be enabled or disabled. Although one or the other of these spectroscopic problems were already addressed in the literature (often just up to the proof-of-principle level), they were still not available in a single software package, and with a coherent implementation.
Theory
The peak shape function of regular peaks
The software uses a peak shape inspired by the Hypermet [19, 24] and Hyperlab [25]
programs, and also incorporated in the Hypergam package [26, 27]. This model is valid for all regular peaks in the PGAA spectrum, with the exceptions discussed hereafter. The parametrization proposed by Phillips and Marlow in mid-1970s [24] was modified to incorporate the high energy skew, just like in Hyperlab. With these notations, the value of the line profile function in the jth channel of a region can be calculated as follows:
𝑝(𝑗) = Γ ⋅ [e−(𝑗−𝑥𝛿0)
2
+1 2𝐴 ⋅ e(
𝑗−𝑥0 𝛽 )
⋅ erfc ( 𝛿
2𝛽+𝑗 − 𝑥0 𝛿 ) +1
2𝑅 ⋅ e(
𝑥0−𝑗 𝜌 )
⋅ erfc (𝛿
2𝜌−𝑗 − 𝑥0
𝛿 )], (1) where erfc(𝑥) = 1 − 2
√𝜋∫ 𝑒0𝑥 −𝑡2𝑑𝑡 is the complementary error function.
The first term of the Eq. (1) peak shape is a Gaussian that represents the statistical fluctuation of the charge creation and the electronic noise of the signal processing. Its parameters are the position x0, the amplitude Γ and the width (that is √2 ).
The second term is the so-called Left Skew to take into account the incomplete charge collection. In some cases, the detector measures lower energy than the photon energy that results in an exponential distribution. In a real spectrometer, this theoretical distribution is convolved with the above derived Gaussian, giving an Exponentially Modified Gaussian (EMG) function. It has a relative amplitude A and a skew parameter ; both are energy dependent.
Fig. 1. Semi-empirical model functions for peak fitting, after Fig. 3. of Ref. [24]
In case of high count rate a distortion can be observed at the high-energy side of the peak due to the pile up effect. In order to deal with this, a Right Skew can be introduced.
This is also an Exponentially Modified Gaussian with parameters R and . Its use must be judged based on the quality of the electronics and the acquisition conditions. This component is available in Hyperlab, as well as in the present code, but not in the original Hypermet-PC program. The peak shape function is at the end the sum of a Gaussian and one or two EMG functions, where the peak area is the sum of the areas of all these components.
𝑁𝑃 = Γ ⋅ [𝛿 ⋅ √𝜋 + 𝐴 ⋅ 𝛽 ⋅ e(−
𝛿2 4⋅𝛽2)
+ 𝑅 ⋅ 𝜌 ⋅ e(−
𝛿2 4⋅𝜌2)
] (2)
The model function comprises terms to describe the background features. This includes a Step function, being the convolution of a Heaviside function with the Gaussian. This describes the photons of original energy E0 that were scattered in very narrow angle in the
collimator or in the insensitive layer of the Ge crystal. The value of S is about 0.001 – 0.003 times the peak area and increases with the gamma-ray energy. Under the escape peaks a reverse step can be observed, because one or both annihilation photons can deposit a small energy in the active volume before escaping from the crystal.
The other term of the background is the so-called Tail. This is yet another EMG function, but represents detector surface effects. Its amplitude (T) is about 0.1-0.01 times of the peak amplitude, and its decay parameter () is in this range of the peak width. It is most evident with low-energy but intense peaks.
𝑏(𝑗) = Γ [𝑆 1
2erfc (𝑗 − 𝑥0
𝛿 )] + Γ [𝑇 e𝑗−𝑥𝜈0 1
2erfc (𝑗 − 𝑥0
𝛿 + 𝛿
2𝜈)] (3) The smooth baseline of the region is described with a polynomial up to second degree (Eq. (4)), but by default, only a0 is enabled. Here, unlike in Hypermet-PC, it is also possible to disable the slope of the baseline to make the baseline constant, or combine it with the Step function:
𝑙(𝑗) = 𝑎0+ 𝑎1𝑗 + 𝑎2𝑗2 (4)
If there are m peaks in an M channel wide region, we set up the region to have smooth baseline at the two region boundaries and we fit a function with maximum n = 2m+11 free variables. They are the positions and amplitudes for each peak, plus the two parameters (rel. amplitude and decay parameter) of the Skew, Tail and Right Skew, the relative amplitude of the Step, the width parameter and the maximum three polynomial coefficients. The b and a1, a2 background terms are optional. During a weighted nonlinear least squares fit, we minimize the below defined 𝜒2 merit function using the BFGS variable metric optimization technique:
𝜒2 = 1
𝑀 − 𝑛∑[𝑦(𝑗) − {𝑙(𝑗) + ∑ [𝑝𝑚 𝑚(𝑗) + 𝑏𝑚(𝑗)]}]2 𝑤(𝑗)
𝑀
𝑗=0
→ min! (5) where 𝑤(𝑗) is the weighting factor. Usually it is equal to the histogram value 𝑦(𝑗), but for regions that have only few counts per channel, the mean of three adjacent channels with indices (𝑗 − 1, 𝑗, 𝑗 + 1) are computed instead. In the optimum, the normalized 2 has an expectation value of one and a standard deviation √ 2
𝑀−𝑛.
Annihilation peak region
The annihilation peak at 511.00 keV is known to be about twice as wide as regular peaks at this energy [6]. Hypermet-PC attempts to fit the annihilation peak with the superposition of many fictitious regular-shaped peaks, but the Chi-square usually does not reach its optimum this way, so the regular peaks nearby can be quantified only with a higher-than- optimum uncertainty. In Hyperlab, however, the model has different width for each peak in the region which leads to numerical instability and poor reproducibility of peak areas.
In the present model, the annihilation peak also has the shape as Eq. (1), but with its own amplitude and larger width parameters, whereas all other peaks share the same width and shape parameters.
Boron peak region
Boron is an element with exceptionally high sensitivity (=3837 barn), where the analytical signal emerges from the excited state of recoiled 7Li, following the emission of an alpha particle (Q=2790 keV, E: 1472 keV, E7Li: 841 keV). This makes the peak of boron about 15-keV wide due to Doppler broadening [28]; moreover, its shape is influenced by the matrix composition via the ratio of deceleration time and the level’s mean lifetime [29].
Due to the wide peak shape, the chance for being in interference with lines from other elements, notably Na, Si, Li, W, Nd, Mn, Th, Dy is high. As the sensitivity of 10B is much higher than 11B, only the minor isotope can be measured, and the total boron content is reported with the assumption of natural isotope ratio.
The theoretical and practical aspects of the underlying physics is discussed in the literature [30–32]. As different matrices slow down the 7Li* to a different degree, and the actual velocity and direction of 7Li* at the instant of gamma-emission determines the energy offset, the deceleration power of the matrix vs. the lifetime of the 7Li* first excited state determines the peak shape [29]. In the parametrization of Eq. (6) it is characterized by the matrix dependent D deceleration constant that can be considered as an empirical parameter of a fit, or can be taken from theoretical considerations, if matrix is a priori known (see in the Supplementary Information).
A line shape function, i.e. the density function of the emitted gamma rays as a function of energy, proposed by Kubo and coauthors [29] superseded earlier approximations [33–36], and, in combination with the accurate peak shape representation of Hypermet-PC, was proven to be an adequate model for the line shape evaluation [23] (see in the Supplementary Information).
𝑔(𝐸) ≡𝑑𝑁𝑃
𝑑𝐸 = 𝑐 𝑁0∗ 2𝐸0𝑣0
𝜆
𝜆 − 𝐷[1 − (𝑐|𝐸 − 𝐸0| 𝐸0𝑣0 )
𝜆−𝐷 𝐷
]
𝑑𝑁𝑃 𝑑𝐸 = 0
if |𝐸 − 𝐸0| ≤ Δ𝐸max, elsewhere
(6)
This g(E) has to be folded with the regular peak shape function of Eq. (1) (instead of the Dirac-) to represent the counts in the spectrum. This convolution is implemented here numerically. If the boron peak has a large peak area, i.e. the uncertainty of the histogram channel values is low, already the slight change (~5%) of the full energy peak efficiency over this 15 keV becomes noticeable, and therefore has to be taken into account, so the peak profile is normalized pointwise with the relative efficiency 𝜀(𝐸)/𝜀(𝐸0).
Germanium triangles
As the PGAA spectrum is taken during irradiation, neutrons scattered out from the beam path interact with the HPGe detector material [5, 37]. For thermal neutrons, we observe short-lived decay lines at 139.9 keV (74Ge(n,)75mGe) and 198.3 keV (70Ge(n,)71 mGe), that can be handled in the usual background correction phase. Fast neutrons can come from the beam, from a fissile component of the sample, or can emerge from the 6Li-enriched poly neutron shielding [38]. In the latter case, energetic tritons produced by the 6Li(n,t)He reaction, interact with the shielding material itself and produce secondary fast neutrons and gamma-rays. These neutrons undergo inelastic scattering within the active volume of the Ge crystal and produce triangle-like structures in logarithmic view at 595.8 keV, 691.0 keV and 834 keV [39].
The usual representation of these structures is a Gaussian for the rising edge and exponential for the high-energy part [40, 41]. Here a single EMG is used instead, as if it was a gamma-ray peak with an extremely long right-side skew:
1
2𝑄 ⋅ e(𝑥0𝜏−𝑗)⋅ erfc (𝛿
2𝜏−𝑗 − 𝑥0
𝛿 ) (7)
This formalism ensures that the curve is continuous everywhere, as there is no need to match two different functions. Using this model, it became possible to reliably quantify the analytical peaks appearing on the slope of the triangle.
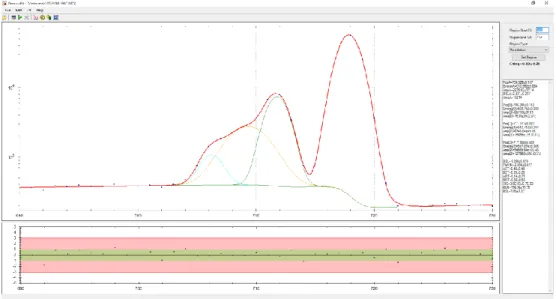
Results and discussion
The developed algorithms and analysis practices were tested on the spectrum pool of the Budapest PGAA facility, encompassing spectra of pure elements, enriched isotopes, simple chemical compounds, as well as analytes from the fields of material science and cultural heritage. Representative screenshots of the implemented models are illustrated in Fig.2. Panel A) shows a region where the peak of Chlorine at 517 keV and the peak of Phosphorous at 512 keV are in interference with the annihilation peak. As these are the most intense lines of both elements, if discarded, the analytical sensitivities from their second most intense lines will be lower, resulting in higher detection limits and lower precision. Even a weak Cl line at 508 keV is observed on the left side of the annihilation peak.
Panel B) displays a small Na peak on the top of a large boron peak, an abundant interference pair in geological matrices. The peak areas of Na and B could be separated with good accuracy with the applied model function. This fitting approach is preferred over the reference peak method [42-44] implemented in ProSpeRo, as that latter uses less intense peaks of the same element at other gamma-ray energies, inherently with lower statistical precision, i.e. giving a less reliable correction [23].
Panel C) presents a region of a uranium-oxide sample around 695 keV, where due to neutron-induced fission of the 235U, energetic neutrons are emitted. In addition, the spectrum is rich in lines due to the gamma emissions of the short-lived fission fragments.
Some of these lines appear on the top of a Ge triangle, where this model function is applicable.
Panel D) is an example where the high-energy tailing of an intense peak is observed.
Such fits with Hypermet-PC do not give a well-reproducible result, as the area and the position of the artificial satellite peak are ill-defined, biasing the parameters of the main peak and making the peak identification stage of the concentration calculation problematic.
This is especially true if multiple spectra with the same fitting pattern have to be compared with as low as possible error margin.
Fig 2. Major peak fitting challanges of PGAA that are beyond the capabilities of Hypermet PC: A: interference with the annihilation peak, B: sodium-boron interference, C: Ge triangle, D: distorted peaks with high-energy tailing
The software can read in spectra from files with several binary and ASCII formats, including Hypermet’s primary file format (*.MCA), and Canberra Genie 2000’s CNF. It is able to load the linear energy calibration (*.SET), nonlinearity (*.LIN) and efficiency files (*.EFF) of Hypermet-PC and use them for corrections. This way the peak positions and peak areas remain fully compatible with those of the Hypermet’s fits, so the results can be merged. Fitted data of the regions can be saved to a CSV-like PKF output file. The ProSpeRo PGAA concentration calculation code was modified to consider this PKF file if present, and to replace the relevant entries of the Hypermet’s peaklist (*.PKL) with these data before proceeding to the peak identification step. If a boron peak is analyzed by peak fitting, the interference correction by the reference peak method is disabled for this region.
Conclusions
A utility was programmed to extend capabilities of the well-known Hypermet-PC by implementing dedicated peak shape functions and fitting procedures to handle special spectroscopic cases appearing in PGAA. With this improvement, we addressed most of the practical issues that our PGAA spectrum analysis routine revealed over the past 15 years.
The peak shapes used here are re-parametrized, but still remained compatible with those of Hypermet-PC and Hyperlab, allowing the easy integration of results to our well-established analysis workflow. The fit results can now be directly fed to the ProSpeRo concentration calculation Excel program. These refinements significantly improve the fitness of our laboratory to determine elements like P, Cl, Na, Si, Li, W, Nd, Mn, Th, Dy with PGAA, and, in general, the overall quality of our analysis results. In future, we plan to add a functionality to calibrate the model parameters (e.g. 𝛿, 𝛽, 𝜌, 𝑆, 𝑇, 𝜐) as a function of the energy for a given spectrometer, that would make the fits even more robust and reproducible, and would further reduce the workload of the analyst.
Acknowledgements
The author gratefully acknowledges the financial support of the Bólyai János Research Fellowship of the Hungarian Academy of Sciences. This work was part of the project No.
124068 that has been implemented with the support provided from the National Research, Development and Innovation Fund of Hungary, financed under the K_17 funding scheme.
References
1. Molnár GL (2004) Handbook of Prompt Gamma Activation Analysis with Neutron Beams. 1–423. ISBN 978-0-387-23359-8. Kluwer Publishing. DOI:
10.1007/978-0-387-23359-8
2. Fynbo H (2003) Doppler broadened γ-lines from exotic nuclei. Nucl Instruments Methods Phys Res Sect B Beam Interact with Mater Atoms 207:275–282. doi:
10.1016/S0168-583X(03)00570-6
3. Sakai Y, Yonezawa C, Matsue H, et al (1996) Ejection of energetic Li-7* ions produced in B-10(n,)Li-7* reaction from boron coated silicon wafer. J Radioanal Nucl Chem 207:275–284. doi: 10.1007/BF02071233
4. Sakai Y, Yonezawa C, Matsue H, et al (1996) Ranges of Li-7 produced in B- 10(n,)(7)*Li reaction. Radiochim Acta 72:45–49.
5. Knezevic D, Jovancevic N, Krmar M, Petrovic J (2016) Modeling of neutron spectrum in the gamma spectroscopy measurements with Ge-detectors. Nucl Instruments Methods A 833:23–26. doi: 10.1016/j.nima.2016.07.001
6. Hotz HP, Mathiesen JM, Hurley JP (1968) Measurement of positron annihilation line shapes with a Ge(Li) detector. Phys Rev 170:351–355.
doi:10.1103/PhysRev.170.351
7. Gilmore G, Hemingway JD Practical Gamma-ray Spectrometry – 2nd Edition Gordon R. Gilmore 2008 John Wiley & Sons, Ltd. Chichester, ISBN: 978-0-470- 86196-7
8. Révay Z, Firestone RB, Belgya T, Molnár GL (2004) Prompt Gamma-Ray Spectrum Catalog. In: Molnár GL (ed) Handbook of Prompt Gamma Activation Analísis with Neutron Beams. Kluwer Academic Publishers, Dordrecht, Boston, London, pp 173–366
9. Szentmiklósi L, Belgya T, Révay Z, Molnár GL (2005) Digital signal processing in prompt-gamma activation analysis. J Radioanal Nucl Chem. 264 (1) (2005) 229-234 doi: 10.1007/s10967-005-0698-5
10. Kraner HW, Chasman C, K.W. J (1968) Effects produced by fast neutron bombardment of Ge(Li) gamma ray detectors. Nucl Instr Meth 62:173–183.
11. Belgya T, Kis Z, Szentmiklósi L, et al (2008) A new PGAI-NT setup at the NIPS facility of the Budapest Research Reactor. J Radioanal Nucl Chem. 278 (2008) 713–718 doi: 10.1007/s10967-008-1510-0
12. Kis Z, Szentmiklósi L, Belgya T (2015) NIPS-NORMA station - A combined facility for neutron-based nondestructive element analysis and imaging at the Budapest Neutron Centre. Nucl Instruments Methods Phys Res Sect A 779 (2015) 116-123 doi: 10.1016/j.nima.2015.01.047
13. Révay Z, Belgya T, Szentmiklósi L, et al (2008) In situ determination of hydrogen inside a catalytic reactor using prompt gamma activation analysis. Anal Chem 80:6066–6071. doi: 10.1021/ac800882k
14. Moser M, Vilé G, Colussi S, et al (2015) Structure and reactivity of ceria-zirconia catalysts for bromine and chlorine production via the oxidation of hydrogen halides. J Catal. doi: 10.1016/j.jcat.2015.08.024
15. Farra R, García-Melchor M, Eichelbaum M, et al (2013) Promoted ceria: A
structural, catalytic, and computational study. ACS Catal. doi: 10.1021/cs4005002 16. Révay Z (2009) Determining Elemental Composition Using Prompt-gamma
Activation Analysis. Anal Chem 81:6851–6859.
17. Fazekas B, Molnár G, Belgya T, et al (1997) Introducing HYPERMET-PC for automatic analysis of complex gamma-ray spectra. J Radioanal Nucl Chem 215:271–277.
18. Révay Z, Belgya T, Molnár GL (2005) Application of Hypermet-PC in PGAA. J Radioanal Nucl Chem 265:261–265.
19. Révay Z, Belgya T, Ember PP, Molnár GL (2001) Recent developments in HYPERMET PC. J Radioanal Nucl Chem 248:401–405.
20. Belgya T (2010) Determination of thermal radiative capture cross section. In:
EFNUDAT Slow and Resonance Neutrons, a Scientific Workshop on Nuclear Data Measurements, Theory and Applications 23-25 Sept 2009 1:115–120.
21. Molnár GL, Belgya T, Révay Z, Qaim SM (2002) Partial and total thermal neutron capture cross sections for non-destructive assay and transmutation monitoring of Tc-99. Radiochim Acta 90:479–482.
22. Szentmiklósi L, Kasztovszky Z, Belgya T, et al (2016) Fifteen years of success:
user access programs at the Budapest prompt-gamma activation analysis
laboratory. J Radioanal Nucl Chem. 309:71–77 doi: 10.1007/s10967-016-4774-9 23. Szentmiklósi L, Gméling K, Révay Z (2007) Fitting the boron peak and resolving
interferences in the 450-490 keV region of PGAA spectra. J Radioanal Nucl Chem. 271:447-453 doi: 10.1007/s10967-007-0229-7
24. Philips GW, Marlow KW (1976) HYPERMET. Nucl Instruments Methods 72:125.
25. Simonits A, Östör J, Kálvin S, Fazekas B (2003) HyperLab: A new concept in gamma-ray spectrum analysis. J. Radioanal. Nucl. Chem. 257: 589–595 doi:
10.1023/A:1025400917620
26. Park BG, Choi HD, Park CS (2012) New development of hypergam and its test of performance for gamma-ray spectrum analysis. Nucl Eng Technol 44:781–790.
doi: 10.5516/NET.08.2011.062
27. Park CS, Choi HD, Sun GM, Whang JH (2008) Status of developing HPGe gamma-ray spectrum analysis code HYPERGAM. Prog Nucl Energy 50:389–393.
doi: 10.1016/j.pnucene.2007.11.022
28. Choi HD, Jung NS, Park BG (2009) Analysis of Doppler-broadened peak in thermal neutron induced B-10(n,alpha gamma)Li-7 reaction using HYPERGAM.
Nucl Eng Technol 41:113–124.
29. Kubo MK, Sakai Y (2000) A Simple Derivation of the Formula of the Doppler Broadened 478 keV -Ray Lineshape from 7*Li and Its Analytical Application.
Journal of Nuclear and Radiochemical Sciences, 1:83–85.
30. Lindhard J, Scharff M, Schiott HE (1963) Danske Videnskap Selsk Mat Fys Medd 33:1.
31. Lindhard J, Scharff M (1961) Energy dissipation by Ions in the keV Region. Phys Rev 124:128.
32. Neuwirth W, Hauser U, Kühn E (1969) Z Phys 220:241.
33. Magara M, Yonezawa C (1998) Decomposition of prompt gamma-ray spectra including the Doppler-broadened peak for boron determination. Nucl Instruments Methods A 411:130–136.
34. Baechler S, Kudejova P, Jolie J, et al (2002) Prompt gamma-ray activation analysis for determination of boron in aqueous solutions. Nucl Instruments Methods Phys A 488:410–418.
35. Yonezawa C (1999) Prompt gamma-ray analysis using cold and thermal guided neutron beams at JAERI. Biol Trace Elem Res 71–2:407–413.
36. Byun SH, Sun GM, Choi HD (2004) Prompt gamma activation analysis of boron in reference materials using diffracted polychromatic neutron beam. Nucl
Instruments Methods Phys Res B 213:535–539. doi: 10.1016/S0168- 583X(03)01626-4
37. Fehrenbacher G, Meckbach R, Paretzke HG (1996) Fast neutron detection with germanium detectors: Computation of response functions for the 692 keV inelastic scattering peak. Nucl Instruments Methods A 372:239–245. doi:
10.1016/0168-9002(95)01289-3
38. Lone MA, Santry DC, Inglis WM (1980) MeV Neutron Production from Thermal Neutron Capture in Li and B Compounds. Nucl Instruments Methods 174:521–
529.
39. Heusser G (1996) Cosmic ray interaction study with low-level Ge-spectrometry.
Nucl Instruments Methods A 369:539–543. doi: 10.1016/S0168-9002(96)80046-5 40. Siiskonen T, Toivonen H (2005) A model for fitting peaks induced by fast
neutrons in an HPGe detector. Nucl Instruments Methods A 540:403–411. doi:
10.1016/j.nima.2004.11.021
41. Fehrenbacher G, Meckbach R, Paretzke HG (1997) Fast neutron detection with germanium detectors: Unfolding the 692 keV peak response for fission neutron spectra. Nucl Instruments Methods A 397:391–398. doi: 10.1016/S0168- 9002(97)00818-8
42. Yonezawa C, Wood AKH (1995) Prompt gamma-ray analysis of boron with cold and thermal-neutron guided beams. Anal Chem 67:4466–4470. doi:
10.1021/ac00120a006
43. Anderson DL, Cunningham WC, Mackey EA (1990) Determination of Boron in Food and Biological Reference Materials by Neutron Capture Prompt-gamma Activation. Fresenius J Anal Chem 338:554–558.
44. Cho H-J, Chung Y-S, Kim Y-J (2005) Analysis of boron in biological reference materials using prompt gamma activation analysis. J Radioanal Nucl Chem 264:701–705. doi: 10.1007/s10967-005-0774-x
![Fig. 1. Semi-empirical model functions for peak fitting, after Fig. 3. of Ref. [24]](https://thumb-eu.123doks.com/thumbv2/9dokorg/1425983.120992/4.918.175.741.116.587/fig-semi-empirical-model-functions-peak-fitting-fig.webp)