INSTITUTIONAL REFORM AND ECONOMIC GROWTH OF CHINA:
40-YEAR PROGRESS TOWARD MARKETIZATION*
FAN, Gang – MA, Guangrong – WANG, Xiaolu
China has persevered its market-oriented economic transition since 1978. In this paper, we use the provincial-level NERI Index of Marketization from 1997 to 2014 and a panel data model to investigate the quantitative contribution of market-oriented reforms to China’s total factor pro- ductivity (TFP) and economic growth. Our results indicate that marketization reforms contributed 1.3 percentage points to China’s annual economic growth rate and accounted for 35 percent of the increase in TFP. This means that the institutional reforms signifi cantly improved resource alloca- tion. However, economic transition in China has not yet been completed and sustainability of future growth will depend on further market-oriented reforms.
Keywords: marketization, institutional reforms, economic transition, growth, total factor produc- tivity
JEL classifi cation indices: O57, P24
* This research was supported by the Fundamental Research Founds for the Central Universi- ties and the Research Funds of Renmin University of China (No. 18 XNQ004).
Fan, Gang, Professor of Economics at Peking University HSBC Business School and Director of National Economic Research Institute. E-mail: fangang@neri.org.cn
Ma, Guangrong, corresponding author. Associate Professor of Economics at School of Finance and China Financial Policy Research Center, Renmin University of China.
E-mail: grma@ruc.edu.cn
Wang, Xiaolu, Deputy Director of the National Economic Research Institute.
E-mail: wangxiaolu@neri.org.cn
1. INTRODUCTION
China has persevered in its market-oriented economic reform for 40 years. Guid- ing by a reform strategy of “groping stones to cross the river”, China managed to avoid major economic decline and crisis that happened in other transitional economies such as Russia and other Eastern European countries, and successfully transformed its centrally planned economy into a mainly market-oriented one. In the past 40 years, China has achieved average annual GDP growth at 9.5 percent, and overtook the United States to become the world’s largest economy according to the purchasing power parity measure in 2014. Rapid economic growth lifted hundreds of millions of people from poverty. To date, there still lacks quantitative study on the contribution of marketization to growth and productivity progress, due to the lack of a general indicator to measure the achievement of market- oriented reform.1 Our starting point is Kolodko’s definition: the reform is a sys- tematic transformation of a country’s overall economic, social and legal systems other than only a few regulatory changes (Kolodko 2000, 2004).
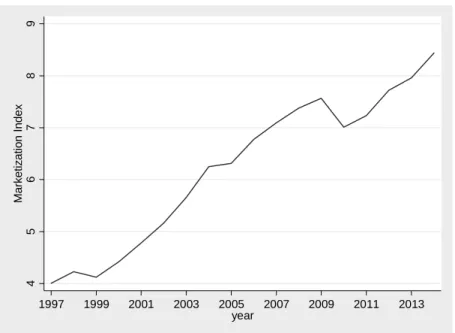
This paper employs the provincial-level NERI Index of Marketization, which was developed by the National Economic Research Institute of China Reform Foundation. The average score of marketization of China’s 31 provinces increased substantially from 4.0 to 8.4 in the period of 1997–2014. Our findings indicate that the reforms contributed an average of 1.3 percentage points to the annual economic growth rate. The reforms significantly improved resource allocation, which contributed 35 percent to the growth of total factor productivity (TFP).
The impact of market-oriented reforms on economic growth has been of great interest in transition economies since the early 1990s (Roland 2000; Jia – Chao 2015). Starting with the economic transitions of Eastern Europe and the former USSR, economists began to study the impact of reform on economic growth in transition economies (Kolodko 2014, 2018). The key to such research, however, is to identify systematic indicators to measure the transition process. The Euro- pean Bank for Reconstruction and Development (EBRD)’s annual Transition Re- port provides indices for various aspects of reforms, such as price liberalization, corporate reform, privatization, foreign exchange and trade liberalization, com- petition policies, reform of financial institutions, etc. for 27 transition economies.
However, with assessment difficulties, measurement problems, differences in re- search approaches, as well as the differences in the countries’ transition paths, previous studies have failed to reach consistent conclusions (Babetskii – Campos 2007). Some earlier studies such as Havrylyshyn et al. (1998), using EBRD tran-
1 An exception is Fan et al. (2011), in which we examine the period 1997–2007. In this paper, we extend the period to 1997–2014 by using newly constructed Marketization Index.
sition indices, and De Melo et al. (1997), using self-invented transition indices, both concluded that market-oriented reform significantly contributed to econom- ic development. However, these were not corroborated by subsequent studies.
According to the results of empirical research by Falccetti et al. (2002), the effect of reform on economic growth was not robust, depending on the selection of sam- ple countries and periods. Fidrmuc (2001) also found that, although economic transition had a positive effect on economic growth before 1995, the impact was insignificant for the period between 1996 and 2000.
As to the samples, all of the studies above were conducted on Eastern European and the former USSR countries. For a long time, mainstream international econo- mists gave insufficient attention to China’s different transitional path. Only in the past decade, China’s economic achievements and transition experiences started catching the attention of the international economics community. Nevertheless, researches on the effect of China’s marketization on economic growth have been limited. In the NERI Index of Marketization (MI), we interpret marketization as a systematic, gradual, process of institutional development. We therefore measure the progress of marketization from five aspects (called fields), including
the relationship between government and market,
the development of the non-state (private) sector,
the development of product and factor markets,
the development of market intermediaries as well as
the market-friendly legal environment.
This metrics is constructed on the basis of objective statistics or survey data.
The NERI Index provides panel data sets to catch regional differences, over time changes, thus makes the cross-province comparison possible.
The rest of this paper is structured as follows. Section 2 reviews the major achievements in marketization between 1997 and 2014. Section 3 explains the econometric models and the data that we employed. Section 4 presents the re- gression results and analysis of our growth accounting exercise. Section 5 is the conclusion.
2. CHINA’S ACHIEVEMENT IN MARKETIZATION
The annual NERI Index is an assessment system for relative progress in marketi- zation for China’s provinces. Marketization is assessed in 5 fields with 23 basic indicators. Data are from both statistics and enterprise surveys. The Index is now available for the years from 1997 to 2014. So far five reports have been pub- lished on the method and the results (Fan – Wang 2001; Fan et al. 2003a, 2003b, 2004, 2007, 2016).
Each of the 23 indicators is normalized into a Basic Index with a 0–10 relative score system at the base year. The best and least performed provinces in a given indicator get scores of 10 and 0, respectively. Other provinces get scores in be- tween according to their performance to the best and least performed provinces.
For a positively related indicator for instance, the score of a Basic Index j for province i, noted as Sij, is calculated with the following equation:
After positive or negative variations over years, a Basic Index allows a prov- ince to have scores above 10 or below 0; so that its progress over time can be measured. For a certain field, for instance, development of the non-state enter- prise sector, a Field Index is constituted by a few Basic Indices. Total five Field Indices constitute the Overall MI. All the Field Indices are equally weighted in the Overall Index, and so do the Basic Indices in each Field Index.
The NERI MI indicates the relative process of marketization, but it does not denote how far a province is from a pure market economy. So far, no economic theory can depict a 100 percent market economy. Nor does it exist in reality.
However, the relative progress of marketization is observable. The Index is de- signed to compare relative achievement of marketization across provinces and measure their temporal changes. The multi-angle analysis, together with the hori- zontal and vertical comparability and measurement using objective indicators, constitute the distinctive features of the NERI index. Another advantage of the NERI index is that it avoids subjective judgments. A few indicators used in NERI Index are assessments collected from corporate executives, but the survey in- cludes extensive samples, thus minimizing the impact of random errors.
The average score of marketization of China’s 31 provinces (including five autonomic minority ethnic regions and three municipalities directly under the central administration) increased from 4.0 to 8.4 in the examined period of 1997–
2014. However, the growth of MI is not steady. The marketization process was slow between 1997 and 2000, during which time the average score increased by merely 0.10 points each year. The marketization pace accelerated between 2001 and 2008 with an average annual increase of 0.37 points, suggesting that China’s WTO accession in 2001 might have played a positive role in promoting China’s marketization. However, the marketization process has again substan- tially slowed down in the 2008–2011 period, probably because the government intervention increased to cope with the global financial crisis. In the 2012–2014 period, the marketization process began to strengthen again.
min
max min
i 10
ij
S V V
V V
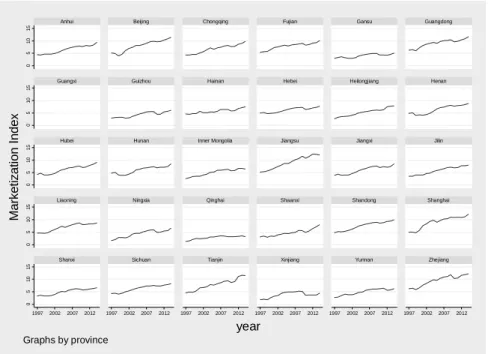
Although all the 31 provinces made positive progress, the process of marketi- zation was uneven (Figure 2). While the eastern coast areas are more marketized, the attained levels in some central and western provinces are relatively low.
Standard deviation of provincial scores kept widening after 1997, which indi- cates growing disparities in the inter-provincial marketization process (Figure 3).
Nevertheless, provinces with both high and low levels of marketization all expe- rienced appreciable progress.
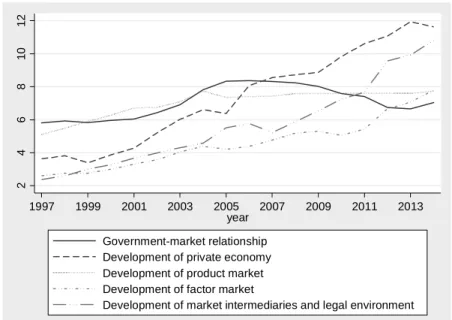
The five aspects of marketization all improved between 1997 and 2014 (Figure 4). Rapid progress made in development of the private sector, develop- ment of market intermediaries and the legal environment, and development of product markets. However, in the terms of government-market relationship, the progress stalled over the past few years. These facts indicate that there is still too much unnecessary government intervention. The development of factor markets was slow between 2003 and 2010, but accelerated after 2011.
There are also bottlenecks in the market-oriented transformation. Most im- portantly, institutional and legal frameworks are incomplete, and, to some ex- tent, conflict with the market mechanism. There are still unnecessary govern- ment interventions, unregulated financial collections, and low transparency in
456789Marketization ,ndex
1997 1999 2001 2003 2005 2007 2009 2011 2013 year
Figure 1. Average scores of the Marketization Index (1997–2014) Source: Fan et al. 2016.
Figure 2. NERI index for progress in marketization in China’s provinces
Source: Fan et al. 2016. Due to limited data source, this paper does not include Tibet, Taiwan, Hong Kong and Macau.
051015051015051015051015051015
1997 2002 2007 2012 1997 2002 2007 2012 1997 2002 2007 2012 1997 2002 2007 2012 1997 2002 2007 2012 1997 2002 2007 2012
Anhui Beijing Chongqing Fujian Gansu Guangdong
Guangxi Guizhou Hainan Hebei Heilongjiang Henan
Hubei Hunan Inner Mongolia Jiangsu Jiangxi Jilin
Liaoning Ningxia Qinghai Shaanxi Shandong Shanghai
Shanxi Sichuan Tianjin Xinjiang Yunnan Zhejiang
Marketization ,ndex
year
Graphs by province
.511.522.5Standard deviation of Marketization ,ndex
1997 1999 2001 2003 2005 2007 2009 2011 2013 year
Figure 3. Standard deviation of Marketization Index (1997–2014) Source: Fan et al. 2016.
administration . The size of government is inflating. Legal environment for mar- ket participants is uncertain. At the sector level, the manufacture sector is now nearly fully market-oriented, whereas marketization in the financial sector is lagged behind. A few service sectors are still in low efficiency and lack market competition. Market intermediaries are underdeveloped.
3. MODEL AND DATA
3.1. A growth model for empirical study
For empirical study on economic growth, the Cobb-Douglas production func- tion remains a c o m m o n l y u s e d f u n c t i o n a l f o r m f o r i t s analytical conven- ience. In Lucas (1998) model, human capital, as an important production factor, is defined as effective labour that is determined by both the quantity and educational level of the labour force, i.e., the quality of labour. In order to distin- guish the two effects, our study divides the Lucas-defined human capital into two variables: the size of labour force and its educational level, in a Cobb-Douglas production function:
Figure 4. Scores of the five aspect indices (1997–2014)
Source: Fan et al. 2016.
24681012
1997 1999 2001 2003 2005 2007 2009 2011 2013
year Government-market relationship Development of private economy Development of product market Development of factor market
Development of market intermediaries and legal environment
it it it it it
Y = A K L Eα β (1)
where Yit, Kit, Lit and Eit, respectively, denote GDP, fixed capital stock, labour force, and average schooling year of labour force of province i in year t. α, β and γ are the output elasticities of physical capital, labour force and year of school- ing, respectively. Ait represents TFP, which comes from two major sources: the technological progress, and efficiency gains from both improvement in resource allocation and changes in the incentive mechanism at the firm level, as a result of market-oriented reforms. Factors that have significant effects on TFP growth at the provincial level are technological progress, marketization, and improvements in infrastructure. Thus, TFP in this study is defined as:
(2)
where MIit is the MI of province i in year t. lnTechit is the stock of research capital in logarithm form, which stock is an accumulation of R&D inputs, calculated using the Perpetual Inventory Method. Mranit is the infrastructure condition in province i, and is measured by the ratio of standard transport route length to the provincial population. Standard route length is converted from length of railway and highway of different grades based on their transportation capacity. λi denotes the fixed effect of provinces and is intended to capture province-specific produc- tivity factors that do not change over time. εit is the random disturbance term.
Substituting Ait in equation (1) by equation (2) and taking logarithm on both sides, we arrive at the following econometric model:
(3)
3.2. Description of variables and data 3.2.1. GDP
GDP figures are from China Statistical Yearbook (National Bureau of Statis- tics, or NBS, various years), adjusted to 2000 constant prices. The average an- nual GDP growth rate is 11.3% in the 1997–2014 period.
3.2.2. Years of schooling of labour force
It is calculated from the annual numbers of graduates from primary, secondary and tertiary educational institutions in the past 56 years and the national census data. Schooling years of graduates from the tertiary, senior secondary, junior sec- ondary and primary levels were taken as 16 years, 12 years, 9 years, and 6 years, respectively.
( MIit lnTechit Tranit i uit)
AitAe ρ δ θ λ
lnYitlnAαlnKitβlnLitγlnEitρMitδlnTechitθTranit λ εi it
Larger increases are seen in workers’ years of schooling, up from 7.1 years in 1997 to 9.1 years in 2014.
3.2.3. Capital stock
Using the perpetual inventory method and taking 1952 as the base period, we calculated capital stock using fixed asset investment data over the past 56 years (data from NBS). The initial capital stock is assumed to be 10 times of the value of fixed asset investment in 1952. The depreciation rate is set at 5 per- cent for the period between 1952 and 1977 and is assumed to be under stable acceleration during the reform period (1978–2014) to ultimately reach 8 per- cent. Because no statistics are available on price deflator for fixed asset invest- ment before 1991, they are replaced by the commodities retail price index. Ac- cording to our estimation, between 1997 and 2014, China’s fixed capital stock grew at an annual rate of 15.5 percent, much higher than the GDP growth rate (11.3 percent).
3.2.4. Research capital
We use the provincial stock of research capital to measure technological progress.
This stock is an accumulated aggregation of spending on research and develop- ment, on imported foreign technology, and on domestic technology acquisition, using the perpetual inventory method. All statistics are taken from China Statisti- cal Yearbooks on Science and Technology. Due to incomplete statistics for years before 1996, we use 1996 as the base period. In conformity with existing litera- ture, we set the rate of research capital depreciation at 15 percent. Between 1997 and 2014, provincial research capital stock on average increased by 14.7 times.
3.2.5. Infrastructure
Even though many types of infrastructure are involved, only limited statistics are available for some of them. The most important and measurable infrastructure is the length of highways and railways. In order to make the statistics comparable, we convert the route length of different grades of highways into standard length, which is equivalent to grade-II highways according to their transportation capac- ity. We then combine railway length and standard highway length into standard route length using a conversion factor of 14.7. Between 1997 and 2014, China’s standard route length per 10,000 people increased from 12.7 km to 31.7 km.
4. RESULTS
4.1. Effects of marketization on economic growth
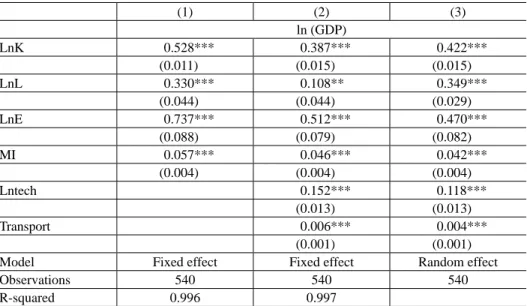
Table 1 presents the regression results of equation (3). The first and second col- umns of Table 1 show the regression results for fixed effect model. The third column shows the results from random effects model. Hausman test rejects the null hypothesis (random effect) and thus the fixed effect results are accepted.
Based on results in column 2, the output elasticity of physical capital, labour and schooling year is 0.39, 0.11 and 0.51, respectively. The coefficient of MI is 0.046, which shows that with other conditions unchanged, an increase in the score of MI by one point leads to 4.6 percent of GDP growth.
Based on the regression results in the first column of Table 1 derived from growth accounting, Table 2 shows the decomposition of provincial economic growth between 1997 and 2014. It indicates that physical capital, labour quantity, educational level and TFP contribute 6.83, 0.37, 0.64 and 3.70 percentage points, respectively, to economic growth. Evidently, capital still plays an important role in economic growth. Among the factors that determine TFP, marketization, tech- nological progress and infrastructure contribute 1.45, 1.08 and 0.40 percentage points, respectively, to economic growth, and the remaining unobservable factor
Table 1. Baseline results
(1) (2) (3)
ln (GDP)
LnK 0.528*** 0.387*** 0.422***
(0.011) (0.015) (0.015)
LnL 0.330*** 0.108** 0.349***
(0.044) (0.044) (0.029)
LnE 0.737*** 0.512*** 0.470***
(0.088) (0.079) (0.082)
MI 0.057*** 0.046*** 0.042***
(0.004) (0.004) (0.004)
Lntech 0.152*** 0.118***
(0.013) (0.013)
Transport 0.006*** 0.004***
(0.001) (0.001)
Model Fixed effect Fixed effect Random effect
Observations 540 540 540
R-squared 0.996 0.997
Note: *, ** and *** denote significance levels of 10%, 5% and 1%, respectively.
contributes 0.77 percentage points. Market-oriented reform remains the most im- portant factor of TFP growth.4
Table 2. Growth accounting, 1997– 2014
Factor Contribution (%)
GDP growth rate 100.0
Factor contribution 61.3
Material capital 52.3
Quantity of labour 1.8
Educational level 7.2
TFP contribution 38.7
Marketization process 11.3
Technology 19.9
Infrastructure 6.2
Non-observable factor 1.3
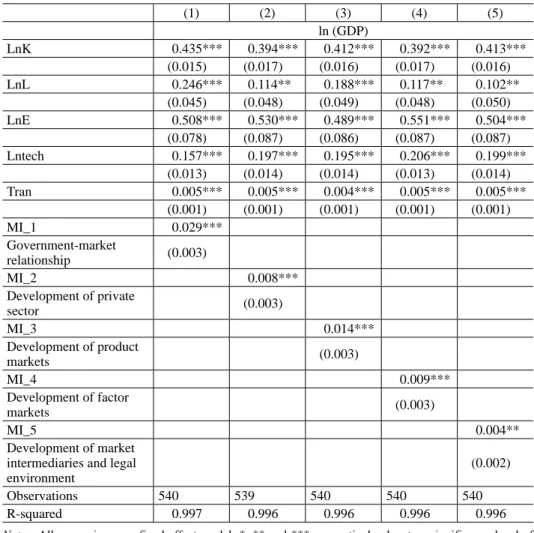
4.2. Effects of fi ve aspects of marketization on growth
In order to examine whether the various aspects of marketization have differ- ent effects on economic growth, we replaced the general MI in equation (3) with five separate marketization indices. Table 3 shows the regression results.
All the five aspect indices have a significant impact on economic growth. In terms of the magnitude of the coefficient, improvement in government-market relationship has the strongest impact on economic growth.
5. CONCLUSIONS
Using the NERI Index of Marketization, this paper presents a quantitative analy- sis of the role of market-oriented reform in China’s economic growth and TFP changes. Our results indicate that for the period between 1997 and 2014, market- oriented reforms contributed 1.3 percentage points on average to China’s eco- nomic growth rate, accounting for 35 percent of TFP growth. Contribution of marketization may be even greater because the acceleration of factor input growth, technology and infrastructure changes also relate to the reform. This implies that China has embarked on the right path of transition from a planned economy to a market economy. Marketization has been the primary cause for acceleration of China’s economic growth and TFP changes during the reform period.
Although there have been remarkable achievements, the process of China’s marketization is not complete. Marketization has made crucial progress in
some parts of China, particularly in the eastern coastal areas, but in some less developed areas, the market mechanism is still underdeveloped. In terms of the reform process in different fields, development of the product market has made major achievements, yet the factor markets are still underdeveloped. The government–market relationship had limited improvement over the past few years and even regressed in certain areas. The government sector reform has been lagging behind, and the size of government keeps expanding. These prob- lems may negatively affect future economic growth.
With consideration of the above, future reforms are recommended to focus on the following areas:
Table 3. Five aspects of marketization and economic growth
(1) (2) (3) (4) (5)
ln (GDP)
LnK 0.435*** 0.394*** 0.412*** 0.392*** 0.413***
(0.015) (0.017) (0.016) (0.017) (0.016)
LnL 0.246*** 0.114** 0.188*** 0.117** 0.102**
(0.045) (0.048) (0.049) (0.048) (0.050)
LnE 0.508*** 0.530*** 0.489*** 0.551*** 0.504***
(0.078) (0.087) (0.086) (0.087) (0.087)
Lntech 0.157*** 0.197*** 0.195*** 0.206*** 0.199***
(0.013) (0.014) (0.014) (0.013) (0.014)
Tran 0.005*** 0.005*** 0.004*** 0.005*** 0.005***
(0.001) (0.001) (0.001) (0.001) (0.001)
MI_1 0.029***
Government-market
relationship (0.003)
MI_2 0.008***
Development of private
sector (0.003)
MI_3 0.014***
Development of product
markets (0.003)
MI_4 0.009***
Development of factor
markets (0.003)
MI_5 0.004**
Development of market intermediaries and legal environment
(0.002)
Observations 540 539 540 540 540
R-squared 0.997 0.996 0.996 0.996 0.996
Notes: All regressions use fixed effect model. *, ** and ***, respectively, denote a significance level of 10%, 5% and 1%.
First, reform of the factor markets should be carried out to improve the institu- tional framework for capital and land markets. Market-based pricing mechanism should be established, and transactions should be made transparent. The urban household registration system (hukou) should also be reformed to promote rural- urban labour mobility and population migration.
Second, entry barriers of monopolistic sectors should be reduced, and both market competition and public monitoring mechanisms should be enhanced in those sectors. Resource tax and the SOE dividend distribution systems should also be reformed to make better use of monopolistic profits.
Third, excessive government intervention should be further reduced and dis- criminative policy treatment in terms of bank credit, interest rate and market ac- cess should be eliminated.
Lastly, government sector reform should be carried out to promote a transpar- ent, clean and efficient government.
REFERENCES
Babetskii, I. – Campos, N. (2007): Does Reform Work? An Econometric Examination of the Re- form-Growth Puzzle. Working Paper, University of Michigan.
Caselli, F. – Gennaioli, N. (2003): Dynastic Management. NBER WorkingPaper, No. 9442.
De Melo, M. – Denizer, C. – Gelb, A. – Tenev, S. (2001): Circumstance and Choice: The Role of Initial Conditions and Policies in Transition Economies. The World Bank Economic Review, 15(1): 1–31.
Falcetti, E. – Raiser, M. – Sanfey, P. (2002): Defying the Odds: Initial Conditions, Reforms, and Growth in the First Decade of Transition. Journal of Comparative Economics, 30: 229–250.
Fan, G. – Wang, X. (2001): NERI Index of Marketization of China by Province (2000). Bejing:
Economic Science Press.
Fan, G. – Wang, X. – Ma, G. (2011): The Contribution of Marketization on China’s Economic Growth. Economic Research Journal, 9. (in Chinese).
Fan, G. – Wang, X. – Zhu, H. (2003a): Marketization Index of China by Regions. Economic Re- search, 3: 9–19), Beijing.
Fan, G. – Wang, X. – Zhu, H. (2003b): NERI Index of Marketization for China’s Provinces: 2001 Report. Bejing: Economic Science Press. (in Chinese)
——, (2004): NERI Index of Marketization for China’s Provinces: 2004 Report. Bejing: Economic Science Press. (in Chinese)
——, (2007): NERI Index of Marketization for China’s Provinces: 2006 Report. Bejing: Economic Science Press. (in Chinese)
Fidrmuc, J. (2001): Forecasting Growth in Transition Economies: A Reassessment. Mimeo.
Havrylyshyn, O. – van Rooden, R. – Izvorski, I. (1998): Recovery and Growth in Transition Econo- mies: A Stylized Regression Analysis. IMF Working Paper, No. 141.
Jia, J. – Chao, Y. (2016): Growth Strategy and TFP Growth: Comparing China and Four Asian Tigers. Economics and Politic Studies, 4(2): 156–170.
Kolodko, G. W. (2000): From Shock to Therapy: The Political Economy of Post-Socialist Transfor- mation. Oxford and New York: Oxford University Press.
Kolodko, G. W. (2004): Institutions, Policies and Growth. Rivista di Politica Economica, May–
June: 45–79.
Kolodko, G. W. (2014): Whither the World: The Political Economy of the Future. Houndmills, Basingstoke, Hampshire: Palgrave Macmillan.
Kolodko, G. W. (2018): Socialism, Capitalism or Chinism? Communist and Post-Communist Stud- ies, 51(4): 285–298.
Lucas, R. E. (1988): On the Mechanics of Economic Development. Journal of Monetary Econom- ics, 22(1): 3–42.
Roland, G. (2000): Transition and Economics: Politics, Markets and Firms. Cambridge, MA: MIT Press.