Hydrophobic Surfaces in the Presence of Hofmeister Salts: Experimental Measurement of the Protein Interfacial Tension at the Nanometer Scale
Boglarka Kovacs, Andras Saftics, Attila Biro, Sandor Kurunczi, Balazs Szalontai, Balazs Kakasi, Ferenc Vonderviszt, Andras Der, and Robert Horvath
J. Phys. Chem. C, Just Accepted Manuscript • DOI: 10.1021/acs.jpcc.8b05026 • Publication Date (Web): 27 Aug 2018 Downloaded from http://pubs.acs.org on September 2, 2018
Just Accepted
“Just Accepted” manuscripts have been peer-reviewed and accepted for publication. They are posted online prior to technical editing, formatting for publication and author proofing. The American Chemical Society provides “Just Accepted” as a service to the research community to expedite the dissemination of scientific material as soon as possible after acceptance. “Just Accepted” manuscripts appear in full in PDF format accompanied by an HTML abstract. “Just Accepted” manuscripts have been fully peer reviewed, but should not be considered the official version of record. They are citable by the Digital Object Identifier (DOI®). “Just Accepted” is an optional service offered to authors. Therefore, the “Just Accepted” Web site may not include all articles that will be published in the journal. After a manuscript is technically edited and formatted, it will be removed from the “Just Accepted” Web site and published as an ASAP article. Note that technical editing may introduce minor changes to the manuscript text and/or graphics which could affect content, and all legal disclaimers and ethical guidelines that apply to the journal pertain. ACS cannot be held responsible for errors or consequences arising from the use of information contained in these “Just Accepted” manuscripts.
Kinetics and Structure of Self-assembled Flagellin Monolayers on Hydrophobic Surfaces in the Presence of Hofmeister Salts:
Experimental Measurement of the Protein Interfacial Tension at the Nanometer Scale
Boglarka Kovacs1,2, Andras Saftics1, Attila Biro1, Sandor Kurunczi1, Balazs Szalontai3, Balazs Kakasi4, Ferenc Vonderviszt1,4, Andras Der3 and Robert Horvath1,2*
1Nanobiosensorics Group, Institute of Technical Physics and Materials Science, Centre for Energy Research, Konkoly-Thege út 29-33, Budapest, Hungary
2 Chemical Engineering and Material Science Doctoral School, University of Pannonia, Egyetem u.10, Veszprém, Hungary
3 Biomolecular Electronics Research Group, Bio-nanoscience Research Unit, Institute of Biophysics, Biological Research Centre, Hungarian Academy of Sciences, Temesvári krt. 62.,
Szeged, Hungary
4 Bio-Nanosystems Laboratory, Research Institute of Biomolecular and Chemical Engineering, University of Pannonia, Egyetem u. 10, Veszprém, Hungary
* Corresponding author
Email: horvath.robert@energia.mta.hu, Phone: 003613922696 3
4 5 6 7 8 9 10 11 12 13 14 15 16 17 18 19 20 21 22 23 24 25 26 27 28 29 30 31 32 33 34 35 36 37 38 39 40 41 42 43 44 45 46 47 48 49 50 51 52 53 54 55 56
Abstract
In the present study, we monitor the adsorption-desorption kinetics and adsorbed layer structure of the bacterial protein flagellin in the presence of Hofmeister salts by a surface sensitive label-free optical biosensor (optical waveguide lightmode spectroscopy, OWLS).
The recorded OWLS data were analyzed by a computer code using a set of coupled differential equations modeling the adsorption-desorption process. By supposing reversibly and irreversibly adsorbed protein states with different adsorption footprints, the kinetic data could be perfectly fitted. We revealed that the proteins adsorbing in the presence of kosmotropic salts had smaller footprints, leading to a more oriented and densely packed layer.
Kosmotropic salts increased both the adsorption rate constant and the transition rate constants from the reversibly to the irreversibly adsorbed state. In contrast, chaotropic salts increased the desorption rate constant and led to decreased adsorbed mass and a more loosely packed film. Neither circular dichroism spectroscopy in bulk solutions or Fourier transform infrared spectroscopy of surface-adsorbed flagellins could reveal significant structural changes due to the presence of the Hofmeister salts, and supported our conclusions about the adsorption mechanism. Based on the measured kinetic and structural data (footprints of adsorbed proteins), we developed a model to calculate the protein-water-substrate interfacial tension in the presence of Hofmeister salts, and compared the experimentally obtained values with related literature data. The calculated values are consistent with previously published data of surface tension changes, and - to the best of our knowledge - represent the first experimental results for this quantity.
3 4 5 6 7 8 9 10 11 12 13 14 15 16 17 18 19 20 21 22 23 24 25 26 27 28 29 30 31 32 33 34 35 36 37 38 39 40 41 42 43 44 45 46 47 48 49 50 51 52 53 54
1. Introduction
The proper control of interfaces between artificial devices and biomaterials is a key issue in modern biological and medical sciences. Biofunctionalized surfaces, that play a vital role in various biosensor and drug delivery applications, are expected to provide high specificity toward the target molecules, and at the same time should not show any non-specific binding.
In view of these challenging requirements, we have recently suggested and accomplished a procedure for coating of solid surfaces by flagellin molecules. Flagellins are the building blocks of bacterial flagellar filaments. The filament is composed of thousands of flagellin subunits. Flagellin consists of 4 domains: D0, D1, D2, and D3. Both terminal regions of the molecule (forming D0 and partly D1) are disordered in the monomeric form 1. These regions are rich in hydrophobic amino acids and play an important role for effective and fast self- assembly by hydrophobic interactions to form flagellar filaments 1. Polymerization of flagellin is accompanied by an ordering of the terminal regions into α-helical bundles in the inner core of the filaments. Note, these disordered regions are expected to easily adapt to the local environment. As we have shown, flagellin does not preferentially adsorb on hydrophilic substrates, but very rapidly forms an oriented, dense and stable monolayer on hydrophobic surfaces, where the hypervariable D3 domain is oriented towards the solution 2,3. It presents a repellent surface coating to bacteria or cancer cells 3,4. Moreover, appropriate modifications of the D3 domain by genetic engineering can also be used to fabricate specific recognition sites for a wide range of targeted analytes 3,5–7.
For practical applications, the orientation of flagellin molecules and their surface coverage should be maximized and well-controlled. To this end, understanding the main factors determining the interactions of flagellin domains with surfaces is of pivotal importance. Since the formation of the flagellin layer takes place in a complex, aqueous environment, hydrophobic interactions are assumed to play a dominant role. (Note that we use the term
„hydrophobic interaction” in a very general sense, namely, by quantifying it with the change of the interfacial term of the Gibbs free energy by unitary surface change taken place upon the interaction: ∆G/∆A, i.e., a sort of interfacial tension: γ, assuming that the hydrophobic effect is proportional to the solvent-exposed surface area 8–10.) On the other hand, “kosmotropic”
(water-structure making) and “chaotropic” (water-structure breaking) co-solutes (neutral salts) are known to modify protein interactions, called Hofmeister effects 11,12, via affecting the interfacial tension of macromolecules 13,14. A plethora of experimental studies proves that such “Hofmeister salts” can affect protein structure, function, and aggregation 15–20. It was 3
4 5 6 7 8 9 10 11 12 13 14 15 16 17 18 19 20 21 22 23 24 25 26 27 28 29 30 31 32 33 34 35 36 37 38 39 40 41 42 43 44 45 46 47 48 49 50 51 52 53 54 55 56
shown that kosmotropic anions (F-, CH3COO-, SO42-
, etc.) increase, while chaotropic ones (Br-, I-, SCN-, ClO4-
, etc.) decrease the effective protein-water interfacial tension (γ) 14,21. Earlier studies indicate that these ions influence the adsorption process of globular proteins to solid surfaces as well 22,23. Hofmeister effects on the film-forming properties of such a complex, anisotropic and amphiphilic protein as flagellin, however, have not been investigated in detail, yet.
In this paper, we have studied how Hofmeister salts affect the morphological properties of thin flagellin films, and provide indirect evidence that flagellin adsorption to a hydrophobic surface is mainly governed by hydrophobic effects” (i.e., by surface terms of the Gibbs free energy). To monitor the adsorption process optical waveguide lightmode spectroscopy (OWLS) was used. OWLS utilizes two modes of the light passing in the waveguide: the transversal electric (TE) and magnetic (TM) modes which provide information not only about the amount but on the anisotropy of the adsorbed layer as well. OWLS is also perfectly suited to analyze adsorption-desorption processes with high resolution 24–26. We show that kosmotropic salts increase flagellin packing density and molecular orientation, while chaotropic ions act in the opposite direction. To analyze the data and to determine the key parameters of the adsorption-desorption process, we set up two kinetic models (a parallel and a consecutive) based on a series of coupled differential equations. Importantly, not only the rate constants of the adsorption-desorption processes were fitted, but our model allowed to determine the footprints of the adsorbed proteins at the nanometer scale. Circular dichroism spectroscopy (CD) and Fourier transform infrared experiments in attenuated total reflection mode (FTIR-ATR) have been used to detect conformational changes of flagellins upon adsorption to solid surfaces under the effect of the presence of characteristic Hofmeister salts.
Based on the fitted kinetic rate constants of the processes and the adsorbed molecular footprints, we set up a model to first experimentally derive a quantitative value of the protein interfacial tension (PIT). PITs are useful parameters to interpret Hofmeister phenomena, such as, e.g., cosolute-induced changes of aggregation and conformational states, or related alteration in protein function, where protein-water interfacial tension (γpw) can be considered as the main driving force of the effects 13,14 .
Analogously, the interaction of proteins with various substrates, which can either be molecular ones (such as cofactors, lipids, nucleic acids and other proteins) or macroscopic 3
4 5 6 7 8 9 10 11 12 13 14 15 16 17 18 19 20 21 22 23 24 25 26 27 28 29 30 31 32 33 34 35 36 37 38 39 40 41 42 43 44 45 46 47 48 49 50 51 52 53 54
phenomenological level using a more complex PIT, the protein-water-substrate interfacial tension (γpws). We define this quantity as the specific work of adhesion, i.e., γpws = ∆G/∆A, where ∆G and ∆A stand for molecular changes of the Gibbs free energy accompanying the interactions and water-exposed surface area change upon the protein adsorption process, respectively. Since γpws, alike surface tensions in general, represents an interfacial energy density, we call it, hereafter, interfacial tension. Note that while in protein aggregation the pairwise interacting surfaces are considered to be identical (and ∆G is called cohesion energy), during surface adsorption they are usually different. Nonetheless, γpw can be considered as a special case of the generalized PIT, γpws, which quantifies the strength of the hydrophobic interaction between protein and substrate. It should depend on the hydrophobic/hydrophilic properties of both the substrate and the protein, as well as on the H- bonding properties of water itself, which are modulated by the Hofmeister salts. As we show later in this work, γpws = (γpw + γsw - γps), where indices refer to the phases (p: protein, w:
aqueous solution, s: substrate) involved in the pairwise interfacial tensions, respectively.
We determined γpws values to characterize the interaction of flagellins with a silanized surface in various kosmotropic and chaotropic salt solutions, giving a simple clue to interpret the protein adsorption process.
In addition to their significance in applied biosensors, the results are expected to have important implications in basic surface science, as well, by revealing some aspects of the adsorption kinetic and protein dynamic processes taking place at complex bio-interfaces.
3 4 5 6 7 8 9 10 11 12 13 14 15 16 17 18 19 20 21 22 23 24 25 26 27 28 29 30 31 32 33 34 35 36 37 38 39 40 41 42 43 44 45 46 47 48 49 50 51 52 53 54 55 56
2. Materials and Methods
2.1. Employed Hofmeister solutions
We applied different salts to influence the protein adsorption: Na2SO4, NaF, CH3COONa (hereafter NaOAc) (kosmotropic), NaCl (neutral), NaBr, NaI, NaClO4 (chaotropic), respectively. During the experiments Hofmeister salt concentrations were 720 mM in the presence of 1x PBS at pH 7.4.
2.2. Surface modification
The surface modification of the sol-gel SiO2-TiO2 planar optical waveguides (MicroVacuum Ltd., Hungary) started with a standard cleaning protocol: the chips were soaked for 3 min in chromosulfuric acid (VWR International), rinsed in Milli-Q ultrapure water, immersed into 1 M KOH solution, and then rinsed in copious amounts of ultrapure water. This procedure yielded hydrophilic surface.
The hydrophobicity of surfaces was increased with hexamethyldisilazane (HMDS, Alfa Aeasar) treatment using xylene reflux. The employed protocol resulted in water contact angles of 90–95○2.
2.3. Contact angle measurement
Water contact angle measurements were carried out at room temperature. Water drops of
~5 µl were deposited on the surface and left to be stabilize in a closed chamber saturated with water vapor before the image was taken. The DropSnake method was used to calculate the contact angle 27.
2.4. Flagellin preparation and solutions
Filament samples from Salmonella cells were prepared as described earlier 28. Purified filaments were dissolved in 10 mM PBS at 5 mg/ml concentration. Heat treatment (15 min incubation at 70 ºC) of the filament induces depolymerization and results in monomeric flagellin units. The solution was centrifuged through a 100 kDa filter (Millipore, UFC510008) to remove aggregates or fragments of filaments still remaining in the sample. Flagellin was diluted with the appropriate 900 mM salt solution (limited by the solubility of NaF) to a final concentration of 1 mg/mL in 720 mM salt.
3 4 5 6 7 8 9 10 11 12 13 14 15 16 17 18 19 20 21 22 23 24 25 26 27 28 29 30 31 32 33 34 35 36 37 38 39 40 41 42 43 44 45 46 47 48 49 50 51 52 53 54
2.5. Optical waveguide lightmode spectroscopy (OWLS)
We applied the OWLS 210 (MicroVacuum Ltd., Hungary) temperature controlled instrument to monitor the surface adsorption of the proteins. The sensing principle of OWLS is based on the evanescent waves of the guided light. The evanescent field extends a few hundred nanometers above the waveguide surface with a penetration depth of around 100 nm. This is used to probe the change in local refractive index in the proximity of the sensor surface 29. Recording the effective refractive index values (NTE, NTM) during the adsorption of protein molecules onto the waveguide surface, the refractive index (nA) and the thickness (dA) of the adsorbed layer can be simultaneously determined. The surface mass density (M) can be calculated using the calculated nA and dA data and the de Feijter’s formula 30
= −
(1)
where nC is the refractive index of the cover medium, dn/dc is the refractive index increment of the buffer medium containing the adsorbing molecules (usually 0.18 cm3/g is used for protein adsorption studies).
The experiments were carried out at 25 ºC on previously silanized sensor chips. Both the buffer and sample solutions were injected into the flow-through cuvette using an Ismatec Reglo Digital peristaltic pump having 8 rollers at a constant flow rate of 1 µl/s. After obtaining a stable buffer baseline, the flagellin solution was introduced into the cuvette for 30 min which was followed by another 30 min buffer wash. All experiments were repeated at least three times.
2.6. The basics of the kinetic modeling
In order to model the flagellin adsorption and desorption, the following two models were tested. We have developed a MATLAB code to fit the equations. These models were originally developed by Ramsden and co-workers 31–33. The consecutive model supposes a reversibly adsorbed molecular state which can desorb or transform to an irreversibly adsorbed state. In contrast, no surface transformations are supposed in the parallel model, the molecules can readily adsorb from solution to an irreversible or a reversible molecular state.
Parallel model
In case of the parallel model the net rates of the protein adsorption of the reversible and irreversible forms are the following:
3 4 5 6 7 8 9 10 11 12 13 14 15 16 17 18 19 20 21 22 23 24 25 26 27 28 29 30 31 32 33 34 35 36 37 38 39 40 41 42 43 44 45 46 47 48 49 50 51 52 53 54 55 56
d
d = Φ − (2)
d
d = Φ (3)
We suppose that the protein can adopt two types of adsorbed states on the surface. The first state refers to reversibly adsorbed molecule with a total protein mass of Mr. The other state is that of the irreversibly adsorbed molecules, having a total mass of Mi. Molecules from the close vicinity of the surface adsorb reversibly with a kinetic rate constant of ka. The reversibly adsorbed molecules can leave the surface back to the bulk with a desorption rate constant of kd. The molecules adsorb irreversibly to the surface with a kinetic rate constant of ki. In the following expressions, cv denotes the protein concentration in the diffusion boundary layer, Φ is the so-called available area function, which was obtained from numerical simulations 31
= 1 −
1 − 0.812 ∙ + 0.2336 ∙ $+ 0.0845 ∙ (4)
= 1 Θ∞'
(/*+
(/*+ (5)
Here, Θ is the fraction of total area occupied by adsorbed protein, Θ∞ is the saturation coverage (Θ∞ = 0.58 from numerical simulations for molecules with spherocylinderic footprint 34), m is the mass of a single protein, ai and ar are the footprints of the reversibly and irreversibly adsorbed molecules, respectively. The concentration above the adsorbing interface (cv) is calculated from the following differential equation 24,35:
d
d =1
, -./012−
, + − + Φ3 (6)
where δ is the thickness of the diffusion boundary layer, D is the diffusion coefficient of the protein (D = 0.74 cm3/g for flagellin), cbulk is the concentration of the injected protein solution.
The thickness of the diffusion boundary layer is calculated using the following expression 24: , = '3
2+
$ 4'. ∙ 5
67 +8 4 (7)
3 4 5 6 7 8 9 10 11 12 13 14 15 16 17 18 19 20 21 22 23 24 25 26 27 28 29 30 31 32 33 34 35 36 37 38 39 40 41 42 43 44 45 46 47 48 49 50 51 52 53 54
where C is the factor determined by the size of the tube (C = 14.753 mm4 calculated based on the cuvette geometry), and v0 is the flow rate of the solution (v0 = 1 µl/s).
During the fitting of the above differential equations the free parameters were the following:
ka, kd, ki, ai, and ar.
Consecutive model
In case of the consecutive model, the net rates of the adsorption corresponding both to the reversible and irreversible forms are the following 32,33:
d
d = Φ − − (8)
d
d = (9)
Molecules from the close vicinity of the surface adsorb with a kinetic rate constant of ka. The reversibly adsorbed molecules can either leave the surface moving back to the bulk with a desorption rate constant of kd or can transform to irreversibly adsorbed state with a rate constant of ki.
The concentration above the adsorbing interface is calculated from the following differential equation:
d
d =1
, -./012−
, + − Φ3 (10)
2.7 Circular dichroism spectroscopy
Far-UV CD spectra were recorded at room temperature in the range of 200-260 nm using standard procedures. The measurements were performed in 1 mm cylindrical quartz cells with a Jasco J-720 spectropolarimeter. Flagellin samples were measured at 0.5 mg/ml protein concentration.
2.8. Fourier transform infrared spectroscopy
Fourier transform infrared spectra were recorded with a Bruker Wertex70 spectrometer equipped with a Platinum Diamond single-reflection ATR unit. Infrared spectra were calculated from 128 co-added interferograms of 2 cm-1 spectral resolution, detected by a liquid nitrogen-cooled MCT detector.
3 4 5 6 7 8 9 10 11 12 13 14 15 16 17 18 19 20 21 22 23 24 25 26 27 28 29 30 31 32 33 34 35 36 37 38 39 40 41 42 43 44 45 46 47 48 49 50 51 52 53 54 55 56
The infrared spectra of the adsorbed flagellin were obtained from samples prepared as follows: a droplet (3-5 µl) of the protein solution was placed onto the silanized (hydrophobic) surface, which was left for 3 min in order to deposit the flagellin layer, and then the bulk of the droplet was withdrawn by a pipette. The remaining spot of the droplet was washed twice with 20 µl solution of the respective salt, in between, and at the end the excess volume was withdrawn by a pipette. The wet surface of the flagellin spot was then pressed against the diamond, and its single beam spectrum was taken. Here, care has to be taken of rather quick work because the very small volume of the D2O of the sample is quickly adsorbing water from air. Within a few minutes before the complete drying, not only HOD bands, but the H2O deformation band at around 1642 cm-1 can appear, thus spoiling the protein structure determination. Therefore, in the presented experiments the washed sample was immediately placed onto the diamond crystal. Once on the crystal, we could not observe H2O contamination in the samples.
Prior to each sample measurement, the diamond crystal was thoroughly cleaned with water and chloroform, and a reference single beam spectrum was recorded (the cleanness of the diamond was checked by comparing the consecutive reference spectra). The absorption spectra shown in the paper were calculated from the single beam diamond and sample spectra taken them as background and foreground, respectively.
For spectrum analysis, the amide I-II regions (1800-1500 cm-1) were cut out; a linear baseline was fitted to the endpoints of the region and then subtracted. Afterwards the spectra were normalized and fitted with Gaussian component bands. All post-record spectral manipulations were performed with the SPSERV (Cs. Bagyinka, BRC, Szeged).
3 4 5 6 7 8 9 10 11 12 13 14 15 16 17 18 19 20 21 22 23 24 25 26 27 28 29 30 31 32 33 34 35 36 37 38 39 40 41 42 43 44 45 46 47 48 49 50 51 52 53 54
3. Results and Discussion
3.1. Surface adsorption of flagellin monitored by OWLS: surface adsorbed mass densities
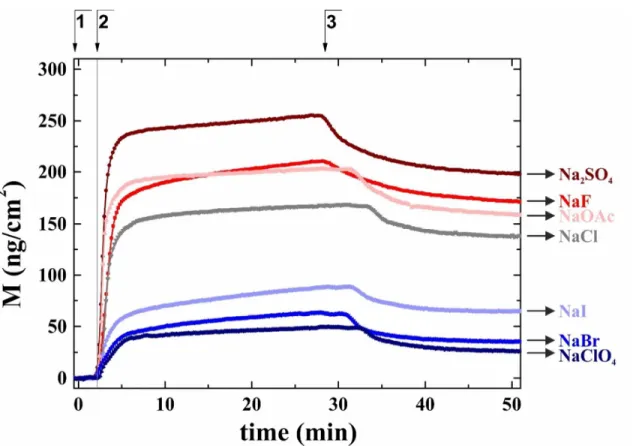
First, the optogeometrical parameters of the formed flagellin layers were calculated in time based on the recorded OWLS data. Note, the refractive index of the adlayer is increased from kosmotropic to chaotropic salt (see details later). Next, surface mass densities (as described in Eq. 1) were determined for flagellin adsorbed in the presence of different Hofmeister salts (Fig. 1). As a reference, the adsorption in the presence of the Hofmeister-neutral NaCl was also considered. It was found that the kosmotropic Na2SO4, NaF and NaOAc salts increased the surface mass densities. In contrast, the chaotropic NaI, NaClO4 and NaBr salts decreased the surface mass densities (see Fig. 1).
Figure 1 Representative curves of the adsorbed protein surface mass densities in the presence of Hofmeister salts. The kosmotropic salts (red toned) increased the surface mass, while chaotropic salts (blue toned) decreased the surface mass compared to the Hofmeister-neutral NaCl salt (grey). The numbers on the top indicate the following experimental phases: 1:
buffer for recording the baseline, 2: injection of flagellin solution, 3: washing with buffer.
3 4 5 6 7 8 9 10 11 12 13 14 15 16 17 18 19 20 21 22 23 24 25 26 27 28 29 30 31 32 33 34 35 36 37 38 39 40 41 42 43 44 45 46 47 48 49 50 51 52 53 54 55 56
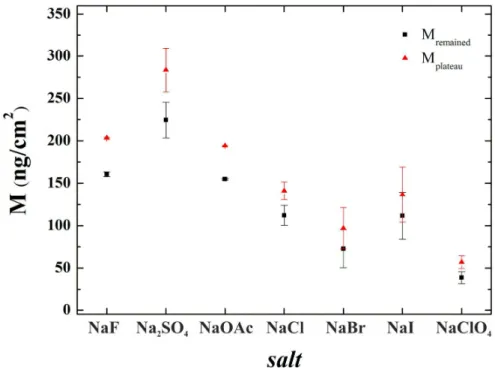
The effect of the salts is even more evident in Fig. 2 where the surface adsorbed masses at the adsorption plateau (just before the washing, Mplateau) and at the end of the washing phase (Mremained) are plotted. Compared to the NaCl data, the kosmotropes increased the surface mass densities, while the chaotropes decreased them.
Figure 2Mremained and Mplateau values (extracted from the adsorption curves shown in Fig. 1) for the different salts studied. Note, that Hofmeister effect is clearly visible both in the plateau and the remaining values of the adsorbed flagellin masses. Both are decreasing in tendency when moving from the kosmotropic salts toward the chaotropic ones.
3 4 5 6 7 8 9 10 11 12 13 14 15 16 17 18 19 20 21 22 23 24 25 26 27 28 29 30 31 32 33 34 35 36 37 38 39 40 41 42 43 44 45 46 47 48 49 50 51 52 53 54
3.2. The effect of Hofmeister salts on the internal structure of dissolved and surface adsorbed flagellin
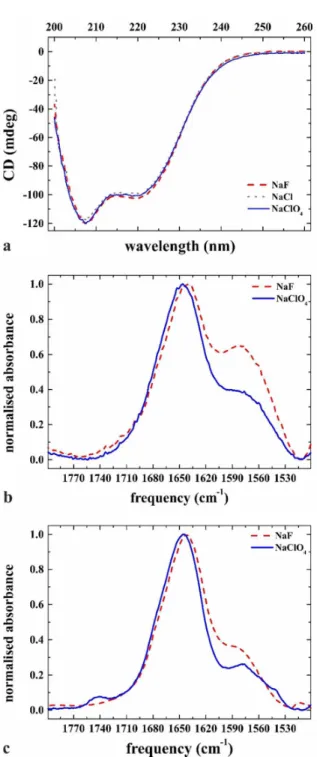
CD and FTIR studies were performed to see the effect of Hofmeister salts on the structure of flagellin in solution, and to reveal possible conformational changes upon adsorption onto hydrophobic surfaces. The CD spectra recorded in the presence of various Hofmeister salts were very similar (Fig. 3a) indicating that the salts applied had no significant effect on the structure of flagellin in solution. The measured spectra are virtually identical to the CD spectrum of flagellin reported earlier 36, and they are characteristic of a protein containing a significant amount of α-helical secondary structure. The D1 domain of flagellin is known to be largely α-helical while the D2-D3 domains are dominated by β-strands 1. The D0 domain, composed of the N- and C-terminal regions of the molecule, has no folded structure in solution but its unstable helical segments also contribute to the observed CD signal 36.
3 4 5 6 7 8 9 10 11 12 13 14 15 16 17 18 19 20 21 22 23 24 25 26 27 28 29 30 31 32 33 34 35 36 37 38 39 40 41 42 43 44 45 46 47 48 49 50 51 52 53 54 55 56
Figure 3 (a) The effect of the Hofmeister salts in solution on the flagellin structure measured by CD spectroscopy. The measurements were done in 10 mM PBS (pH 7.4) containing the kosmotropic NaF (red), the neutral NaCl (grey) or the chaotropic NaClO4 (blue) at 720 mM concentration. (b) Fourier transform infrared spectra of the Amide I regions of flagellin in bulk solution measured over a diamond crystal in the presence of kosmotropic (NaF, blue) and chaotropic (NaClO4, red) Hofmeister salts; (c) after adsorption onto a silanized glass surface in the presence of the same Hofmeister salt-containing solutions.
3 4 5 6 7 8 9 10 11 12 13 14 15 16 17 18 19 20 21 22 23 24 25 26 27 28 29 30 31 32 33 34 35 36 37 38 39 40 41 42 43 44 45 46 47 48 49 50 51 52 53 54
FTIR spectroscopy was used to study conformational changes related to the surface adsorption of flagellin. As a reference, infrared spectra were first recorded in solution in the presence of the highly kosmotropic and chaotropic NaF and NaClO4, respectively above the diamond surface of the ATR cell (Fig. 3b). For both salts, the Amide I region exhibited a dominant peak at around 1650 cm-1, what is slightly shifted toward lower frequency in the presence of the kosmotropic NaF suggesting subtle conformational rearrangements presumably in the highly flexible terminal regions of flagellin. The component at around 1580 cm-1 is assigned to the combination band of D2O (ν2 + vibration). Flagellin samples were prepared by heat-induced depolymerization of filament samples dissolved in D2O containing buffers, but the extent of the H-D exchange was not controlled in our experiments. Fig. 3c presents FTIR spectra of flagellin obtained after adsorption onto the hydrophobic surface in the presence of NaF or NaClO4. The close similarity of the spectra in Fig. 3b and c in the Amid I region demonstrates that adsorption of flagellin onto the hydrophobic surface did not cause significant structural change of the molecule.
Our CD and FTIR experiments demonstrated that the solution structure of flagellin was not significantly influenced by the kosmotropic or chaotropic salts. Our previous study revealed that adsorption of flagellin to a hydrophobic surface in PBS was mediated by the disordered terminal regions of the molecule 2. These regions assemble into amphipathic helical bundles upon polymerization, and hydrophobic interactions between these helical bundles govern subunit interactions within the filament core 1. Our preliminary expectation was that the terminal regions of flagellin are also stabilized into an α-helical conformation when they interact with a hydrophobic surface. However, our FTIR results clearly showed that this was not the case. Helical structures are known to contribute to the FTIR signal mainly in the 1648- 1654 cm-1 region while random protein structures give a contribution around 1643 cm-1 37. Therefore, helical stabilization of the terminal regions should result in a spectral shift towards higher wavenumbers. On the contrary, in the presence of the highly kosmotropic NaF which is expected to strengthen hydrophobic interactions, we observed the opposite effect. It seems that NaF promotes the attachment of flagellin to the silanized surface by inducing subtle rearrangements in the terminal regions which lead to the maximization of the hydrophobic contacts with the silanized glass surface.
3
4 5 6 7 8 9 10 11 12 13 14 15 16 17 18 19 20 21 22 23 24 25 26 27 28 29 30 31 32 33 34 35 36 37 38 39 40 41 42 43 44 45 46 47 48 49 50 51 52 53 54 55 56
3.3. Rate constants and adsorbed molecular footprints obtained from the kinetic modeling
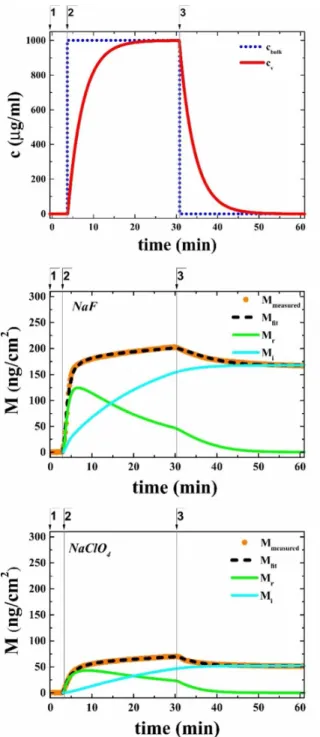
Fig. 4a shows the typical concentration profile in the bulk and in the diffusion boundary layer analyzed using the parallel model. Note that the consecutive model gives the same results (data are not shown). The results of the kinetic model fits are shown in Fig. 4b and c for two typical adsorption-desorption curves. Fig. 4b represents the effect of the kosmotropic salt, NaF. NaF increased the measured irreversibly adsorbed protein surface mass density to 168 ng/cm2. It was found that a significant proportion of the adsorbed protein binds irreversibly to the hydrophobic surface. The kinetics of flagellin adsorption in the presence of the chaotropic NaClO4 is shown in Fig. 4c. Here, the irreversibly adsorbed flagellin mass reached only a value of 50 ng/cm2, which is 3.4 times less than in case of the kosmotropic NaF.
3 4 5 6 7 8 9 10 11 12 13 14 15 16 17 18 19 20 21 22 23 24 25 26 27 28 29 30 31 32 33 34 35 36 37 38 39 40 41 42 43 44 45 46 47 48 49 50 51 52 53 54
Figure 4 Adsorption-desorption kinetics of flagellin in extreme kosmotropic (NaF) and chaotropic (NaClO4) solutions evaluated using the parallel model. (a) Calculated concentration profile of the bulk (cbulk) and the diffusion boundary layer (cv) in the presence of NaClO4 salt. Flagellin adsorption curves (orange - measured, black - fitted, green - reversibly, cyan - irreversibly adsorbed surface mass density) in the presence (b) of the kosmotropic NaF and (c) of the chaotropic NaClO4. The numbers on the top of the panels indicate the following experimental phases: 1: starting buffer for recording the baseline; 2:
administering flagellin solution; 3: washing with buffer.
3 4 5 6 7 8 9 10 11 12 13 14 15 16 17 18 19 20 21 22 23 24 25 26 27 28 29 30 31 32 33 34 35 36 37 38 39 40 41 42 43 44 45 46 47 48 49 50 51 52 53 54 55 56
All kinetic parameters obtained using both the parallel and the consecutive model are shown in Fig. 5 and summarized in Table S1 (see in Supplementary Document).
In case of the parallel model, the ka and ki values decrease from kosmotropic to chaotropic salts (Fig. 5a and c). The kd values increase from kosmotropes to chaotropes (Fig. 5b). The consecutive model demonstrates the same tendency for ka and kd values (Fig. 5d and e). The ki values do not show a clear tendency (Fig. 5f).
3 4 5 6 7 8 9 10 11 12 13 14 15 16 17 18 19 20 21 22 23 24 25 26 27 28 29 30 31 32 33 34 35 36 37 38 39 40 41 42 43 44 45 46 47 48 49 50 51 52 53 54
Figure 5 The effect of the Hofmeister series on the reversible adsorption (ka), the dissociation (kd), as well as the irreversible adsorption (ki)rate constants when using (a, b, c) the parallel or (d, e, f) the consecutive model for their calculation.
3 4 5 6 7 8 9 10 11 12 13 14 15 16 17 18 19 20 21 22 23 24 25 26 27 28 29 30 31 32 33 34 35 36 37 38 39 40 41 42 43 44 45 46 47 48 49 50 51 52 53 54 55 56
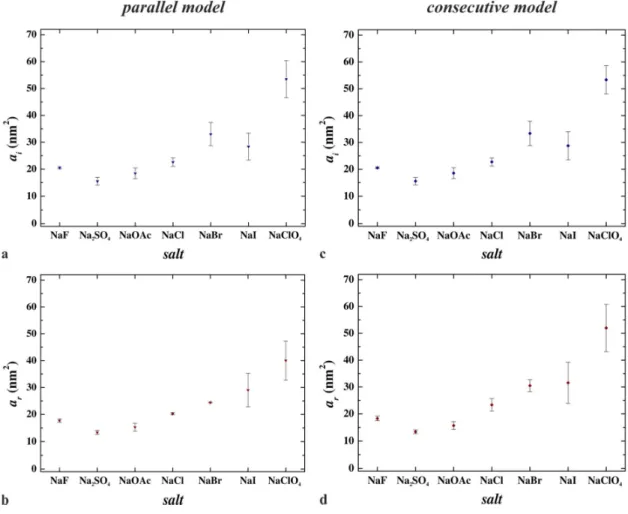
Another parameter of the adsorbed protein is the footprint, which refers to the average area occupied by an adsorbed molecule. The footprints of the reversibly (ar) and irreversibly (ai) adsorbed flagellin molecules are shown in Fig. 6. Their numerical values are summarized in Table S2. It can be seen that both the reversibly and the irreversibly adsorbed footprint of the flagellin increases from kosmotropes to chaotropes in case of both the parallel and the consecutive models.
Figure 6 Change of the footprints of reversibly and irreversibly adsorbed flagellin molecules from kosmotropic salts (NaF, Na2SO4, NaOAc) to chaotropic salts (NaBr, NaI, NaClO4) in case of (a, b) the parallel as well as (c, d) the consecutive model.
3 4 5 6 7 8 9 10 11 12 13 14 15 16 17 18 19 20 21 22 23 24 25 26 27 28 29 30 31 32 33 34 35 36 37 38 39 40 41 42 43 44 45 46 47 48 49 50 51 52 53 54
3.4. Adsorbed protein layer structure during the adsorption and desorption process In the following, we investigate in detail the structural changes occurring in the formed protein layer during the adsorption and desorption processes. Our previous work already indicated that flagellin adsorbs on hydrophobic surfaces in an oriented manner, namely, through the disordered terminal regions 2. However, experiments conducted with a truncated flagellin variant (F40), missing the disordered regions, also revealed a significant surface adsorption, but, with a much slower adsorption rate. This observation indicates that besides the disordered region other parts of the protein can also play a role in the adsorption process.
We, therefore concluded that when the disordered region is present, the adsorption is dominant through this part of the protein in the presence of a Hofmeister-neutral salt 2.
It has to be noted; CD and FTIR experiments suggested that the folded structure of flagellin is only marginally affected by the Hofmeister salts or by adsorption onto hydrophobic surfaces.
On the other hand, the previously detailed results revealed, that Hofmeister salts have a strong influence on the adsorption process and both the kinetic rate constants and adsorbed molecular footprints are strongly influenced. These results indicate that most probably the surface orientation, and not the internal structure of the molecule is affected by the Hofmeister salts.
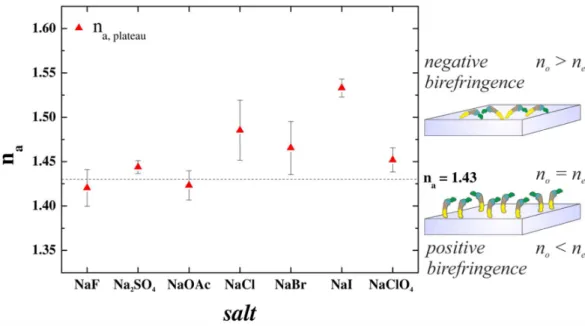
This hypothesis is fully supported by investigating the quasi-homogeneous and isotropic refractive index of the adsorbed molecular layer 25 (see Fig. 7). The effect of Hofmeister salts can be clearly seen on the variation of refractive index. From kosmotropes to chaotropes the indicated birefringence turns from slightly positive to significantly negative 2,25,26. This can be an indication that while in kosmotropic salts the molecules are oriented towards the surface by their terminal regions, in chaotropic salts a laid down arrangement is preferred. The previously obtained molecular footprints and Fig. 8 strongly support this conclusion.
3 4 5 6 7 8 9 10 11 12 13 14 15 16 17 18 19 20 21 22 23 24 25 26 27 28 29 30 31 32 33 34 35 36 37 38 39 40 41 42 43 44 45 46 47 48 49 50 51 52 53 54 55 56
Figure 7 Variation of the refractive index of the flagellin layer along the Hofmeister series.
Moving from kosmotropic to chaotropic salts the measured birefringence turns from slightly positive to significantly negative.
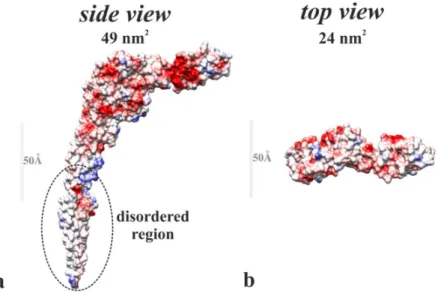
In Fig. 8 the side and top view of the flagellin molecule are shown. The calculated footprint of the top view is approximately 24 nm2, while the footprint of the side view is 49 nm2, in good agreement with the above results. Note, the footprint values obtained from the kinetic modeling smaller than 24 nm2 indicate a very densely packed layer, and can be attributed to the slight tilt of the surface showed in Fig. 8b with respect to the surface of the biosensor.
3 4 5 6 7 8 9 10 11 12 13 14 15 16 17 18 19 20 21 22 23 24 25 26 27 28 29 30 31 32 33 34 35 36 37 38 39 40 41 42 43 44 45 46 47 48 49 50 51 52 53 54
Figure 8 Side (a) and top view (b) of the flagellin molecule. The surface of the protein is colored according to the local charge, from red (-) to blue (+) scale. The parts close to the white show the hydrophobic regions. The footprint of the top view is approximately 24 nm2, while the footprint of the side view is 49 nm2.
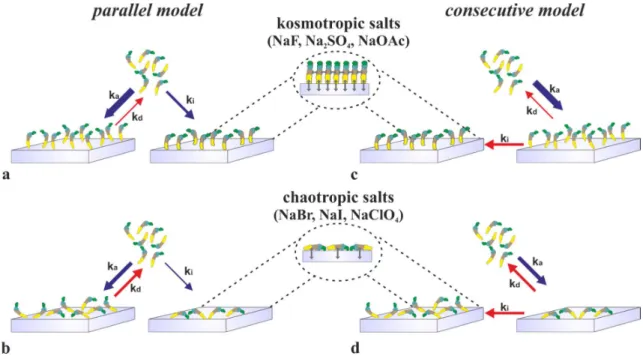
The results of the above findings are summarized in Fig. 9, where the preferred molecular orientations in the various adsorbed states are shown. In short, the salts are mainly influence the preferred adsorption surface in the various molecular states. In case of kosmotropic salts, flagellin adsorbs through its disordered terminal regions via hydrophobic interaction and an oriented adsorbed layer is obtained. Lateral hydrophobic interactions between the D1 domains of the subunits, as observed in the filament, might also play a role in the stabilization of the oriented layer. (Fig. 9 upper inset). But, in chaotropic salts the hydrophobic interaction is weakened and the laid down molecular orientation becomes dominant. Flagellin molecules lie on the longitudinal axis on the surface resulting in a significantly larger adsorbed footprint (see Fig. 9 bottom inset).
3 4 5 6 7 8 9 10 11 12 13 14 15 16 17 18 19 20 21 22 23 24 25 26 27 28 29 30 31 32 33 34 35 36 37 38 39 40 41 42 43 44 45 46 47 48 49 50 51 52 53 54 55 56
Figure 9 Schematic illustration of the adsorption kinetics of flagellin proteins on a hydrophobic surface (regarding the dimensions, the blue arrow refers to cm/s, while the red arrow to 1/s, respectively). (a) The kosmotropes (Na2SO4, NaF, NaOAc) increase the irreversible adsorption of the flagellin. The footprint of the protein suggests that the flagellin D0 domain interacts with the hydrophobic surface. (b) The chaotropes (NaBr, NaI, NaClO4) increase the dissociation of the flagellin. The footprint of the protein suggests that the flagellin lies along its longitudinal axis on the surface.
Upper inset shows the supposed interactions between the flagellin and the surface, and the interactions between the proteins. Bottom inset represents the interactions between the laid down flagellins and the surface.
3 4 5 6 7 8 9 10 11 12 13 14 15 16 17 18 19 20 21 22 23 24 25 26 27 28 29 30 31 32 33 34 35 36 37 38 39 40 41 42 43 44 45 46 47 48 49 50 51 52 53 54
3.5 A simple model to determine the protein-water-substrate interfacial tension in the presence of Hofmeister salts
The above results can be used to estimate the protein-water-substrate interfacial tension (γpws) of the flagellin protein related to the adsorption process, and its dependence on the Hofmeister salts. We define this new type of surface tension as the specific work of adhesion/adsorption during the protein adsorption process as follows.
One can write for the work of adsorption (Gibbs free energy change characterizing the adsorption process)
∆9: = ∆9;<+∆9:<+∆9;: , (11) where ∆9;<,∆9:< and ∆9;: are the free energy changes at the protein-water (protein- solvent), substrate-water (substrate-solvent) and protein-substrate interfaces. Supposing that a surface adsorbed protein has an area Aads in contact with the substrate and this area was fully exposed to the solvent in the dissolved state before adsorption (Therefore, Aads area is disappearing at the protein-water and substrate-water interfaces, and Aads area is appearing at the protein-substrate interface upon the protein adsorption process), one can write
∆9:= −D;<E:−D:<E:+ D;:E: , (12) where D;<, D:< and D;: are the protein-water, substrate-water and protein-substrate interfacial surface tensions, respectively. Therefore, eq. 12 can be written as
∆9:= −D;<+ D:<− D;: E:= −D;<: E: (13) where D;<: is the introduced protein-water-substrate surface tension (γpws = (γpw + γsw - γps)).
The adsorption and desorption are thermally activated processes and one can write the following equation
∙ = FG
∆HIJK
LM∙N (14)
where kB is the Boltzmann constant, T is the absolute temperature. Note, the appearance of the d factor, characterizing the thickness of the surface layer, is due to the conversion of ka
with dimensions of cm/s to ka' with dimension of 1/s. (This simple term converts the volume concentration to surface concentration in a straightforward manner and must be introduced due to the different dimensions of ka and kd. Simply, proteins closer to the substrate surface 3
4 5 6 7 8 9 10 11 12 13 14 15 16 17 18 19 20 21 22 23 24 25 26 27 28 29 30 31 32 33 34 35 36 37 38 39 40 41 42 43 44 45 46 47 48 49 50 51 52 53 54 55 56
than d are considered to be surface adsorbed. For example, according to this conversion the adsorption term in Eq. 2 is modified to O ∙ [∙ ;] ∙ , with O =RI.)
Therefore, after rearrangement one obtains
∆ 9:= − S∙ T ∙ ln
∙ (15)
d = 10 nm was employed in the numerical calculations, which value is a reasonable approximation of the thickness of the surface adsorbed protein layer. (Note, the calculations were also performed with two additional values (5 nm and 20 nm), which resulted only in slight differences in the ∆Gads values.)
From Eq. 15 one obtains the following equation for γpws by using its above definition (∆9: = − D;<:∙ E:):
DVWX = kZ∙ T
E: ∙ ln
∙ (13)
where E:A is the adsorption surface area, supposed to be equal to ar in further calculations.
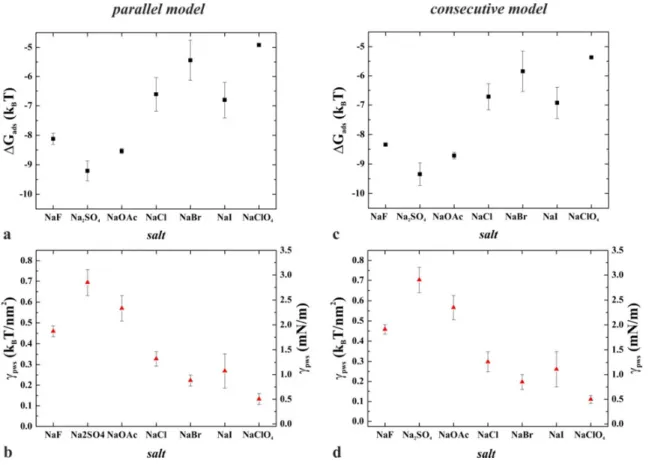
Fig. 10 shows the dependence of ∆Gads and γpws on the employed Hofmeister salts.
3 4 5 6 7 8 9 10 11 12 13 14 15 16 17 18 19 20 21 22 23 24 25 26 27 28 29 30 31 32 33 34 35 36 37 38 39 40 41 42 43 44 45 46 47 48 49 50 51 52 53 54
Figure 10 (a, c) Calculated Gibbs free energy difference of the adsorbed and desorbed states and (b, d) protein-water-substrate interfacial tension in the presence of Hofmeister salts supposing parallel and consecutive kinetic models to analyze the OWLS data.
It is apparent that, within the error, both models yielded the same results for the interfacial tension values that essentially follow the Hofmeister series. The only outlier, fluoride slightly deviates from the expected trend, which might be attributed to specific interactions with the protein surface. In general, it can be established that the salt-dependence of all the essential measured quantities (adsorbed mass, kinetic constants, footprints, etc.) follows the tendency of the interfacial tension plots: kosmotropic salts increase γpws that accompanies with higher adsorbed mass and order parameter, while chaotropic salts exert opposite effects. These observations, together with the model-independence of γpws values, suggest that, similarly to the role of protein-water interfacial tension in the interpretation of conformation-related phenomena, protein-water-substrate interfacial tension can be considered as a central parameter in the phenomenological description of protein adsorption processes.
3 4 5 6 7 8 9 10 11 12 13 14 15 16 17 18 19 20 21 22 23 24 25 26 27 28 29 30 31 32 33 34 35 36 37 38 39 40 41 42 43 44 45 46 47 48 49 50 51 52 53 54 55 56
To our knowledge, this is the first time when explicit, quantitative experimental data are shown for the absolute value of a protein interfacial tension, namely the protein-water- substrate interfacial tension. Note that, this quantity depends on the water-exposed protein surface (i.e., the hydrophobic/hydrophilic nature of the amino acids at the interface), the nature of the substrate, and the quality and quantity of dissolved cosolutes, as well. In spite of the technical and conceptual difficulties in determining interfacial tension under microscopic conditions 13, protein-water interfacial tension is considered a key parameter to describe Hofmeister effects and hydrophobic interactions at protein surfaces, in general 14. A higher value implies tighter protein conformation, and increased susceptibility to aggregation and adsorption to hydrophobic surfaces. The latter process, however, is more complex, because the hydrophilic/hydrophobic properties of the substrate should also be taken into account;
hence, it is characterized more precisely with the protein-water-substrate interfacial tension (γpws). As for the related quantity, the protein-water interfacial tension (γpw), only relative values have been published so far, obtained either from numerical simulations of the Trp-cage miniprotein 21 or from cloud-point measurements on lysozyme 38. Both studies revealed molar salt-induced changes of the protein-water interfacial tension in the order of a few mN/m, in concert with the order and tendency of our data. Note that theoretical and experimental studies of Hofmeister effects at various macroscopic surfaces also established "interfacial tension increment" values consistent with our results 39,40, respectively.
3 4 5 6 7 8 9 10 11 12 13 14 15 16 17 18 19 20 21 22 23 24 25 26 27 28 29 30 31 32 33 34 35 36 37 38 39 40 41 42 43 44 45 46 47 48 49 50 51 52 53 54
5. Conclusions
In this work we studied the effect of Hofmeister salts on the structure and surface adsorption kinetics of wild-type flagellin. Based on our OWLS measurements the kosmotropic Na2SO4, NaF and NaOAc salts and the chaotropic NaI, NaClO4 and NaBr salts have different effect on the surface mass densities compared to the Hofmeister-neutral NaCl. The kosmotropes increased the surface mass densities in contrast to the chaotropes, which decreased them.
CD and FTIR experiments revealed the effect of Hofmeister salts on the structure of flagellin in solution and the conformational changes upon adsorption onto hydrophobic surfaces. We investigated the effect of the highly kosmotropic and chaotropic NaF and NaClO4. The results show that the applied salts do not significantly influence the secondary structure of flagellin in solution.
To determine the kinetic parameters of protein adsorption and desorption we used a home-developed MATLAB code fitting protein adsorption models previously developed by Ramsden 31–33. The employed parallel and consecutive models showed the same type of behavior for the ka and kd values. Considering the ki values, the parallel model demonstrated a decrease when moving from kosmotropic to chaotropic salts, while the consecutive model did not show a clear tendency. The adsorbed protein footprint of the individual flagellin molecules were also determined by the kinetic modeling. We obtained that the reversibly and the irreversibly adsorbed footprint of the flagellin increases when moving from kosmotropes to chaotropes.
CD and FTIR experiments showed that the salts do not influence the protein structure in solution and on the surface. In contrast, our data show that the salts have a strong influence on the adsorbed mass, the kinetic rate constants and the adsorbed molecular footprints. These results suggest that most probably the surface orientation, and not the internal structure of the molecule is affected by the Hofmeister salts. We analyzed the quasi-homogeneous and isotropic refractive index of the adsorbed molecular layer and the results obtained supported this hypothesis. From kosmotropes to chaotropes the indicated birefringence turns from slightly positive to significantly negative. We concluded that in case of the kosmotropic salts the molecules are oriented towards the surface by their terminal regions, while in chaotropic salts the protein lie down on the surface with a significantly increased adsorption molecular footprint; the salts influence the preferred adsorption surface of the protein. Therefore, the Hofmeister salts influence protein orientation and the structure of the adsorbed layer.
3 4 5 6 7 8 9 10 11 12 13 14 15 16 17 18 19 20 21 22 23 24 25 26 27 28 29 30 31 32 33 34 35 36 37 38 39 40 41 42 43 44 45 46 47 48 49 50 51 52 53 54 55 56
The experimentally obtained kinetic parameters and molecular footprints gave the unique possibility to build a simple model to calculate the protein-water-substrate interfacial surface tension at the nanometer scale in the presence of various Hofmeister salts. The calculated values are consistent with previously published data of surface tension increments, and - to the best of our knowledge - represent the first experimental results for this quantity.
3 4 5 6 7 8 9 10 11 12 13 14 15 16 17 18 19 20 21 22 23 24 25 26 27 28 29 30 31 32 33 34 35 36 37 38 39 40 41 42 43 44 45 46 47 48 49 50 51 52 53 54
Acknowledgements
This work was supported by the Momentum Program of the Hungarian Academy of Sciences, the ERC_HU and KH_17 projects of NKFIH, the BIONANO_GINOP-2.3.2-15-2016-00017 project and the OTKA grant NN117849. We thank Noemi Kovacs for her work in the development of the MATLAB code used in initial investigations. Robert Horvath gratefully thanks Prof. Jeremy Ramsden for fruitful discussions about protein adsorption kinetics and for his encouragement to work on the present topic.
Supporting Information Available: Kinetic parameters calculated with the parallel and consecutive models. Footprints of the reversibly and irreversibly adsorbed flagellin molecules. Table S1: kinetic parameters calculated with the parallel and consecutive models Table S2: footprints of the reversibly and irreversibly adsorbed flagellin
This material is available free of charge via the Internet at http://pubs.acs.org.
Author Contributions
RH and AD laid down the ideas behind the present work. BKo performed the OWLS experiments with the help of AB and SK. SK developed the surface hydrophobization protocol. The MATLAB code employed for data analysis was developed by RH and AS.
Protein production and CD measurements were performed by BKa, FV. BSz conducted FTIR experiments, analyzed the data and wrote related text. AD supplied the salt solutions. The model to calculate the interfacial surface tension was developed by RH. BKo, AS, AD, FV and RH analyzed the data. BKo made the figures. BKo, AS, AD, FV and RH wrote the paper.
3 4 5 6 7 8 9 10 11 12 13 14 15 16 17 18 19 20 21 22 23 24 25 26 27 28 29 30 31 32 33 34 35 36 37 38 39 40 41 42 43 44 45 46 47 48 49 50 51 52 53 54 55 56
References
(1) Yonekura, K.; Maki-Yonekura, S.; Namba, K. Complete Atomic Model of the Bacterial Flagellar Filament by Electron Cryomicroscopy. Nature 2003, 424 (6949), 643.
(2) Kovacs, N.; Patko, D.; Orgovan, N.; Kurunczi, S.; Ramsden, J. J.; Vonderviszt, F.;
Horvath, R. Optical Anisotropy of Flagellin Layers: In Situ and Label-Free
Measurement of Adsorbed Protein Orientation Using OWLS. Anal. Chem. 2013, 85 (11), 5382.
(3) Kovacs, B.; Patko, D.; Szekacs, I.; Orgovan, N.; Kurunczi, S.; Sulyok, A.; Khanh, N.
Q.; Toth, B.; Vonderviszt, F.; Horvath, R. Flagellin Based Biomimetic Coatings: From Cell-Repellent Surfaces to Highly Adhesive Coatings. Acta Biomater. 2016, 42, 66.
(4) Kovacs, B.; Patko, D.; Klein, A.; Kakasi, B.; Saftics, A.; Kurunczi, S.; Vonderviszt, F.;
Horvath, R. Bacteria Repellent Layer Made of Flagellin. Sensors Actuators B Chem.
2018, 257, 839.
(5) Bereczk-Tompa, É.; Vonderviszt, F.; Horváth, B.; Szalai, I.; Pósfai, M. Biotemplated Synthesis of Magnetic Filaments. Nanoscale 2017, 15062.
(6) Bereczk-Tompa, É.; Pósfai, M.; Tóth, B.; Vonderviszt, F. Magnetite-Binding Flagellar Filaments Displaying the MamI Loop Motif. ChemBioChem 2016, 17 (21), 2075.
(7) Klein, Á.; Kovács, M.; Muskotál, A.; Jankovics, H.; Tóth, B.; Pósfai, M.; Vonderviszt, F. Nanobody-Displaying Flagellar Nanotubes. Sci. Rep. 2018, 8 (1), 3584.
(8) Tanford, C. Interfacial Free Energy and the Hydrophobic Effect. Proc. Natl. Acad. Sci.
U. S. A. 1979, 76 (9), 4175.
(9) Chothia, C.; Janin, J. Principles of Protein–protein Recognition. Nature 1975, 256 (5520), 705.
(10) Record, M. T.; Guinn, E.; Pegram, L.; Capp, M. Introductory Lecture: Interpreting and Predicting Hofmeister Salt Ion and Solute Effects on Biopolymer and Model Processes Using the Solute Partitioning Model. Faraday Discuss. 2013, 160, 9.
(11) Lo Nostro, P.; Ninham, B. W. Hofmeister Phenomena: An Update on Ion Specificity in Biology. Chem. Rev. 2012, 112 (4), 2286.
(12) Okur, H. I.; Hladílková, J.; Rembert, K. B.; Cho, Y.; Heyda, J.; Dzubiella, J.; Cremer, P. S.; Jungwirth, P. Beyond the Hofmeister Series: Ion-Specific Effects on Proteins and Their Biological Functions. J. Phys. Chem. B 2017, 121 (9), 1997.
(13) Dér, A.; Kelemen, L.; Fábián, L.; Taneva, S. G.; Fodor, E.; Páli, T.; Cupane, A.;
Cacace, M. G.; Ramsden, J. J. Interfacial Water Structure Controls Protein Conformation. J. Phys. Chem. B 2007, 111 (19), 5344.
(14) Násztor, Z.; Bogár, F.; Dér, A. The Interfacial Tension Concept, as Revealed by Fluctuations. Curr. Opin. Colloid Interface Sci. 2016, 23, 29.
3 4 5 6 7 8 9 10 11 12 13 14 15 16 17 18 19 20 21 22 23 24 25 26 27 28 29 30 31 32 33 34 35 36 37 38 39 40 41 42 43 44 45 46 47 48 49 50 51 52 53 54
(16) Cacace, M. G.; Landau, E. M.; Ramsden, J. J. The Hofmeister Series: Salt and Solvent Effects on Interfacial Phenomena. Q. Rev. Biophys. 1997, 30 (3), 241.
(17) Khoroshyy, P.; Dér, A.; Zimányi, L. Effect of Hofmeister Cosolutes on the Photocycle of Photoactive Yellow Protein at Moderately Alkaline PH. J. Photochem. Photobiol. B Biol. 2013, 120, 111.
(18) Szalontai, B.; Nagy, G.; Krumova, S.; Fodor, E.; Páli, T.; Taneva, S. G.; Garab, G.;
Peters, J.; Dér, A. Hofmeister Ions Control Protein Dynamics. Biochim. Biophys. Acta 2013, 1830 (10), 4564.
(19) Neagu, A.; Neagu, M.; Dér, A. Fluctuations and the Hofmeister Effect. Biophys. J.
2001, 81 (3), 1285.
(20) Dér, A.; Ramsden, J. J. Evidence for Loosening of a Protein Mechanism.
Naturwissenschaften 1998, 85, 353.
(21) Bogár, F.; Bartha, F.; Násztor, Z.; Fábián, L.; Leitgeb, B.; Dér, A. On the Hofmeister Effect: Fluctuations at the Protein-Water Interface and the Surface Tension. J. Phys.
Chem. B 2014, 118 (29), 8496.
(22) Nelson, N.; Schwartz, D. K. Specific Ion (Hofmeister) Effects on Adsorption,
Desorption, and Diffusion at the Solid-Aqueous Interface. J. Phys. Chem. Lett. 2013, 4 (23), 4064.
(23) Salis, A.; Medda, L.; Cugia, F.; Monduzzi, M. Effect of Electrolytes on Proteins Physisorption on Ordered Mesoporous Silica Materials. Colloids Surfaces B Biointerfaces 2016, 137, 77.
(24) Orgovan, N.; Patko, D.; Hos, C.; Kurunczi, S.; Szabó, B.; Ramsden, J. J.; Horvath, R.
Sample Handling in Surface Sensitive Chemical and Biological Sensing: A Practical Review of Basic Fluidics and Analyte Transport. Adv. Colloid Interface Sci. 2014, 1.
(25) Horvath, R.; Ramsden, J. J. Quasi-Isotropic Analysis of Anisotropic Thin Films on Optical Waveguides. Langmuir 2007, 23 (18), 9330.
(26) Horvath, R.; Kobzi, B.; Keul, H.; Moeller, M.; Kiss, É. Molecular Interaction of a New Antibacterial Polymer with a Supported Lipid Bilayer Measured by an in Situ Label- Free Optical Technique. Int. J. Mol. Sci. 2013, 14 (5), 9722.
(27) Stalder, A. F.; Kulik, G.; Sage, D.; Barbieri, L.; Hoffmann, P. A Snake-Based Approach to Accurate Determination of Both Contact Points and Contact Angles.
Colloids Surfaces A Physicochem. Eng. Asp. 2006, 286 (1–3), 92.
(28) Vonderviszt, F.; Kanto, S.; Aizawa, S.; Namba, K. Terminal Regions of Flagellin Are Disordered in Solution. J. Mol. Biol. 1989, 209 (1), 127.
(29) Tiefenthaler, K.; Lukosz, W. Sensitivity of Grating Couplers as Integrated-Optical Chemical Sensors. J. Opt. Soc. Am. B 1989, 6 (2), 209.
(30) De Feijter, J.; Benjamins, J.; Veer, F. Ellipsometry as a Tool to Study the Adsorption Behavior of Syntetic and Biopolyers at the Air Water Interface. Biopolymers 1978, 17 (7), 1759.
3 4 5 6 7 8 9 10 11 12 13 14 15 16 17 18 19 20 21 22 23 24 25 26 27 28 29 30 31 32 33 34 35 36 37 38 39 40 41 42 43 44 45 46 47 48 49 50 51 52 53 54 55 56
(31) Kurrat, R.; Prenosil, J. E.; Ramsden, J. J. Kinetics of Human and Bovine Serum Albumin Adsorption at Silica-Titania Surfaces. J. Colloid Interface Sci. 1997, 185 (1), 1.
(32) Ansari, F.; Kavosh, M.; Horvath, R.; Ghalamboran, M. R.; Ramsden, J. J. Bacterial Adsorption onto Monolayer Ferromagnetic Nanofilms. J. Bionanoscience 2010, 4 (1–
2), 119.
(33) Ansari, F.; Kavosh, M.; Horvath, R.; Ramsden, J. J. Particle Speciation during PEG- Fe3O4 Hybrid Nanoparticle Self-Assembly on Si(Ti)O2. J. Nanoparticle Res. 2011, 13 (1), 193.
(34) Viot, P.; Tarjus, G.; Ricci, S. M.; Talbot, J. Random Sequential Adsorption of Anisotropic Particles. I. Jamming Limit and Asymptotic Behavior. J. Chem. Phys.
1992, 97 (7), 5212.
(35) Malmsten, M. Biopolymers at Interfaces, Second Edition; 2003.
(36) Vonderviszt, F.; Uedaira, H.; Kidokoro, S. I.; Namba, K. Structural Organization of Flagellin. J. Mol. Biol. 1990, 214 (1), 97.
(37) Pelton, J. T.; McLean, L. R. Spectroscopic Methods for Analysis of Protein Secondary Structure. Anal. Biochem. 2000, 277 (2), 167.
(38) Zhang, Y.; Cremer, P. S. The Inverse and Direct Hofmeister Series for Lysozyme.
Proc. Natl. Acad. Sci. U. S. A. 2009, 106 (36), 15249.
(39) dos Santos, A. P.; Levin, Y. Surface and Interfacial Tensions of Hofmeister Electrolytes. Faraday Discuss. 2013, 160 (June 2013), 75.
(40) Melander, W.; Horváth, C. Salt Effects on Hydrophobic Interactions in Precipitation and Chromatography of Proteins: An Interpretation of the Lyotropic Series. Arch.
Biochem. Biophys. 1977, 183 (1), 200.
3 4 5 6 7 8 9 10 11 12 13 14 15 16 17 18 19 20 21 22 23 24 25 26 27 28 29 30 31 32 33 34 35 36 37 38 39 40 41 42 43 44 45 46 47 48 49 50 51 52 53 54
TOC Graphic 3
4 5 6 7 8 9 10 11 12 13 14 15 16 17 18 19 20 21 22 23 24 25 26 27 28 29 30 31 32 33 34 35 36 37 38 39 40 41 42 43 44 45 46 47 48 49 50 51 52 53 54 55 56