Moser, Martin A.
1ABSTRACT: The globalization of the markets is not only a challenge for large companies. Small and medium-sized companies are also becoming more in- volved in new markets more than assumed and statistically recorded. They are required to position themselves more strongly on foreign markets due to in- creased competitive pressure, insufficient potential on the domestic market and narrower fields of market activity. Small and medium-sized companies are only exposed to minimal obligations under commercial law. This is due to their size, the organizational form and the lack of reference to the capital market. Since the annual balance sheet is often created with the aim of tax directives, there is only limited adequate reflection on the business profitability of the organization. A detailed internal cost accounting only exists in exceptional cases and cost moni- toring is only carried out on the basis of historical data and not on a planned cost basis. This paper deals with a concrete practical question from the topic of con- trolling and the analysis of an existin
nancial documents. On the basis of the results and statements available, the ob- jective of this paper is to develop recommendations for action for the supervisory board and then to discuss and evaluate them accordingly.
KEYWORDS: Budget planning, Controlling, Small and Medium-sized Busi- nesses (SME)
JEL CODES: F60, F63, F65
Introduction and objectives
In view of the current far-reaching changes, controlling is confronted with a multitude of challenges. These developments not only change the role of the controller significantly, but also have a major impact on small and medium-sized enterprises (SMEs) and family businesses, which are of central importance for economic development. The effects of digitization
1 Moser, Martin A. PhD student, University of Sopron, Alexandre Lamfalussy Faculty (martin.arnold.moser@phd.uni-sopron.hu)
on controlling not only change the range of tasks and the competence pro- file of the controller. The increased use of business intelligence leads to serious redesigns, for example in cost management or in the use of ERP (Enterprise Resource Planning) systems (Feldbauer-Durstmueller Mayr, 2019, p. 1).
The globalization of the markets is not only a challenge for large com- panies. Small and medium-sized companies are also becoming more in- volved in new markets more than assumed and statistically recorded. They are required to position themselves more strongly on foreign markets due to increased competitive pressure, insufficient potential on the domestic market and narrower fields of market activity (Behringer, 2018, pp. 3-5).
The professionalization of a controlling toolkit in family businesses is pri- marily opposed to the goal of maintaining long-term control of the owner family, although controlling can make a decisive contribution to the con- tinued existence of the company across generations. Controlling is an im- portant factor for a successful turnaround, especially during corporate crises as described and analyzed in this paper (Feldbauer-Durstmueller Mayr, 2019, p. 5).
Small and medium-sized companies are only exposed to minimal ob- ligations under commercial law. This is due to their size, the organizati- onal form and the lack of reference to the capital market. Since the annual balance sheet is often created with the aim of tax directives, there is only limited adequate reflection on the business profitability of the organiza- tion. A detailed internal cost accounting only exists in exceptional cases and cost monitoring is only carried out on the basis of historical data and not on a planned cost basis (Ihlau Duscha, 2019, pp. 8-10).
On the methodical basis of a case study and the elaboration of future scenarios, this paper deals with a concrete practical question and example from the topic of controlling. Based on the results and statements available , the objectives of this paper are to analyze the exemplary company and develop recommendati- ons for action for the supervisory board and then to discuss and evaluate
them accordingly This serves to show, using
the example of the respective company, how such and similar controlling challenges can be approached in order to solve them accordingly.
Practical background
This paper deals with a concrete practical question from the topic of cont- rolling. Small, autonomous snow clearing vehicles and mowing tractors in modular design are manufactured by a family company in the legal form of a Ltd. (GmbH). The products are available in a total of five diffe- rent versions. The sales for 2016, as well as the list price and the number of units sold for the individual products in this year can be seen in table 1.
Table 1: Turnover 2016
List price Number of items sold 2016
Of which for winter opera-
tion
Surcharge for winter opera-
tion
Turnover 2016
Trac SW01 115 105
Trac SW02 95 95
Trac SW03 150 115
Trac SW04 160 45
Trac SW05 210 0
Source: table
The management recognizes the falling profits of the company and looks for an appropriate solution. The management thinks that it can find the solution in foreign business in Scandinavian countries (Norway, Sweden and Denmark), where the need for smaller vehicles for snow re- moval is very high. For this reason, marketing began on a trial basis in 2017. However, in order to be able to guarantee the readiness for delivery, a storage room had to be leased. Furthermore, separate commissions had to be paid for agents based in Scandinavia. Due to the need for pre-pro- duction, the use of materials was also higher.
Careful sales planning was carried out for 2018 (see table 2). As a result of the interest in buying, assuming readiness to deliver and product quality is given, an annual average growth of around 10% is expected over the next three years. To do this, however, a suitable, improved sales orga- nization must be established. No growth is expected in the domestic mar- ket, which is why it is viewed as largely saturated. Rather, it is already good if the numbers can be maintained.
Table 2: Sales planning 2018
List price
Number of items sold 2016
Of which for winter opera-
tion
Surcharge for winter opera-
tion
Turnover 2016
Trac SW01 35 35
Trac SW02 30 30
Trac SW03 38 38 197,600.00
Trac SW04 20 20
Trac SW05 0 0 -
661,500.00 Source: table
As it can be seen in table 2 for the planned sales for 2018, higher prices can be achieved in Scandinavia. In addition, the income statements for the last three years (2015 to 2017) shown in table 3, as well as the plan and the half-year results for the current financial year (2018) are available.
Table 3: Profit and loss accounts for 2015 to 2017
Account Description Var. Actual 2015 Actual 2016 Actual 2017 Budget 2018 Actual 1st half 2018
4000 Sales 100%
4100 Sales deductions (commissions) 100%
- Operating perfor-
mance -
5000 Use of materials 100%
5100 Total auxiliary and
operating materials 100% 245,671.25
- Gross profit -
6000 Wages and non-
wage costs 80%
6200 Salaries and ancil-
lary salaries 0%
- Contribution mar-
gin I - -
7010 Depreciation 0% -
7750 Legal and advisory
expenses 50%
7380 Telephone / mail 80%
7700 Insurance 0% -
7400 Rent / lease 0% -
7700 Marketing 100%
7200 Maintenance 95%
7300 Outbound freight 85%
7600 Other effort 95%
- Profit of common
business operation - - - - -
Source:
The task describes the inclusion of a new controller in the company.
This was set up as a staff unit for the management. So far, the topic of controlling has not had a high priority in the family business. Up until now, the management had hardly any documents or figures on the course of business that had to be provided by the accounting department. The decision to serve the Scandinavian market was made by the CEO before the new controller joined the company. The operating result deteriorated enormously in 2017, so that the Supervisory Board decided to examine this accordingly. The plan for 2018 has already been drawn up by the ma- nagement in cooperation with the new controller. The expected values can be endorsed by the local representatives.
Based on the results and statements available, the objective of this paper is to develop recommendations for action for the supervisory board and then to discuss and evaluate them accordingly. Furthermore it describes how this task is processed according to scientific criteria and which ways to solve the problem the controller will present to the super- visory board together with the management and which difficulties the fa- mily business will likely have to overcome.
Theoretical background
Definition of terms and company descriptionThe task describes a family company in the organizational form of a Ltd.
(GmbH), in which the controlling has not been given great importance and so far only a few figures on the course of business of the management are available. The following definitions and recommendations serve to integ- rate the company with regard to the subsequent consideration of the other relevant aspects and special features.
According to the Austrian Chamber of Commerce (WKO) and the recommendation of the EU Commission, micro-enterprises are companies with up to 9 employees or a turnover of up to 2 million euros per year.
Small companies, on the other hand, have a number of employees of up to 49 or an annual turnover of up to 10 million euros as criteria. Medium- sized companies are companies with up to 249 employees or an annual turnover of up to 50 million euros. From 250 employees or an annual tur-
nover in excess of 50 million euros, one speaks of so-called large compa- nies (Source: https://www.wko.at/service/zahlen-daten-fotos/KMU-defi- nition.html/ [retrieved on: 05/08/2020]).
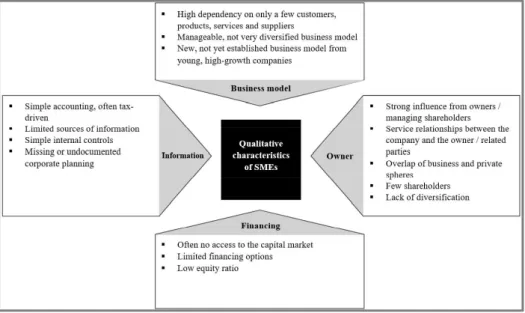
In the following, the qualitative aspects of SMEs (small and medium- sized enterprises) are described, which reflect the deviations from large companies. A differentiation through the organizational form or the ownership structure is not suitable. However, the qualitative charac- teristics shown in figure 1 influence the value and are relevant to the as- sessment. There is a relationship of dependency between buyers and suppliers, and changes in buying interests and competitors have a major impact on the development of the organization. SMEs are exposed to a large operational business risk (Ihlau Barth, 2016, pp. 1068-1069).
Figure 1: Qualitative characteristics of SMEs
Source: Ihlau-Duscha, 2019, p. 5
Small and medium-sized companies are only exposed to minimal ob- ligations under commercial law. This is due to their size, the organizati- onal form and the lack of reference to the capital market. Since the annual balance sheet is often created with the aim of tax directives, there is only limited adequate reflection on the business profitability of the organiza-
Weber, 2015, p. 226). A detailed internal cost accounting
only exists in exceptional cases and cost monitoring is only carried out on the basis of historical data and not on a planned cost basis. Furthermore, there is no planning system as well as partial and overall plans or they are implemented and documented with gaps (Zieger -Biastoch, 2008, p. 592). Data on the intended development of the company is only avai- lable to a limited extent (Ihlau Duscha, 2019, p. 7).
Tractor Mower Ltd. (fictitious name) is an independent family com- pany founded in 1926 and is one of the most renowned commercial en- terprises in Austria. As a quality company, it is a leading manufacturer of self-propelled snow clearing vehicles and mowing tractors. It stands for pronounced customer orientation, versatility and high quality require- ments. As a reliable partner, it convinces its customers with experience, in-depth specialist knowledge, high quality in all areas and the ability to react quickly to individual requirements. Based on the existing sales figu- res, the company is assigned to the small business category. It was as- sumed that the number of employees is less than 50.
Importance of controlling in SMEs
The globalization of the markets is not only a challenge for large compa- nies. Small and medium-sized companies are also becoming more invol- ved in new markets, as in the present case in the Scandinavian region, more than assumed and statistically recorded. They are required to po- sition themselves more strongly on foreign markets due to increased com- petitive pressure, insufficient potential on the domestic market (as the stagnating or deteriorating earnings from the business figures for 2015 and 2016 show) and narrower fields of market activity (Feldmeier et al., 2015, p. 5). Small industrial companies, like Tractor Mower Ltd., are forced to constantly adapt to new requirements due to global production chains, short delivery times and growing market dynamics. The measurability of production and logistics is confronted with new challenges through a pro- cess-oriented alignment of the supply chain (Gottmann, 2019, p. V).
Controlling describes a concept of control that includes various func- tions, with the main task of success-oriented coordination of preparation and review as well as the supply of information (Horsch, 2015, p. 20).
Controlling must be a fixed element of any management, regardless of the industry and size of the company (Erk, 2018, p. VIII). The study of infor- mation for planning organizational decisions is insufficiently carried out in small businesses. This is also the case with Tractor Mower Ltd.. As mentioned in the previous chapter on the definition of terms and company
description, the focus is on the quality of the service provision. 20 to 30 years ago this was not a problem, because the company was located in a sellers' market in which there was a significantly higher demand compared to the existing offers. The increasing market saturation led to a change from sellers' markets to buyers' markets and was a driver of modern glo- balization (Zirkler et al., 2019, p. V).
Nowadays, controlling is absolutely necessary in a buyer's market, as customers can choose between different producers and profit margins fall as a result (Schmid-Gundram, 2020, pp. 1-2). From an economic point of view, Tractor Mower Ltd. can only be profitable, if the figures are known, the costs are under control and business plans are based on economic facts (Reichmann et al., 2017, p. 19). Until recently, this was only partially the case, as a controller was only accepted as a staff position for the manage- ment in 2017 and the management was only given very little information about the course of business. In small companies, the controller function is often performed by the management itself. In the case of medium-sized organizations and large companies, on the other hand, controlling is car- ried out by their own offices or departments (Horsch, 2015, p. 21). SMEs often completely avoid conventional controlling due to the sometimes complex data basis from bookkeeping, accounting and time records (Erk, 2018, p. VII).
Controlling at Tractor Mower Ltd. must provide facts and predictions that enable the managing director or supervisory board to react to com- pany-specific developments and requirements, such as expansion into Scandinavian countries or stagnating or increasingly poor results and as a result to be able to ensure an effective and sustained development of the organization. The controller must focus on the day-to-day operations on the one hand and the strategic management of the company on the other hand and know the validity for internal decision-makers and external in- terest gr
to ensuring the rationality of the management task by providing quantita- tive and management-relevant information (Taschner, 2013, p. 30).
Tractor Mower Ltd. can only be managed successfully again in the long term through secure and justified and not through indiscriminate de- cisions by the management. The management must ensure a meaningful and informative controlling system in the company, develop appropriate studies from it and use it as a basis for strategic decisions (Reichmann, 1997, p. 13). The decision to include a controller in the company was al- ready the first step in this direction. A comprehensive, system-supported
management information system is not (yet) required in this specific example.
The managing director and the newly hired controller have to look through the current company situation and the falling results of normal business activities from 2015 to 2017 in order to be able to initiate essen- tial strategic steps, which are described in the practical second part of this scientific work. A forecast or a plan for the next 12 months, i.e. the year 2018, has already been submitted. The 2018 plan is used to be able to make short- and medium-term choices (e.g. investment or personnel de- cisions). Another task is the expectation for the next three financial years (multi-year planning), which was also worked out in the practical part and controls the long-term strategic direction of Tractor Mower Ltd. Controll- ing is therefore a prerequisite for the strategic management of the com- pany, which, on the other hand, is the basis for the efficient and effective development of the company (Preissler, 2014, p. 2).
In addition to the general need for strategic management of Tractor Mower Ltd., an exclusive focus on the direct provision of services by the organization is not sufficient. Increased competition in the manufacture and sale of self-propelled snow clearing vehicles and mowing tractors, as well as high personnel and material costs, especially in the domestic mar- ket compared to the Scandinavian market, lead to reduced income and require a comprehensive economic focus in all areas. Operational cont- rolling must enable the management to understand the structure of the costs in their area of responsibility, to determine the respective cost dri- vers and to identify increases in costs as early as possible. This is used to initiate essential cost saving measures (Zirkler et al., 2019, p. 24). Furt- hermore, the effectiveness of the service provision must be continuously assessed in order to be able to manage employees and organize the com- pany's resources. In addition, the operational success of the organization (e.g. customer satisfaction, adherence to deadlines, etc.) must be assessed in order to be able to predict the subsequent success of the company ca- used by its own performance and to be able to define and introduce appropriate alternatives early enough. The management of Tractor Mower Ltd. must be familiar with the sizes required by the business through a suitable reporting system and disseminate and communicate them accor- dingly as operational goals. In this way, the economic impact can be as- sessed and active participation in the success of the company can be ensu- red (Schmid-Gundram, 2020, pp. 4-5).
Requirements for controlling in SMEs
The controller of Tractor Mower Ltd. has the task of providing informa- tion that enables the managing director and the supervisory board to make sensible decisions for a productive and effective development of the orga- nization. It is therefore an essential goal of controlling to pass on knowledge about the organization and thereby provide a corresponding basis for strategic decisions.
The main tasks of controlling in the present case are therefore the processing of current data and documents from the accounting department so that they can be recorded quickly and easily, as well as a comparison, in particular with regard to the previous years (2015 to 2017) and the plan- ning for 2018 so that development processes and trends can be identified (Goodman, 1975, pp. 17-20). Another task is the assessment of the future development of the company by means of a corresponding forecast, as well as the planning for the coming financial years, so that probable pos- sibilities and dangers in strategic decisions can be considered and eva- luated. This results in different requirements, such as transparency, detailing, availability, visualization, accuracy and a corresponding future orientation of the data (Fiedler, 2016, pp. 8-12).
The resource information is not required in a homogeneous form, but has to be adapted to each user and his or her individual information needs (Taschner, 2013, p. 29). An essential prerequisite is the regular revision of all data with the least possible time delay between their occurrence and the subsequent mapping by the controller. In principle, for small busines- ses such as Tractor Mower Ltd., a monthly revision as part of the prepa- ration of the monthly financial statements is appropriate. In this specific example, however, the requirement must also apply to have the controll- ing evaluations as quickly as possible after the end of the month in order to receive at least a partial update during the month if necessary (Schmid- Gundram, 2020, p. 8).
Apart from the continuous, fast and, at best, daily provision of the controlling system, transparency and accuracy of the same also play an information must be understandable at all times and the extent of the key figures must be clearly identifiable (Nahrstedt, 2019, pp. 73-74).
The future-oriented orientation is another essential requirement of the controller. The focus must be on further business development. This is done by means of a planning calculation, which is indispensable for every
controlling, which is done by extrapolation and the constant forecast, i.e.
a review of the planning calculation on the basis of the specific company development during the given planning period (Langmann, 2019, pp. 20- 21).
The option of detailing certain data from the controlling system is another requirement of the controller, because understanding and analy- zing figures and business developments are central tasks of controlling.
However, this can only be achieved if the relevant details are assessed and, consequently, the triggers and conditions for the emergence of diffe- rent values can be examined (Schmid-Gundram, 2020, p. 11).
Controlling systems in SMEs
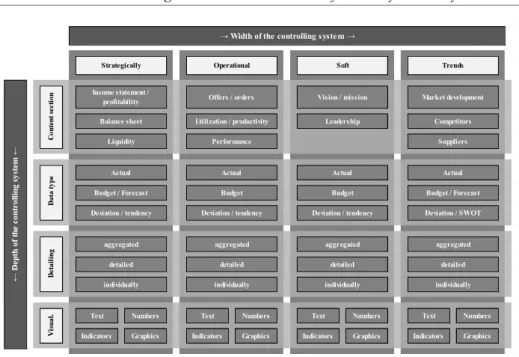
A controlling system based on Microsoft Excel is sufficient for Tractor Mower Ltd. The scope of the controlling system is determined by the cont- roller in relation to the size of the organization (< 50 employees), the in- dustry (production and sale of small self-propelled snow clearing vehicles and modular mower tractors in five different variants) and the current company situation (expansion into Scandinavian countries). The dimen- sion of the controlling system is selected in terms of depth or breadth of the information.
Figure 2 makes it clear that the depth of information determines the extent to which the requirements for the controller can be met. The breadth of the information, on the other hand, determines how coordinated the system is and consequently does justice to its forward-looking and opera- tional character (Schmid-Gundram, 2020, p. 13).
Figure 2: Scope of controlling systems
Source: Schmid-Gundram, 2020, p. 14
The representation of pure business figures as the scope of the cont- rolling system is not sufficient regardless of the size of the company.
Every company must at least implement a simplified controlling system with planning calculations and deviation analysis. For small businesses, a minimum amount of information is sufficient (selected base values and key figures including budget figures and monthly variance analysis) and information breadth (income statement, balance sheet, liquidity, data on offers or orders, information on productivity and capacity utilization, mar- ket development, etc.). The reporting system must be kept brief and clear (Schmid-Gundram, 2020, pp. 14-15).
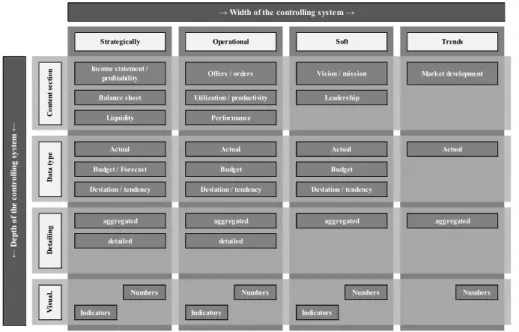
For small companies like Tractor Mower Ltd., the usually necessary dimension of a controlling system increases. This is visualized in figure 3.
Text Numbers Text Numbers Text Numbers Text Numbers
Indicators Graphics Indicators Graphics Indicators Graphics Indicators Graphics
Budget / Forecast Deviation / SWOT
aggregated detailed individually
Soft Trends
Market development
Competitors Suppliers
Actual
detailed individually
Vision / mission Leadership
Actual Budget Deviation / tendency
aggregated detailed individually Width of the controlling system Operational
Offers / orders
Utilization / productivity Performance
Actual Budget Deviation / tendency
aggregated Deviation / tendency
aggregated detailed individually Income statement /
profitability Balance sheet
Liquidity Strategically
Actual Budget / Forecast
Figure 3: Scope of a controlling system for small businesses
Source: Schmid-Gundram, 2020, p. 16
The reporting system contains an overview of the most relevant data, trends and further developments with different types of presentation and is expanded accordingly by means of detailed studies in terms of producti- vity, results and solvency (Nagl, 2018, p. 122). In addition to what is al- ready necessary for small organizations, medium-sized companies must also observe the requirements for accuracy, presentation and orientation towards the future (Schmid-Gundram, 2020, p. 16).
The main task of reporting is to depict the available data clearly and in different variants and to offer refinements, such as a concentrated il- lustration as a balanced scorecard (BSC) as well as detailed reports on differences and trends (Nagl, 2018, p. 48).
In the manufacturing industry in which Tractor Mower Ltd. is lo- cated, key figures for production and organizational processes must be given exceptional attention in the controlling system. This includes, for example, the acquisition and evaluation of machine data. In a manufactu- ring organization, certain tactical values and key figures, operational data with a focus on sales and production, soft influences (e.g. fluctuation, ma- nagement of employees) and tendencies are equally relevant and must
Numbers Numbers Numbers Numbers
Indicators Indicators Indicators
Strategically
Actual Budget / Forecast Income statement /
profitability Balance sheet
Liquidity
Width of the controlling system Operational
Offers / orders
Utilization / productivity Performance
Actual Budget Deviation / tendency
aggregated Deviation / tendency
aggregated detailed
Soft Trends
Market development
Actual
detailed
Vision / mission
Leadership
Actual Budget Deviation / tendency
aggregated aggregated
therefore also be mapped with the same contributions in reporting (Schmid-Gundram, 2020, p. 19).
The prevailing organizational situation also sets standards for the ex- tent and focus of the controlling system. In this specific case, the company is expanding into Scandinavia. The focus of growth is, for example, on investments, on the one hand in additional employees and on the other hand in machines. Therefore, in this case, exact control of costs and detai- led planning are equally relevant. In addition, the focus must also be on a targeted view of the operational data and parameters, so that the availabi- lity of resources and consequently the ability to deliver as well as custo- mer satisfaction can be ensured. If the result is temporarily insufficient and acceptable or if there is no increase, as was largely the case at Tractor Mower Ltd. in the years 2015 to 2017, additional focal points can be de- fined in the reporting at any time. In any case, the controlling system has to be adapted in a crisis, which in the present case was done by adding a controller to the company, since there was no controlling system before.
The focus must be on the tactical and operational reasons for the crisis situation (Behringer, 2018, pp. 14-15).
In contrast to the size of the organization, the economic sector and the situation, the users are not assigned any significant importance with regard to the extent and orientation of the controlling system. This is only rele- vant with regard to the adjustment or the focus of the reporting. A user- specific adaptation of the reporting system is, however, absolutely ne- cessary in order to take into account and cover the various statements for the respective users or their requirements. For executives and the mana- gement, the essence of the reporting system must be an overview of aro- und one sheet, which combines various forms of presentation and visually does justice to the balance of the controlling system and its information features. In addition to a general overview, the reporting system must con- tain detailed reports based on the respective focus. The report for the ad- visory board or the shareholders must be created as running text with the inclusion of certain selected key figures and images. This enables expla- nations and interpretations regarding the focus of the report (Funk Ross- manith, 2017, pp. 282-283).
Controlling instruments in SMEs
The use of the instruments and tools of controlling is interrelated to the extent of the controlling system. Direct figures from the organization as well as key figures derived therefrom serve exclusively as a basis for the
controlling system. A minimum of depth of information is only generated using plan values or a corresponding planning calculation and deviation analysis. If this is missing, current data and indicators are not suitable for strategic and operational management of the organization (Schmid- Gundram, 2020, p. 25).
A large number of small and medium-sized companies believe that it is sufficient to check the company figures once a month. Often the data has been generated by tax consultants and primarily contains information on the productivity of the company. In the ideal case, however, this means that only information can be given on whether the company has made pro- fits or losses in the current financial year. However, this is not enough for a very small company either. Often only data from accounting or bookke- eping are available as current key figures for the organization. It must be ensured that in addition to a monthly profit and loss account, a balance sheet is also available. The data from inventory and success accounts alone are not sufficient information for the controlling system. They must be expanded or supplemented by means of current liquidity figures, ope- rational figures, information on soft aspects and external figures and forecasts (Funk Rossmanith, 2017, pp. 285-293).
The most important tool of the controller and the basis of the cont- rolling system, in addition to the availability of current business data as an information basis, is the definition of so-called target values. Without this as a comparative value, no analysis of the deviations with regard to the expected development of the business and consequently no evaluation of the success can be carried out (Schmidt, 2016, pp. 27-28).
The planning calculation is an annual survey of the planned figures for the coming financial year as well as in the course of the so-called multi-year plan for another three years. The figures for the past financial year, which are adapted on the basis of operational expectations and the strategic target, serve as the basis for planning (Becker Ulrich, 2016, p.
542).
The forecast is a planning update during the year based on the use of current company figures for the planning year and a corresponding update of the planning figures. The initial plan is adapted to the knowledge about the expectation of the business and the tactical objectives in the current financial year that has been added since the creation of this plan (Arnold et al., 2020, p. 31).
A deviation analysis enables essential insights for strategic and ope- rational decisions for the effective and sustainable development of the or- ganization. For this reason, it is an essential tool of the controller and has the task of checking and assessing the effect of current company figures, determining the causes of differences, developing suitable contrast prog- rams and consequently providing a basis for company decisions (Nyhuis Wiendahl, 2003, p. 180).
Practical implementation
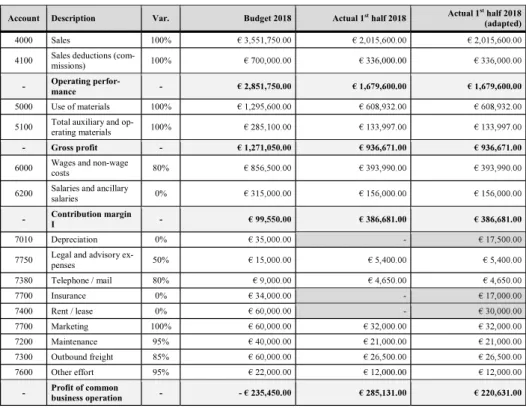
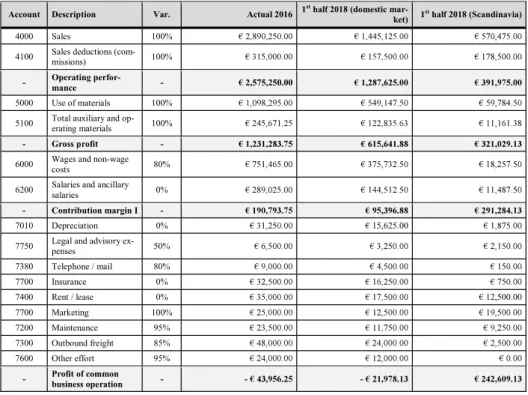
Adapted income statement for 2018As a first step in working through the practical example explained in the introductory chapter, the existing income statement for the first half of 2018 was adapted accordingly in table 4 and supplemented with the mis- sing items for which corresponding assumptions have been made.
For the position of depreciation (account 7010), insurance (account 7700) and rent / lease (account 7400), half of the budgeted value for 2018 was assumed for the 1st half of 2018.
Table 4: Adapted income statement 2018
Account Description Var. Budget 2018 Actual 1st half 2018 Actual 1st half 2018
(adapted)
4000 Sales 100%
4100 Sales deductions (com-
missions) 100% 336,000.00
- Operating perfor-
mance -
5000 Use of materials 100%
5100 Total auxiliary and op- erating materials 100%
- Gross profit -
6000 Wages and non-wage
costs 80%
6200 Salaries and ancillary
salaries 0%
- Contribution margin
I - 386,681.00
7010 Depreciation 0% -
7750 Legal and advisory ex-
penses 50%
7380 Telephone / mail 80%
7700 Insurance 0% -
7400 Rent / lease 0% -
7700 Marketing 100%
7200 Maintenance 95%
7300 Outbound freight 85%
7600 Other effort 95% 12,000.00
- Profit of common
business operation - -
Source:
business model (domestic market) on the basis of the 2016 profit and loss account, which represents the last year before the start of exports to Scandinavian countries. As a result, the first half of 2018 was divided into the original business in the domestic market and the export business in Scandinavian countries. This division can be seen in table 5.
Table 5: Separation between domestic market and Scandinavia
Account Description Var. Actual 2016 1st half 2018 (domestic mar-
ket) 1st half 2018 (Scandinavia)
4000 Sales 100%
4100 Sales deductions (com-
missions) 100%
- Operating perfor-
mance - 2,575,250.00
5000 Use of materials 100%
5100 Total auxiliary and op- erating materials 100%
- Gross profit -
6000 Wages and non-wage
costs 80%
6200 Salaries and ancillary
salaries 0%
- Contribution margin I -
7010 Depreciation 0% 15,625.00
7750 Legal and advisory ex-
penses 50%
7380 Telephone / mail 80%
7700 Insurance 0%
7400 Rent / lease 0% 12,500.00
7700 Marketing 100%
7200 Maintenance 95%
7300 Outbound freight 85%
7600 Other effort 95%
- Profit of common
business operation - - -
Source:
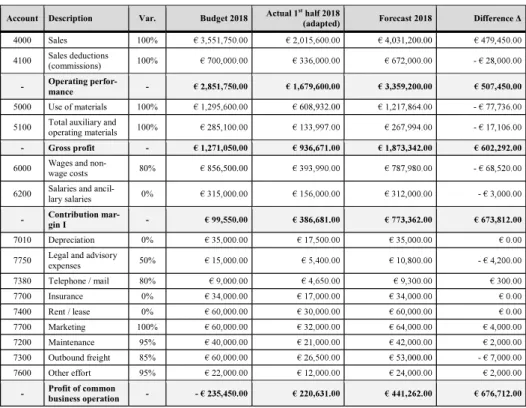
Assessment of the 2018 budget
To assess the budget, the deviation for further assessment was calculated from the plan for 2018 and the adapted first half of 2018 (or the forecast for the whole year 2018) and visualized in table 6.
Table 6: Assessment of the budget 2018
Account Description Var. Budget 2018 Actual 1st half 2018
(adapted) Forecast 2018
4000 Sales 100% 4,031,200.00
4100 Sales deductions
(commissions) 100% -
- Operating perfor-
mance -
5000 Use of materials 100% 608,932.00 -
5100 Total auxiliary and
operating materials 100% -
- Gross profit -
6000 Wages and non-
wage costs 80% 856,500.00 -
6200 Salaries and ancil-
lary salaries 0% -
- Contribution mar-
gin I -
7010 Depreciation 0%
7750 Legal and advisory
expenses 50% -
7380 Telephone / mail 80%
7700 Insurance 0%
7400 Rent / lease 0%
7700 Marketing 100%
7200 Maintenance 95%
7300 Outbound freight 85% 53,000.00 -
7600 Other effort 95%
- Profit of common
business operation - -
Source:
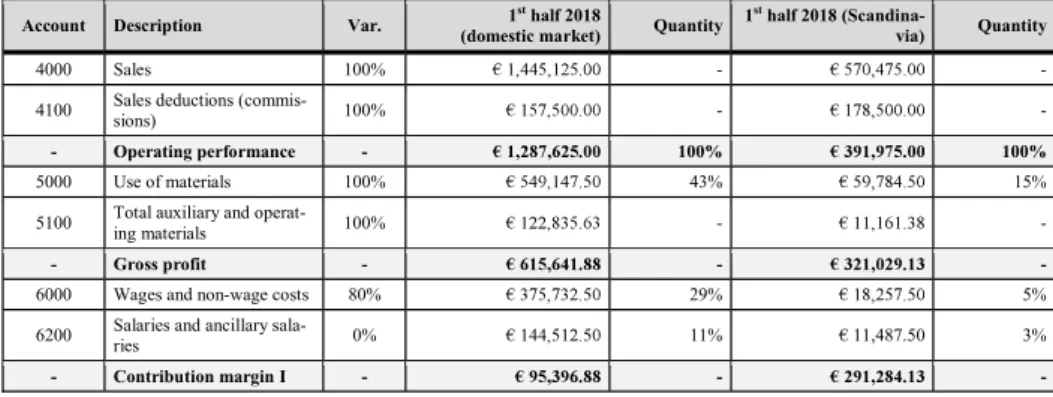
The deviation analysis shows that the market growth in the Scandina- vian region is greater than originally assumed. Due to the strong growth in Scandinavia, there is a positive deviation in the use of materials and the share of wages and salaries, which is shown in table 7. The promising tendency announced by the management is thus endorsed.
Table 7: Comparative analysis of material input, wages and salaries
Account Description Var. 1st half 2018
(domestic market) Quantity 1st half 2018 (Scandina-
via) Quantity
4000 Sales 100% - -
4100 Sales deductions (commis-
sions) 100% - -
- Operating performance - 100% 100%
5000 Use of materials 100% 43% 15%
5100 Total auxiliary and operat-
ing materials 100% - -
- Gross profit - - -
6000 Wages and non-wage costs 80% 29% 5%
6200 Salaries and ancillary sala-
ries 0% 11% 11,487.50 3%
- Contribution margin I - - -
Source:
The use of materials in relation to the operating performance in the first half of 2018 in the domestic market (based on the 2016 financial year) is 43%. In comparison, the use of materials in the Scandinavian market is only 15%. The share of wages and salaries in the Scandinavian market is also significantly lower than in the domestic market. The wage share in the domestic market is 29%, in Scandinavia only 5%. The proportion of salaries is similar. Here, 11% in the domestic market are compared to only 3% in the Scandinavian market.
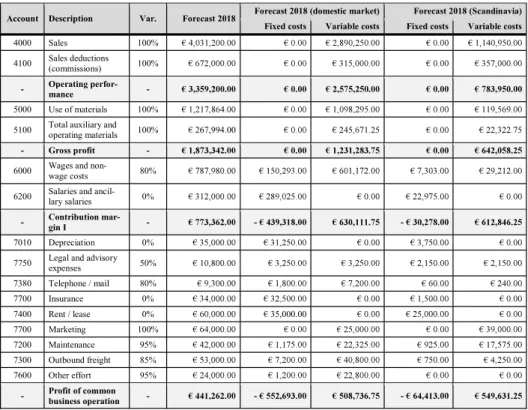
Future scenarios
This chapter presents future scenarios, which are used for solution approaches and advice for the advisory board, which form the conclusion of this paper. Initially, for the presentation and assessment of future scena- rios, there is a breakdown into fixed and variable costs for the domestic market and the Scandinavian market for 2018 (see table 8). Furthermore, it was assumed that the fixed costs on the domestic market cannot be re- duced in the short term. This is due, among other things, to the many years of existence and the family management of Tractor Mower Ltd., which does not provide for the rapid termination of employment relationships, long-term rental contracts, etc. Furthermore, fixed costs remain unchan- ged and no inflation adjustment is made.
Table 8: Breakdown into fixed costs and variable costs
Account Description Var. Forecast 2018 Forecast 2018 (domestic market) Forecast 2018 (Scandinavia) Fixed costs Variable costs Fixed costs Variable costs
4000 Sales 100%
4100 Sales deductions
(commissions) 100%
- Operating perfor-
mance -
5000 Use of materials 100%
5100 Total auxiliary and
operating materials 100% 267,994.00
- Gross profit -
6000 Wages and non-
wage costs 80%
6200 Salaries and ancil-
lary salaries 0%
- Contribution mar-
gin I - - -
7010 Depreciation 0%
7750 Legal and advisory
expenses 50%
7380 Telephone / mail 80%
7700 Insurance 0%
7400 Rent / lease 0% 35,000.00
7700 Marketing 100%
7200 Maintenance 95%
7300 Outbound freight 85%
7600 Other effort 95%
- Profit of common
business operation - - -
Source:
Scenario A (see table 9) describes a conservative approach for the budget for 2019, which continues the previous strategy as described in the introduction and assumes an average annual growth of 10% in Scandina- via. The domestic market is largely saturated and no growth is expected.
Any increases in costs, such as collective bargaining increases, were not taken into account. These would have to be included in all scenarios and would consequently have no relevance in the subsequent comparison and selection.
Table 9: Scenario A
Account Description Forecast 2019 (domestic market) Forecast 2019 (Scandinavia)
Budget 2019 Fixed costs Variable costs Fixed costs Variable costs
4000 Sales 4100 Sales deductions
(commissions) - Operating perfor-
mance 5000 Use of materials 5100 Total auxiliary and
operating materials 0.00
- Gross profit 6000 Wages and non-wage
costs
6200 Salaries and ancillary
salaries 289,025.00
- Contribution mar-
gin I - -
7010 Depreciation 7750 Legal and advisory
expenses 7380 Telephone / mail 7700 Insurance 7400 Rent / lease 7700 Marketing 7200 Maintenance 7300 Outbound freight
7600 Other effort 22,800.00
- Profit of common
business operation - -
Source:
In order to represent the profitability of this scenario with a key fi- gure, the result was calculated in relation to the operating performance, which in the present case results in a value of 14.4%. With a realistic growth of 10% in the Scandinavian market, the minus on the domestic market will be compensated.
Scenario B (see table 10) describes an optimistic approach for the budget for 2019, which continues the previous strategy, as described in the introduction, but assumes an above-average annual growth of 50% in Scandinavia. The domestic market is still largely saturated and no growth is expected. Any increases in costs, such as collective bargaining inc- reases, were not taken into account.
Table 10: Scenario B
Account Description Forecast 2019 (domestic market) Forecast 2019 (Scandinavia)
Budget 2019 Fixed costs Variable costs Fixed costs Variable costs
4000 Sales 4100 Sales deductions
(commissions) - Operating perfor-
mance 1,175,925.00
5000 Use of materials 5100 Total auxiliary and
operating materials
- Gross profit 963,057.38
6000 Wages and non-wage costs
6200 Salaries and ancillary salaries - Contribution mar-
gin I - 630,111.75 -
7010 Depreciation 7750 Legal and advisory
expenses 7380 Telephone / mail 7700 Insurance 7400 Rent / lease 7700 Marketing 7200 Maintenance 7300 Outbound freight 7600 Other effort
- Profit of common
business operation - 508,736.75 -
Source:
In order to represent the profitability of this scenario with a key fi- gure, the result was calculated in relation to the operating performance, which in this case results in a value of 19.1%.
Scenario C (see table 11) describes the closure of the domestic market and exclusive distribution in the Scandinavian countries. An average an- nual growth of 10% was assumed in Scandinavia in the next three finan- cial years. Any increases in costs, such as collective bargaining increases, were not taken into account.
Table 11: Scenario C
Account Description Forecast 2019 (domestic market) Forecast 2019 (Scandinavia)
Budget 2019 Fixed costs Variable costs Fixed costs Variable costs
4000 Sales 4100 Sales deductions
(commissions) - Operating perfor-
mance
5000 Use of materials 0.00
5100 Total auxiliary and op- erating materials - Gross profit 6000 Wages and non-wage
costs 39,436.20
6200 Salaries and ancillary salaries
- Contribution margin
I -
7010 Depreciation 7750 Legal and advisory ex-
penses 7380 Telephone / mail 7700 Insurance 7400 Rent / lease 7700 Marketing 7200 Maintenance 7300 Outbound freight 7600 Other effort
- Profit of common
business operation -
Source:
In order to show the profitability of this scenario with a key figure, the result was calculated in relation to the operating performance, which in the case of scenario C results in a value of 62.6%. Closing the domestic market completely from 2019, so that both fixed and variable costs of the domestic market are eliminated, is in reality not feasible or only feasible in the long term, as in this case the entire business activity would have to be relocated to Scandinavia. Therefore, the assumption mentioned at the beginning was made that the fixed costs on the home market cannot be reduced in the short term.
Scenario D (see table 12) describes an optimistic approach for the budget for 2019, with the closure of the domestic market, exclusive distri- bution in the Scandinavian countries and an annual above-average inc- rease of 50% in Scandinavia. Since the domestic market is largely satu- rated, no growth is expected. Any increases in costs, such as collective bargaining increases, were not taken into account.
Table 12: Scenario D
Account Description Forecast 2019 (domestic market) Forecast 2019 (Scandinavia)
Budget 2019 Fixed costs Variable costs Fixed costs Variable costs
4000 Sales 4100 Sales deductions
(commissions) - Operating perfor-
mance 5000 Use of materials 5100 Total auxiliary and op-
erating materials - Gross profit 6000 Wages and non-wage
costs
6200 Salaries and ancillary salaries
- Contribution margin
I -
7010 Depreciation 3,750.00
7750 Legal and advisory ex- penses
7380 Telephone / mail 7700 Insurance 7400 Rent / lease 7700 Marketing 7200 Maintenance 7300 Outbound freight
7600 Other effort 0.00
- Profit of common
business operation -
Source:
In order to show the profitability of this scenario with a key figure, the result in relation to the operating performance was calculated again, which in this case results in a value of 64.6%. Closing the domestic market completely from 2019, so that both fixed and variable costs of the do- mestic market are eliminated, is in reality not feasible or only feasible in the long term, as in this case the entire business activity would have to be relocated to Scandinavia. Therefore, the assumption mentioned at the be- ginning was made that the fixed costs on the domestic market cannot be reduced in the short term. Otherwise this would be the preferred scenario.
Scenario E (see table 13) describes the closure of the domestic market under the assumption that the fixed costs remain and that sales take place exclusively in the Scandinavian countries. Average annual growth of 10%
was assumed in Scandinavia for the next three financial years. Any inc- reases in costs, such as collective bargaining increases, were not taken into account.
Table 13: Scenario E
Account Description Forecast 2019 (domestic market) Forecast 2019 (Scandinavia)
Budget 2019 Fixed costs Variable costs Fixed costs Variable costs
4000 Sales 4100 Sales deductions
(commissions) - Operating perfor-
mance 862,345.00
5000 Use of materials 5100 Total auxiliary and
operating materials - Gross profit 6000 Wages and non-wage
costs
6200 Salaries and ancillary salaries
- Contribution margin
I - - 204,534.88
7010 Depreciation 7750 Legal and advisory
expenses 7380 Telephone / mail
7700 Insurance 32,500.00
7400 Rent / lease 7700 Marketing 7200 Maintenance 7300 Outbound freight 7600 Other effort
- Profit of common
business operation - - -
Source:
To represent the profitability of this scenario with a key figure, the result was calculated in relation to the operating performance, which in this case results in a value of - 1.5%.
Scenario F (see table 14) describes an optimistic approach for the budget for 2019, with the closure of the domestic market, assuming that the fixed costs will remain, an exclusive distribution in the Scandinavian countries and an annual above-average increase of 50% in Scandinavia.
Since the domestic market is largely saturated, no growth is expected. Any increases in costs, such as collective bargaining increases, were not taken into account.
Table 14: Scenario F
Account Description Forecast 2019 (domestic market) Forecast 2019 (Scandinavia)
Budget 2019 Fixed costs Variable costs Fixed costs Variable costs
4000 Sales 1,711,425.00
4100 Sales deductions (commissions) - Operating perfor-
mance 1,175,925.00
5000 Use of materials 5100 Total auxiliary and
operating materials - Gross profit 6000 Wages and non-wage
costs
6200 Salaries and ancillary salaries
- Contribution margin
I - -
7010 Depreciation 7750 Legal and advisory
expenses 7380 Telephone / mail
7700 Insurance 1,500.00
7400 Rent / lease 7700 Marketing 7200 Maintenance
7300 Outbound freight 7,200.00
7600 Other effort - Profit of common
business operation - -
Source:
In order to represent the profitability of this scenario with a key fi- gure, the result was calculated in relation to the operating performance, which in this case results in a value of 17.6%.
Table 15: Overview of scenarios
Scenario Growth Scan- dinavia
Operating performance Budget 2019
Profit of common business
operation Budget 2019 Profitability
Scenario A + 10% 14.4%
Scenario B + 50% 19.1%
Scenario C + 10% 62.6%
Scenario D + 50% 1,175,925.00 64.6%
Scenario E + 10% - - 1.5%
Scenario F + 50% 17.6%
Source:
Table 15 summarizes the scenarios described above as an overview and explanatory basis for the CEO and the advisory board. It served as the starting point for the recommendation for a scenario, on the basis of which the budget for the next three years (period 2019 to 2021) was then drawn up.
Scenario A was selected for the recommendation to the advisory board and the preparation of the budget planning for the next three years, as the fixed costs on the domestic market cannot be reduced immediately (exclusion of scenarios C and D) and the growth in the Scandinavian mar- ket with an average of 10% per year is realistic (exclusion of scenarios B and F). Scenario E is also excluded for 2019 due to the negative profita- bility.
Budget planning 2019 to 2021
Table 16: Budget planning 2019 to 2021
Account Description Budget 2019 Use of mate-
rials Budget 2020 Use of mate-
rials Budget 2021 Use of mate- rials
4000 Sales - - -
4100 Sales deductions
(commissions) - - -
- Operating perfor-
mance - - 3,594,385.00 -
5000 Use of materials 35.8% 35.3% 34.9%
5100 Total auxiliary and
operating materials - - -
- Gross profit - - -
6000 Wages and non-
wage costs - - -
6200 Salaries and ancil-
lary salaries - - -
- Contribution mar-
gin I - - -
7010 Depreciation 35,000.00 - - -
7750 Legal and advisory
expenses - - -
7380 Telephone / mail - - -
7700 Insurance - - -
7400 Rent / lease 60,000.00 - - -
7700 Marketing - - -
7200 Maintenance - - -
7300 Outbound freight - - -
7600 Other effort - - -
- Profit of common
business operation - - -
Source:
For the budget planning for 2019 to 2021 (see table 16), the variable costs of the Scandinavian business were increased by 10% per year based on the assumptions for scenario A (growth). The domestic market was viewed as saturated and no growth was taken into account. The numbers were kept. The use of materials improved only slightly in the three years under review, as the majority is determined by the high percentage of the domestic market.
Solution approaches and problem areas
The significantly poorer result in 2017 is associated with the trial marke- ting and export to Scandinavian countries, which required the rental of a warehouse, additional high sales commissions for local dealers and a high level of material input due to the need for pre-production.
The planning for 2018 was too conservative after the results for the first half of 2018 were available and analyzed. The Scandinavian market is more profitable than the domestic market due to lower wage and salary costs and lower use of materials, which is why the focus for the next few years must be on the development and expansion of this market as well as an optimized and efficient sales organization. At the same time, the fixed costs on the domestic market must be reduced so that it is no longer in deficit.
A long-term strategy consists in closing the domestic market and re- locating the business to Scandinavia, whereby an identified problem area in this case would be any remaining fixed costs in the home market (e.g.
overheads).
Conclusions
The analysis of the exemplary organization Tractor Mower Ltd. has been on was gures. It was and is required to position itself more strongly on foreign markets due to insufficient potential on the domestic market.
Several controlling challenges, like i.e. the investigation of informa- tion for planning organizational decisions, were neglected at Tractor Mo- wer Ltd. Controlling had to provide data and forecasts that enable the ma- naging director or supervisory board to react to the expansion into Scandi- navian countries and stagnating or increasingly poor results and, as a