Individual slow-wave morphology is a marker of aging
Péter P. Ujma
a,b,*, Péter Simor
a,c, Axel Steiger
d, Martin Dresler
e,**,1, Róbert Bódizs
a,b,1aSemmelweis University, Institute of Behavioural Science, Budapest, Hungary
bNational Institute of Clinical Neuroscience, Budapest, Hungary
cInstitute of Psychology, ELTE, Eötvos Loránd University, Budapest, Hungary
dMax Planck Institute of Psychiatry, Munich, Germany
eDonders Institute for Brain, Cognition and Behaviour, Radboud University Medical Centre, Nijmegen, the Netherlands
a r t i c l e i n f o
Article history:
Received 13 September 2018
Received in revised form 29 March 2019 Accepted 3 April 2019
Available online 16 April 2019
Keywords:
Slow wave Sleep NREM Aging
LASSO regression
a b s t r a c t
Slow-wave activity is a hallmark of deep non-rapid eye movement sleep. Scalp slow wave morphology is stereotypical and it is highly correlated with the synchronized onset and cessation of cortical neuronal firing measured from the surface or depth of the cortex. It is also strongly affected by aging, and these changes are causally associated with age-related cognitive decline. We investigated how normal aging affects the individual morphology of the slow wave and whether these changes are captured by the summary slow wave parameters generally used in the literature. We recorded full-night poly- somnography in 176 participants (age 17e69 years) and automatically detected slow waves. We estab- lished individual slow morphologies using average amplitude at 501 data points for each participant and also calculated the individual average slow-wave amplitude, average ascending and descending slope steepness, halfwave duration, and the total number of slow waves (gross parameters). Using least ab- solute shrinkage and selection operator penalized regression, we found that SW gross parameters explain up to 60% of age variance but usingfine morphology up to 80% of age variance can be accounted for. This predictive power was greatest when data from multiple channels were averaged, in midline derivations and in thefirst quarter of the night. Young participants had faster slow-wave polarity re- versals, suggesting a more efficient initiation and termination of slow-wave downstate and upstate. Our results demonstrate the superiority of the high-resolution slow wave morphology as a biomarker of aging and highlight downstate-upstate transitions as promising targets of restorative stimulation-based interventions.
Ó2019 The Author(s). Published by Elsevier Inc. This is an open access article under the CC BY license (http://creativecommons.org/licenses/by/4.0/).
1. Introduction
Electroencephalographic recordings in non-rapid eye move- ment (NREM) sleep are characterized by slow, large amplitude waves (“slow waves” [SWs]). These SWs are cortical in origin (Amzica and Steriade, 1995; Csercsa et al., 2010; Steriade et al., 1993), with thalamic regulation (Crunelli and Hughes, 2010;
David et al., 2013), and they reflect the rhythmic, highly synchro- nized onset and cessation of cortical neuronfiring (Nir et al., 2011;
Steriade et al., 1993). This particular pattern of neuralfiring has an
important role in what is perhaps the most important function of NREM sleep: the normalization of synaptic connections formed during previous wakefulness (Tononi and Cirelli, 2014). In line with this observation, SWs are more frequent and have greater amplitude in participants and experimental conditions where stronger syn- aptic connections are expected to form before sleep: in younger participants, whose synaptic plasticity is greater in general (Carrier et al., 2001, 2011; Feinberg and Campbell, 2013; Kurth et al., 2012;
Pótári et al., 2017) or in case of sleep deprivation (Borbely et al., 1981) or intensive, experience-rich wakefulness (Huber et al., 2004).
SWsdeven when recorded from the scalpdaccurately reflect the temporal dynamics of the synchronized onset and cessation of neuralfiring, as well as its spatial extent over the cortical mantle below the scalp electrodes (Nir et al., 2011). The detailed morphology of SWs (slope steepness, minor structural differences, frequency) reflects the characteristics of neural firing, and it changes as a function of age and previous wakefulness: steeper,
*Corresponding author at: Institute of Behavioural Sciences, Semmelweis Uni- versity, Nagyvárad tér 4, Budapest 1089, Hungary. Tel.:þ36 1 459-1500 x56454.
**Corresponding author at: Martin Dresler Donders Institute, Kapittelweg 29, 6525 EN Nijmegen, the Netherlands. Tel.: 024-3610984.
E-mail addresses: ujma.peter@med.semmelweis-univ.hu (P.P. Ujma), martin.
dresler@donders.ru.nl(M. Dresler).
1 These authors made equal contribution.
Contents lists available atScienceDirect
Neurobiology of Aging
j o u r n a l h o me p a g e : w w w . e l s e v i e r . c o m / l o ca t e / n e u a g i n g
0197-4580/Ó2019 The Author(s). Published by Elsevier Inc. This is an open access article under the CC BY license (http://creativecommons.org/licenses/by/4.0/).
https://doi.org/10.1016/j.neurobiolaging.2019.04.002
larger, smoother SWs indicate stronger synchronized firing and therefore stronger synaptic connections (Huber et al., 2007;
Riedner et al., 2007). As it is expected, this pattern is more com- mon in young participants, early in the night and after extended, or more active wakefulness (Bersagliere and Achermann, 2010;
Colrain et al., 2010; Huber et al., 2013; Vyazovskiy et al., 2008).
The age-related reduction of SW activity is well known (Carrier et al., 2001, 2011). SW density and amplitude is lower in older in- dividuals, and it is especially associated with cognitive decline (Dresler et al., 2014; Yaffe et al., 2014), whereas retained SW activity at a higher age is associated with better cognitive and physical health (Anderson and Horne, 2003; Mazzotti et al., 2014). Our recent study (Pótári et al., 2017) has shown that high IQ is associ- ated with a significantly attenuated age-related reduction in SW spectral power, indicating that retained cortical plasticity may be an important mechanism behind the better cognitive and perhaps somatic health of participants with high general cognitive ability.
In sum, SWs reflect the ability of cortical neuron populations to engage in synchronized activity through synaptic connections, and they are affected by aging, resulting in worse cognitive functioning.
This renders SW activity a promising marker of age-related cogni- tive problems.
SWs have multiple characteristics which reflect different prop- erties of the underlying synchronized neuronalfiring. The ampli- tude of waves reflects the maximum extent offiring synchrony (Nir et al., 2011; Vyazovskiy et al., 2008), the steepness of slopes reflects the rapidness of the buildup and cessation of neuronalfiring (Esser et al., 2007; Riedner et al., 2007) and frequencydnot independently from the formerdreflects the overall synaptic load (Carrier et al., 2011). It has been demonstrated that different SW parameters are differently affected by aging (Carrier et al., 2011), and age-related structural changes in the brain have different effects on density and amplitude (Dube et al., 2015; Latreille et al., 2019).
Although they provide more temporal resolution than power spectral density or the total number of SWs, SW slope and ampli- tude are crude approximations of the true morphology of SWs and therefore can only approximately track the age-related changes of it. Owing to their highly stereotypical morphology, it is possible to investigate SWs with a methodology similar to what is used in case of event-related potentials (ERPs) (Key et al., 2005). ERP analysis focuses on the average of EEG signals following several functionally identical events (usually the repeated presentation of a stimulus) and it identifies stereotypical patterns in EEG activity which may be obscured in individual cases but appear in the averaged recording.
In the sleep EEG, such analyses were previously performed on a specific type of SW, the evoked K-complex (Crowley et al., 2002). K- complexes are morphologically similar to ordinary SWs, which can also appear spontaneously but can also be elicited by stimulation (Halász, 2005). Evoked K-complex components, computed in an identical manner to ERPs in wakefulness, are not only sensitive to the modality of the stimulus with which they were elicited but also to sex, age, and disease (Colrain and Baker, 2011; Colrain et al., 2010, 2011; Crowley et al., 2002). It is reasonable to assume that the shape of spontaneously occurring NREM SWs is also subject to such age- related variation, but this has never been empirically investigated.
An ERP-like analysis on spontaneous SWs is possible even in the absence of a trigger stimulus by aligning the EEG signal to a ste- reotypical morphological element of SWs (such as the negative peak) and averaging accordingly. This analysis reveals not only the major microstructural parameters of SWs (such as halfwave fre- quency or ascending/descending slope steepness) but also iden- tifies specific wave components and their precise dynamics at a temporal resolution equal to the sampling frequency of the recording, resulting in substantial additional information about SW dynamics.
The goal of this study was to investigate the age-related changes in the high-resolution temporal morphology of spontaneously occurring NREM SWs using a large existing sleep EEG database of healthy participants of various ages. We hypothesized that the as- sociation between age and SW characteristics is stronger if the detailed SW morphology is also considered in multivariate models.
As a result of this study, we were able to pinpoint candidate elec- trophysiological markers of healthy aging beyond the change of major SW elements such as amplitude or density. We found that younger participants are characterized by faster SW phase transi- tions both preceding and following negative peaks, suggesting a more rapid buildup and cessation of SW downstates.
2. Materials and methods 2.1. Participants
Pre-existing data from 176 healthy participants (mean age 29.9 years, SD 10.62 years, range 17e69 years; 95 males with mean age¼30.35 years, SD¼10.51 years, range 17e69 years; 81 females with mean age¼29.25 years, SD¼10.68 years, range 18e60 years;
tage by sex¼0.68,p¼0.49) from a multicenter database of the Max Planck Institute of Psychiatry (Munich, Germany), the Psycho- physiology and Chronobiology Research Group of Semmelweis University (Budapest, Hungary), and the Budapest University of Technology and Economics (Pótári et al., 2017; Ujma et al., 2014) was used in this retrospective study. The exact breakdown of participant ages by sex is provided inSupplementary table S1. Data from one 19-year-old male participant was excluded because of abnormal average SW morphology. Study procedures were approved by the ethical boards of Semmelweis University, the Medical Faculty of the Ludwig Maximilian University, or the Budapest University of Technology and Economics. All participants were volunteers who gave informed consent in line with the Declaration of Helsinki. According to semistructured interviews with experienced psychiatrists or psychologists, all participants were healthy, had no history of neurologic or psychiatric disease, and were free of any current drug effects, excluding contraceptives in females. Consumption of small habitual doses of caffeine (maximum 2 cups of coffee until noon), but no alcohol, was allowed. Six male and 2 female participants were light-to-moderate smokers (self-reported), and the rest of the participants were nonsmokers. Further details about participant selection criteria and study protocols can be found in the studies referenced previously.
2.2. Electroencephalography
All participants underwent all-night polysomnography re- cordings for 2 nights, and data from the second night were used for all analyses. Scalp EEG electrodes were applied according to the 10e20 system (Jasper, 1958) and referenced to the mathematically linked earlobes. Impedances were kept at<8 kU. EEG was sampled at 250 Hz for 115 participants, 249 Hz for 29 participants, and 1024 Hz for 15 participants, always resampled at 250 Hz (see Sec- tion2.3). Sleep EEG was visually scored on a 20-second basis ac- cording to standard criteria (Iber et al., 2007). A visual scoring of artifacts was also performed on a 4-second basis. EEG preprocess- ing was implemented in Fercio’s EEG (ÓFerenc Gombos, Budapest, Hungary). Further details about the technical details of the sample can be found in Table 1 in the study byUjma et al. (2014).
2.3. Slow-wave detection
We used multiple methods of SW detection to test the robust- ness of ourfindings. We ran detections on 2 signal derivations: (1)
the averaged data of frontal channels and (2) individual channel data.
For frontal SW detection, the signal of the electrodes F3 and F4 was band passefiltered to 0.5e4 Hz (two-way finite impulse responsefilter implemented in EEGLAB) and averaged. SWs were detected on this averaged signal. An SW was detected if a negative deflection of the signal persisted for 0.2e1 second and exceeded an amplitude threshold based on previous studies. To test the robustness of results across several possible amplitude thresholds, detections were performed using 3 different values and used in separate subsequent analyses:
1. Maximal negative deflection<30mV, with the lower 50% of the amplitude distribution discarded as putative false positives (Bersagliere and Achermann, 2010)dnote that, in this case, the exact amplitude and distribution thresholds were not identical to the cited study because of the differences in study goals.
2. Maximal negative deflection<37.5mV, with peak-to-peak amplitude to the subsequent positive deflection >75 mV (Piantoni et al., 2013).
3. Maximal negative deflection <75 mV, with peak-to-peak amplitude to the subsequent positive deflection >140 mV (Massimini et al., 2004).
Putative SWs which were detected even partially outside N2 or SWS and/or coincided with a visually detected artifact epoch were discarded. All SWs detected using each detection threshold were extracted from the EEG signal used for their detection and averaged for each participant, yielding 3 individual average SWs for each participant, one according to each detection criterion. To control for inter-individual differences in baseline EEG voltage because of sex and body size effects, we also calculated a standardized SW for each participant, in which the mean amplitude of the average SW was 0 and its standard deviation 1 within the same participant, regardless of raw voltage. Because this was performed for the average waves detected using all 3 methods, it resulted in a total of 6 average SWs for participant, 3 consisting of EEG voltage time series and another 3 of standardized values of the former.
For all-scalp detections we ran, the above described methods (2) and (3) on the data of 18 EEG channels (Fp1, Fp2, F3, F4, Fz, F7, F8, C3, C4, Cz, P3, P4, O1, O2, F7, F8, T3, T4, T5, and T6). Data from F7, F8, T3, T4, T5, T6, Fz, and Cz were not available for 20 participants and treated as missing data in all subsequent analyses. Simultaneous detections on multiple different electrodes (negative peaks sepa- rated by no more than 200 ms) were grouped together as a single traveling wave, and SWs only exceeding the 75mV amplitude cri- terion were only considered if they co-occurred by these definitions with at least one 140mV SW on another channel (Ujma et al., 2018).
Macroscopic features of SW morphology frequently used in EEG literature (henceforth referred to as “gross parameters”) were represented by the number of SWs, their average amplitude (negative peak voltage inmV), and their average slopes (descending downstate [DDS], ascending downstate [ADS], ascending upstate [AUS], descending upstate [DUS], in all cases expressed inmV/s) and their average negative and positive halfwave durations, which were calculated for each participant. In addition to these, for the 30mV frontal model which used a dynamic detection threshold corre- sponding to the 50thpercentile of the amplitude distribution of these relatively small SWs, the value of the 50thpercentile was also used as a gross parameter. For all-scalp SW detections, we also calculated mean lag (the mean difference of the timing of SW negative peaks on this channel and the channel the first co- occurring SWs occurred on) as a gross parameter. Gross parame- ters were z-transformed across all participants of the same sex to eliminate possible sex differences.
Thefine morphology of SWs was represented by 501 equally spaced time points including and sampled1 second around the negative peak of the average individual SWs, thus each separated by 4 milliseconds. Amplitude values at these time points were ob- tained using linear interpolation for the participants whose original EEG sampling frequency was not 250 Hz. Amplitude values at each of the 501 sampling points were averaged across all SWs within the same participants, yielding an average individual SW morphology consisting of 501 variables, each representing the average SW amplitude at one 4 msec sampling point. For average frontal channel data, thefine morphology of SWs was calculated using all 3 detection criteria. For all-scalp detections in case of SWs co- occurring on multiple channels, SW morphology was measured around each channel’s individual SW peak.
SW detection and further statistical analyses were implemented in MATLAB R2017a (The MathWorks, Natick, MA) using EEGLAB (Delorme and Makeig, 2004) and custom scripts.
2.4. Statistical analysis
This study aimed to reveal whether thefine morphology of SWs is affected by aging beyond its effects on gross parameters:
formally, whether the SW voltage values included in the mea- surement offine morphology account for additional age variance beyond what is accounted for by gross parameters. Standard least square regression modeling of this relationship was precluded by the large number of predictors: although age and EEG data were only available for 176 participants, gross parameters and fine morphology of SWs were represented by 507 predictors (508 in case of 30mV models), leading to a large degree of model under- determination. We aimed to solve the problem of under- determination using least absolute shrinkage and selection operator (LASSO) regression (Tibshirani, 1996). LASSO is an iterative learning algorithm which aims to minimize the following function:
Xn
i¼1
ðyiX
j
xij
b
jÞ2þl
Xpj¼1
j
b
jj (1) Where, yiis the dependent variable with n observations, xijare predictors (total number: p), bj are regression coefficients assigned to the predictors, andlis a penalty parameter which increases in each iteration of LASSO. It is easy to see that the parts of (1) before lrefer to the residual or prediction error of the regression model; however, in each iteration, an additional error term is added for each nonzero regression coefficientjbjj, and this additional error is larger for larger values ofl. In other words, with higher values ofl, the model is forced to constrain more regres- sion coefficients to 0, leaving only the strongest predictors in the model, until ultimately no predictors remain. LASSO balances the number of predictors against prediction accuracy,finding a value oflat which enough predictors are left in the model to account for maximal variance but not so many that it would result in under- determination. Formally, LASSO seeks alvalue for which optimal fit to (1) is achieved in a holdout sample. LASSO is useful when only a subset of the measured predictors are really associated with the dependent variable (Lello et al., 2017) or when a small subset or a single best candidate must be selected from multiple highly correlated predictors (Krapohl et al., 2017), and in the biological sciences, its use is especially common in animal breeding genetics (de los Campos et al., 2013).LASSO was implemented in MATLAB with 5-fold cross- validation. We used LASSO on 7/8 of our sample (N ¼154) for training and 1/8 (N¼22) for validation. Because of 5-fold cross- validation, the model was trained to iteratively find the
combination of regression coefficients in 80% of the training sample to achieve minimal prediction error in the other 20%. This best-fit model was then applied to the fully independent holdout sample (N¼22). Our hypothesis was that LASSO models trained with gross parameters andfine morphology as predictors will perform better at predicting age in an independent sample than those trained only with gross parameters.
Owing to the modest size of our holdout sample, we had limited statistical power to detect differences between modelfits. There- fore, we did not compare individual modelfits but instead analyzed the pattern of modelfit differences between gross parameter-only and full models in groups of similar models: across the 6 different models using averaged frontal data and across the 18 models each using SWs from a different EEG channel. We used the Wilcoxon signed-rank test to test the null hypothesis that the median of modelfit differences is 0. We used exact tests for average frontal data (k¼6 models) and z-statisticebased tests for all-scalp data (k¼18 models). All tests were performed with a two-tailed design.
2.5. Data and code availability
Preprocessed data and custom MATLAB codes for frontal and all- channel SW analysis as well as for LASSO calculation are available at https://osf.io/hjvm8/.
3. Results 3.1. Frontal SWs
Wefirst investigated the predictive power of SW morphology and gross parameters toward age using averaged EEG data from the 2 frontal channels (F3 and F4). Amplitude at certain time periods during the average SW remained as predictors of age in the best-fit LASSO models for all 3 detection thresholds (30 mV, 75mV, and 140mV) and both transformations (raw and z-transformed data).
Fig. 1illustrates the LASSO model run for the best-fit model (140mV z-transformed), whereas Fig. 2 illustrates the prediction of age based on LASSO models.
In an independent holdout sample comprising 1/8th of the sample (N¼22), regression models using SW morphology data provided betterfit to age data than models using only gross pa- rameters (Table 1). This was true for all 3 thresholds and both transformations (6/6 positive signs, W¼6,p¼0.031 based on the Wilcoxon test). The best-fit model using z-transformed wave morphology based on 140þmV waves accounted for up to 80% of age variance, compared with only 58% in the model using only gross parameters.
The equation for the best-fit model was the following:
aged ¼ 90:410:15*Countþ3:19*Amplitude
þ1:63*DUS slopeþ14:21*zamp12:28*zamp0:424 9:04*zamp0:416þ33:2*zamp0:176þ1:52*zamp0:1
10:93*zamp0:048þ10:85*zamp0:036
þ11:97*zamp0:0410:5*zamp0:1880:88*zamp0:372 0:54*zamp0:37613:61*zamp0:456þ2:24*zamp0:628 þ5:96*zamp0:66418:87*zamp0:9126:87*zamp0:956 (2) where count, amplitude, and DUS slope refer to the z-scores (across participants with the same sex) of the corresponding gross parameters using the 140mV detection criterion, whereas zamptime refers to the z-score (across the average SW of the same individual)
of the amplitude of the individual average SW at“time,”expressed in seconds relative to the negative peak.
We recalculated our models by averaging SWs after triggering them to the negative-positive zero crossing instead of the negative peak to calculatefine morphology. Even in this case, the best-fit LASSO model identified average SW amplitude at multiple time points as significant predictors of age beyond the effect of gross parameters, but these models did not provide better fit in the holdout sample than those using gross parameters only (R2dynamic_gross¼47.4%, R275mV_gross¼65.44%, R2140mV_gross¼59.71%, R2dynamic_full ¼32.34%, R275mV_full¼ 48.79%, R2140mV_full ¼66.18%, R2dynamic_full_zscore ¼ 34.33%, R275mV_full_zscore ¼ 28.98%, R2140mV_full_zscore¼50.57%, 1/6 positive signs, W¼1,p¼0.063 based on the Wilcoxon test).
3.2. All-scalp SWs
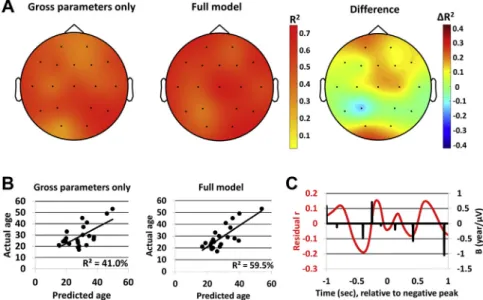
We next investigated potential topographic differences in the predictive potential of SW gross parameters andfine morphology.
Gross parameters provided the bestfit to age data on T6 (R2¼62%), whereas SW morphology provided the most additional explained variance on Fp1 (DR2¼19%). Overall, age could best be predicted using gross parameters and SW morphology on Cz (R2 ¼ 66%).
Regression models also using SW morphology provided betterfit to data over gross parameter-only models on 14 derivations (14/18 positive signs, W¼25, z¼2.64,p¼0.008 based on the Wilcoxon test). Typically, SW morphology was more important for predicting age along the sagittal midline derivations, especially the extremes (frontopolar and occipital), and less important in temporal deriva- tions. On average, SW morphology provided 6.8% of additional explained variance. Notably, all modelsdincluding those using frontal single-channel datadunderperformed compared with the models using SW detections on the averaged signal of the 2 frontal channels.Fig. 3illustrates topographic differences in the predictive power of gross parameters and SW morphology.
3.3. Ultradian effects
We next investigated potential ultradian differences in the predictive potential of SW gross parameters and fine morphology. We reran LASSO models on gross parameters and fine morphology data calculated separately from the 4 sleep quartiles of all detections of the same individual. We performed this analysis both on averaged frontal data and all single channels individually. In both models, age could generally be best predicted using SW data from thefirst sleep quartile and pre- dictive power dropped in the subsequent 4 quartiles. Using the data from averaged frontal channels, full models significantly outperformed gross parametereonly models substantially in the first (DR2mean¼22.05%, 6/6 positive signs, W¼0,p¼0.031) and second (DR2mean¼25.29%, 6/6 positive signs, W¼0,p¼0.031) sleep quartiles, but the difference remained a tendency in the third (DR2mean ¼5.77%, 5/6 positive signs, W¼1, p ¼0.063) quartile and full models significantly underperformed in the fourth (DR2mean¼ 16.43%, 0/6 positive signs, W¼21,p¼0.031).
Using all-scalp data, there was a significant difference in the second (DR2mean¼11.28%, 14/18 positive signs, W¼21, z¼2.81, p¼0.005) quartile. There was no significant difference in thefirst (DR2mean¼0.4%, 8/18 positive signs, W¼79, z¼0.28,p¼0.77), the third (DR2mean¼5.9%, 13/18 positive signs, W¼48, z¼1.64, p ¼ 0.1), and the last (DR2mean ¼ 3.8%, 10/18 positive signs, W¼73, z¼0.54,p¼0.58) quartiles (Fig. 4).
Clear topographic differences in the relative contribution of SW gross parameters andfine morphology to prediction performance emerged across cycles. In thefirst cycles, where predictive power was
maximal and the contribution offine morphology to prediction ac- curacy the lowest, the predictive power of gross parameters andfine morphology was evenly distributed across the scalp. In cycles 2 and 3, the predictive power of gross parameters was strongest in more posterior channels, but the additional accuracy offine morphology remained maximal at frontal locations. In the fourth cycle, while prediction accuracy was the lowest and the overall difference be- tween gross parametereonly and full models was not significant,fine
morphology on posterior channels contributed substantially to pre- diction accuracy (DR2O2¼42%,DR2T6¼33%,DR2T4¼17%) (Fig. 5).
3.4. Contributing elements of SWfine morphology
Which exact elements of SWfine morphology predict age over the effects of gross parameters? To determine this, we took all B- values from best-fit LASSO models, summed them within 125 msec Fig. 1.Illustration of the LASSO model run in the best-fit model, using z-transformed SWs with the 140mV detection threshold. Panel (A), generated using the lassoPlot() MATLAB function, shows changes in the mean squared error (MSE) of prediction at variousland illustrates how the model converges on a value oflwhich provides the bestfit in the cross- validation sample. A green circle and a corresponding dashed line show thelvalue with the lowest MSE, whereas a blue dot shows the value of the greatestlthat is within one standard error of the minimum MSE. Panel (B) shows the regression coefficients (in years/between-participant SD for gross parameters and years/within-participant amplitude SD forfine morphology) assigned to SW gross parameters (upper panel) andfine morphology, operationalized as the amplitude of the individual mean SW at 501 equally spaced time points relative to the negative peak (lower panel). A vertical red line indicates thelvalue providing the best-fit model. Zero regression coefficients were manually set to500 to appear pure blue and enhance the visibility of nonzero coefficients. Abbreviations: LASSO, least absolute shrinkage and selection operator; SW, slow wave. (For interpretation of the references to color in thisfigure legend, the reader is referred to the Web version of this article.)
temporal bins, and plotted them against an average SW (Fig. 6). SWs in younger participants had more negative voltage immediately before but more positive voltage immediately after and 125e250 msec before the negative peak. This effect was most prominent in averaged frontal and frontocentral derivations. Another minor ef- fect was the presence of a later, larger positive peak after the negative peak in younger individuals, which showed a steeper decline thereafter.
In other words, younger participants were characterized by a more rapid initiation and dissipation of the SW downstate, and a later, more prominent upstate, which also declined faster. This ef- fect was present over and beyond what was captured by gross pa- rameters such as SW slope and halfwave duration.
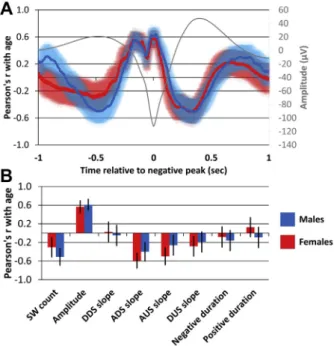
3.5. Sex differences
The modest size of our replication sample did not allow for the rigorous testing of sex differences in age prediction accuracy.
Nominally, both the 140mV average frontal model and the selected Fp1 single-channel model showed higher accuracy in females (N ¼ 9, rfrontal_gross ¼ 0.91, rfrontal_full ¼ 0.96; rFp1_gross ¼ 0.88, rFp1_full ¼ 0.93) than in males (N ¼ 13, rfrontal_gross ¼ 0.65, rfrontal_full¼0.86; rFp1_gross¼0.49, rFp1_full¼0.75), but at this sample size, none of these differences were statistically significant. In the
full sample, we observed a stronger correlation between ascending slope steepness and age in females, while earlyfine morphology amplitude correlated with age positively in males and negatively in females. In addition, immediately before the onset of the down- state, a more negative age-amplitude correlation was seen in males.
Thesefindings are illustrated onFig. 7.
3.6. SWs mediating the relationship between age and cognitive performance
If the relationship between age and cognitive performance is mediated by age-related changes in SW characteristics, then the correlation between age and cognitive performance should be attenuated after controlling for SW characteristics. We assessed this by using different measures of cognitive performance we had in our database: the Zahlen verbindungs test (ZVT, N ¼ 107), a trail- making test, and 2 nonverbal IQ tests as available in each partici- pant, Raven’s Advanced Progressive Matrices (APMs) and the Cul- ture Fair Test (CFT), henceforth referred to as IQ, although we did not norm raw scores to a deviation IQ score (N¼158 with at least one test score). We converted raw test scores to Raven’s APM equivalents (the Raven’s APM raw score corresponding to the same IQ as the other test, given the participant’s age as the actual test score) before averaging. Raven’s APM and CFT measure general Fig. 2.Predicting age from SW gross parameters and morphology. Panel (A): individual average frontal SWs using the 140mV criterion without standardization, color-coded by age.
Note the larger deflections in younger participants. The black line shows the regression coefficients assigned to the amplitude at each data point in the best-fit LASSO model. Panel (B): Pearson’s correlation coefficient between average 140mV frontal SW morphology and age after removing the effects of gross parameters using linear regression (left axis, red line) and the regression coefficients assigned to the amplitude at each data point in the best-fit LASSO model (right axis, black line, identical to those shown on panel A). Note that SW morphology shows substantial correlations with age even after controlling for gross parameters, and LASSOfits the best predictive model to include data points with high residual correlation. Panel (C): correlation between predicted and actual age in the holdout sample using LASSO models with gross parameters only (left), SW morphology only (middle), and the full model (right). All data on thisfigure show results from nonstandardized 140mV SWs. While slightly better performance was achieved by z-transforming SWs within participants, we show data from this second-best model to preserve themV units of the EEG data. Abbreviations: LASSO, least absolute shrinkage and selection operator; SW, slow wave. (For interpretation of the references to color in thisfigure legend, the reader is referred to the Web version of this article.)
Table 1
Percentage of age variance explained by different models in the holdout sample
Detection threshold Gross parameters only SW morphology only SW morphology only, normalized Full model Full model, with normalized SW morphology
Dynamic 47.64% 71.16% 75.58% 67.02% 75.24%
75mV 64.48% 80.41% 76.49% 72.14% 77.32%
140mV 58.45% 75.58% 83.33% 78.13% 79.81%
Rows refer to the threshold of the SW detection method, whereas columns refer to differences in model construction (predicting age based on gross parameters only, SW morphology only or both, and whether SW morphology was z-transformed within-participant to eliminate amplitude differences).
Fig. 4.The predictive power (proportion of age variance explained in the holdout sample) of SW characteristics across sleep quartiles. Panel (A) shows the average predictive power of the 18 models using SW data from each EEG derivation. Error bars show 95% confidence intervals computed from SD across channels. Panel (B) shows the predictive power of models using SW detections on averaged frontal data. Full model with z-transformation refers to models in which the average SW was z-transformed for each participant.
Abbreviation: SW, slow wave.
Fig. 3.Topographic differences in the predictive power of SW gross parameters andfine morphology. Panel (A): the topographical distribution of explained variance in the holdout sample using regression coefficients from LASSO with gross parameters only (left) or gross parameters and SW morphology (middle) and the difference of explained variance between the 2 models (right). O1 data were manually removed for 1 participant with outlying data (correlation between predicted and actual age with and without this participant:
rgross_with¼r¼0.45, rgross_without¼r¼0.66; rfull_with¼0.04, rfull_without¼0.66). Panel (B): the correlation between predicted age (axis x) and actual age (axis y) in the holdout sample based on gross parameters only (left) or gross parameters and SW morphology (middle). All data are from Fp1 where the difference between the performance of the 2 models was maximal. Panel (C): Pearson’s correlation coefficients between individual average morphology at 501 data points and age after regressing out the effects of gross parameters (left axis, red line) and the regression coefficients from the best-fit LASSO model (right axis, black line). All data are from Fp1 where the difference between the performance of the 2 models was maximal. Note that SW morphology shows substantial correlations with age even after controlling for gross parameters, and LASSOfits the best predictive model to include data points with high residual correlation. Abbreviations: LASSO, least absolute shrinkage and selection operator; SW, slow wave. (For interpretation of the references to color in thisfigure legend, the reader is referred to the Web version of this article.)
cognitive ability and test-specific abilities (Gignac, 2015), whereas ZVT is a measurement of general cognitive ability and mental speed, both of which are negatively affected by aging (Salthouse, 2004).
Both IQ (r¼ 0.22) and ZVT (r¼0.49) scores were significantly correlated with age (note that because ZVT measures reaction time, a positive correlation indicates worse performance at later age).
We calculated Pearson’s partial correlation coefficients between age and ZVT/IQ, correcting for SW characteristics (Fig. 8) and assessed whether the corrected correlation falls outside the confi- dence intervals of the uncorrected correlation coefficient. We did notfind evidence for significant mediation, but a tendency for it emerged in case of both test scores if we controlled for amplitude during early descending downstates and late ascending upstates. In other words, ourfindings provide some limited evidence that the loss of SW steepness may play a functional role in worse cognitive functioning at higher ages.
4. Discussion
We trained LASSO regression models to predict age from SW gross parameters and fine morphology in 154 participants and validated our models in an independent holdout sample of 22 participants. Although our findings can be viewed as a proof of concept for predicting age (or rather a‘brain age’(Sun et al., 2019)) from sleep EEG data, in our view, the most important insights they provide is into how SWs in NREM are affected by normal aging. Our study is by its nature correlational but because the route of causation between chronological age and SW characteristics can only run from the former to the latter, learning which SW characteristics predict age best is an indicator of which ones are the most affected by aging. Our study revealed which age-related changes in SWs are adequately captured by easily calculable gross parameters, which ones are only captured by the more accuratefine Fig. 5.Topographic differences in the predictive power of SW parameters across sleep
quartiles. The left column of topographic plots shows the proportion of age variance explained in the holdout sample by gross parametereonly models using data from each electrode. The middle column illustrates topographic differences of the propor- tion of variance explained by full models (gross parameters plus SW morphology). The right column shows the difference in variance explained between the 2 models.
Abbreviation: SW, slow wave.
Fig. 6.The elements of SWfine morphology which predicted age over the effects of gross parameters. Regression coefficients from the best-fit LASSO models were summed up within 125 msec bins across all models with similar predictors: averaged frontal SWs with or without z-transformation with different amplitude criteria (Panel A) and single- channel SWs from frontocentral (Fp1, Fp2, F3, F4, C3, C4, Fz, Cz), posterior (P3, P4, O1, O2, T5, T6), or lateral (F7, F8, T3, T4) channels (Panel B). All sums of B-values are plotted against the grand average 140mV frontal SW for illustration. Note the different y-axis limits for frontocentral waves.
morphology, and how these changes and their proportions are different across EEG derivations and sleep cycles.
We found that gross parameters are indeed highly correlated with age, sharing up to 60%e65% of their overall variance with it.
This was higher than what was found in previous studies, such as r¼0.49 between age and SW density in 82 participants (Carrier et al., 2011), r ¼ 0.28 for log delta power in 211 participants (Schwarz et al., 2017), and r¼0.28 and r¼0.62 for relative delta power in 2 subsamples (N¼87 and N¼72, respectively) of the present study (Pótári et al., 2017), highlighting the superiority of a multivariate approach compared with simply using spectral power in the investigation of age-related sleep EEG changes (ForCarrier et al., 2011, the correlation was calculated from F¼13.9 (Fig. 2) for the dichotomous age difference, corresponding to d¼0.835 and r¼ 0.39 at N¼82. This correlation was corrected for the downward bias of dichotomization, assuming a cutoff at 52.4% of the sample based on subsample sizes, corresponding to the normal deviate z¼ 0.06 and the normal ordinate 0.4. For Schwarz et al., 2017, the correlation was calculated from the t-values in Table 4.). Recently, Sun et al. (2019)could predict 21.2% of age variance from sleep macrostructure, but 67.2% using sleep microstructure, similar to our gross parameters. Still, our study shows that age-related changes in SWs are far from fully captured by changes even by all the gross parameters. The individual average shape of the SW remains correlated with age after regressing out the variance also captured by gross parameters (Fig. 2, panel B;Fig. 3, panel C), and LASSO regression could be trained to capture this correlation to predict even more of the age variance (up to 80%). In other words, SW characteristics are very strongly indicative of the participants’age, but approximate measures of the SW shape are not sufficient to fully measure age effects. This requires that we take into account Fig. 7.Sex differences in the relationship between age and SW characteristics. Panel
(A) shows Pearson’s correlation coefficients by sex between SWfine morphology using individual average frontal SWs based on the 140mV detection threshold. Amplitude is measured as a negative deflection, resulting in a positive correlation with age. The shaded areas show the 95% confidence intervals of the correlation coefficient. The grand average SW is shown for guidance. Panel (B) shows Pearson’s correlation coef- ficient by sex between SW gross parameters based on the 140mV detection threshold.
Error bars show 95% confidence intervals. Abbreviations: SW, slow wave; DDS, descending downstate; ADS, ascending downstate; AUS, ascending upstate; DUS, descending upstate.
Fig. 8.The mediation of the relationship between age and cognitive performance by SW characteristics. Panel (A): Pearson’s partial correlation coefficients between age and average IQ test raw scores (left) and ZVT raw scores (right) corrected for each of the gross parameters. Green lines show the confidence intervals of the uncorrected correlation coefficient (rZVT¼0.49; rIQ¼ 0.22). Axis x is placed at the uncorrected correlation coefficient so the size and direction of bars show the difference of corrected and uncorrected correlations.
Panel (B): Pearson’s partial correlation coefficients (thick black line) between age and average IQ test raw scores (left) and ZVT raw scores (right) corrected for amplitude at each of the 501 SWfine morphology sampling points. The shaded green area shows the confidence intervals of the uncorrected correlation coefficient (rZVT¼0.49; rIQ¼ 0.22). The grand average SW (gray) and the corresponding B-values from the best-fit 140mV model (red, multiplied by 100 for visibility) are shown for guidance. Abbreviations: SW, slow wave; DDS, descending downstate; ADS, ascending downstate; AUS, ascending upstate; DUS, descending upstate; ZVT, Zahlen verbindungs test. (For interpretation of the references to color in thisfigure legend, the reader is referred to the Web version of this article.)
the precise waveform. Further analyses revealed several other important details of this effect.
First, a more stringent definition of SWs enables a better pre- diction of age, suggesting that the discovery of age effects on SWs is more sensitive to false positives than false negatives. Eliminating false positives by choosing a higher detection threshold or aver- aging data across channels resulted in SW data with higher accu- racy in predicting age. Models with higher SW detection thresholds and consequently fewer detected SWs always had higher accuracy (Table 1) and SW detections based on averaged frontal channel data provided the bestfit, better than both individual frontal channels or any other (Table 1,Fig. 3). Ourfindings are in line with those ofSun et al. (2019)who also found that although EEG data using frontal channels could predict age slightly better than central or occipital channels, all were outperformed by models using data from all electrodes.
Second, although not all of the SW-age covariance captured by thefine morphology is captured by gross parameters, the converse is not true. Fine morphology generally provided better fit to age data than only gross parametersdhowever, afine morphology-only model provided afit at least as good as the one achieved by the full models also using gross parameters. In other words, fine morphology beyond its own independent predictive power pos- sesses all of the predictive power of gross parameters as well.
Third, there are clear topographic differences in the correlation between age and SW characteristics. Age effects on SW gross pa- rameters are not the strongest on frontal derivations where SWs are generally the most prominent but rather on more posterior deri- vations. Older participants produce fewer, smaller, and shallower SWs in more posterior cerebral areas even if frontal SWs are rela- tively unaffected. This is, however, mainly because at more frontal locations, the gross parameters fail to measure age-related changes that thefine morphology does capture. Full models mainly predict age better because thefine morphology explains additional vari- ance on frontal and central channels (Fig. 3), which is in line with the study bySprecher et al. (2016)who also found that age-related changes in SW power are widely spread out across the scalp and the study by Sun et al. (2019)who found only small differences be- tween the predictive power of frontal, central, and occipital channels.
Fourth, the correlation between age and SW characteristics is variable across sleep cycles (in our study approximated by sleep quartiles). SW characteristics are most predictive of age in thefirst cycle, and in this cycle, only models based on average frontal SWs fine morphology could outperform gross parameter-only models.
Fine morphology provided the most value in predicting age in cycle 2; its role was reduced in cycle 3 and disappeared by cycle 4. In other words, age effects on SWs are strongest in early sleep, when SWs are generally the most frequent and prominent. Gross pa- rameters, however, do not capture age effects adequately toward midsleep, and fine morphology provides better accuracy. In late sleep, age effects on SWs are generally weaker and fully captured by gross parameters.
SW morphology was generally associated with age during phase transitions, especially late descending and early ascending down- states and late descending upstates (possibly indicating the initia- tion of the next downstate). Thesefindings suggest that age-related changes in SW morphology especially affect the speed and degree of the initiation and cessation of SW upstate and downstate. These findings are interpretable in light of previous literature using high- density scalp EEG, coregistered invasive and scalp EEG in humans or computer and rodent models. SWs accurately reflect the onset and cessation of cortical neuronal firing, even in human recordings (Csercsa et al., 2010; Nir et al., 2011). Consequently, the shape of the SW reflects how rapidly and to what extent neuronal firing is
synchronized (Esser et al., 2007; Riedner et al., 2007; Vyazovskiy et al., 2007). In line with the view that SWs reflect a homeostatic response to long-term potentiation taking place in the preceding wakefulness (Tononi and Cirelli, 2014), frequent, high-amplitude SWs with steep slopes are seen under conditions of high homeo- static pressure for sleep, such as early in the night (Esser et al., 2007; Riedner et al., 2007) or in case of young participants with a higher degree of neuronal plasticity (Feinberg and Campbell, 2013).
Based on these studies, the current results can be interpreted as a more rapid initiation and cessation of synchronized cortical neuronalfiring in younger participants, in line with thefinding that in older participants, both the homeostatic need for SWs and the ability to respond to this need by SW generation is reduced (Mander et al., 2017). In line with previousfindings, age effects were strongest in thefirst quartile of sleep when sleep pressure is the strongest and approximately equally distributed across the scalp (Sprecher et al., 2016).
Age-related changes in any SW measure are important because alterations in NREM sleep are thought to play a functional role in age-related cognitive decline (Mander et al., 2017). In one study, NREM SW activity reductions statistically mediated the age-related reduction in overnight memory consolidation (Mander et al., 2013).
Following up animal experiments demonstrating the effect of sleep deprivation on beta amyloid accumulation (for a summary, see [Ju et al., 2013]), a structural equation modeling study demonstrated that the relationship betweenbamyloid accumulation and reduced memory function is mediated by SW activity (Mander et al., 2015).
This suggests that an important part of Alzheimer pathology may be related not directly to the beta amyloid burden but to the resulting disruption of NREM sleep (Lucey and Holtzman, 2015). Although it would be tentative to see both the cognitive symptoms and NREM sleep changes in Alzheimer’s disease as an extreme case of normal aging, it must be considered that while normal aging involves a reduction of a wide range of slow frequency activity not limited to delta, very low frequencies are especially affected in Alzheimer’s disease (Mander et al., 2017). The molecular composition of beta amyloid proteins is also different in normal aging and Alzheimer’s disease (Piccini et al., 2005). Therefore, it requires further research to establish the degree to which SW changes in normal aging and in dementia are analogous.
We found that although the mediation of the age-related reduction on cognitive test performance by SW characteristics remained a trend, they were strongest at the SW phase transitions where the SWfine morphology was independently associated with age. Our cognitive tests measured either general cognitive ability and test-specific abilities (Raven APM, CFT) (Gignac, 2015) or a combination of general cognitive ability and mental speed (ZVT) both of which are known to be strongly negatively associated with aging (Salthouse, 2004). In line with this observation, ZVT perfor- mance was the most strongly correlated with age. Although this effect did not reach statistical significance, the correlation between age and cognitive performance was attenuated after statistically controlling for some SW characteristics, especially SW amplitude around phase transitions, suggesting that the neurobiological mechanism underlying reduced SW steepness may also play a role in age-related reductions in cognitive performance. Further research with a more detailed neuropsychological assessment battery and preferably with a larger sample size should investigate the role SW characteristics play in mediating age-related reductions in cognitive performance.
This has important translational potential as extant evidence already suggests that cognitive functioning in wakefulness, also in old age, can be improved by artificially increasing SW activity in NREM sleep through heating and auditory or electrical stimulation (Ladenbauer et al., 2017; Papalambros et al., 2017; Wilckens et al.,
2018). SW characteristics that are particularly affected by aging, especially if they also statistically mediate age-related reductions in cognitive performance, can be especially promising targets of such restorative interventions. Our study provides preliminary evidence that SW phase transition speed and steepness may be one such characteristic.
Our study suffers from a number of limitations. First, due to the cross-sectional nature of our study, we had a limited ability to establish cause-effect relationships. Second, although our partici- pants spent 2 nights in the laboratory, no EEG recording was per- formed on thefirst night. Therefore, we are also unable to assess the internight reliability of predicting age from EEG performance and the possible role offirst-night effects, and our results are repre- sentative for the second night. Third, although we used multiple methods to detect SWs to test the robustness of the prediction of age from SW characteristics, our methodology did not cover the full range of existing SW detection algorithms.
Disclosure
All authors do not declare any actual or potential conflicts of interest.
Acknowledgements
The research was supported by institutional funding of the au- thors. Participants provided written informed consent according to approval of the local ethics boards in Munich and Budapest. Péter P.
Ujma was supported by the ÚNKP-17-4 New National Excellence Program of the Ministry of Human Capacities. Péter Simor was supported by the Hungarian Scientific Research Fund (NKFI FK 128100) of the National Research, Development and Innovation Office and by the UNKP-18-4 (Bolyaiþ) New National Excellence Program of the Ministry of Human Capacities and by the Bolyai János Research Scholarship of the Hungarian Academy of Sciences.
Appendix A. Supplementary data
Supplementary data to this article can be found online athttps://
doi.org/10.1016/j.neurobiolaging.2019.04.002.
References
Amzica, F., Steriade, M., 1995. Disconnection of intracortical synaptic linkages dis- rupts synchronization of a slow oscillation. J. Neurosci. 15, 4658e4677. Anderson, C., Horne, J.A., 2003. Prefrontal cortex: links between low frequency delta
EEG in sleep and neuropsychological performance in healthy, older people.
Psychophysiology 40, 349e357.
Bersagliere, A., Achermann, P., 2010. Slow oscillations in human non-rapid eye movement sleep electroencephalogram: effects of increased sleep pressure.
J. Sleep Res. 19, 228e237.
Borbely, A.A., Baumann, F., Brandeis, D., Strauch, I., Lehmann, D., 1981. Sleep deprivation: effect on sleep stages and EEG power density in man. Electro- encephalogr. Clin. Neurophysiol. 51, 483e495.
Carrier, J., Land, S., Buysse, D.J., Kupfer, D.J., Monk, T.H., 2001. The effects of age and gender on sleep EEG power spectral density in the middle years of life (ages 20e60 years old). Psychophysiology 38, 232e242.
Carrier, J., Viens, I., Poirier, G., Robillard, R., Lafortune, M., Vandewalle, G., Martin, N., Barakat, M., Paquet, J., Filipini, D., 2011. Sleep slow wave changes during the middle years of life. Eur. J. Neurosci. 33, 758e766.
Colrain, I.M., Baker, F.C., 2011. Changes in sleep as a function of adolescent devel- opment. Neuropsychol. Rev. 21, 5e21.
Colrain, I.M., Crowley, K.E., Nicholas, C.L., Afifi, L., Baker, F.C., Padilla, M., Turlington, S.R., Trinder, J., 2010. Sleep evoked delta frequency responses show a linear decline in amplitude across the adult lifespan. Neurobiol. Aging 31, 874e883.
Colrain, I.M., Sullivan, E.V., Rohlfing, T., Baker, F.C., Nicholas, C.L., Padilla, M.L., Chanraud, S., Pitel, A.L., Pfefferbaum, A., 2011. Independent contributions of cortical gray matter, aging, sex and alcoholism to K-complex amplitude evoked during sleep. Sleep 34, 787e795.
Crowley, K., Trinder, J., Colrain, I.M., 2002. An examination of evoked K-complex amplitude and frequency of occurrence in the elderly. J. Sleep Res. 11, 129e140.
Crunelli, V., Hughes, S.W., 2010. The slow (<1 Hz) rhythm of non-REM sleep: a dialogue between three cardinal oscillators. Nat. Neurosci. 13, 9e17.
Csercsa, R., Dombovári, B., Fabó, D., Wittner, L., Eross, L., Entz, L., Sólyom, A., Rásonyi, G., Szucs, A., Kelemen, A., Jakus, R., Juhos, V., Grand, L., Magony, A., Halász, P., Freund, T.F., Maglóczky, Z., Cash, S.S., Papp, L., Karmos, G., Halgren, E., Ulbert, I., 2010. Laminar analysis of slow wave activity in humans. Brain 133, 2814e2829.
David, F., Schmiedt, J.T., Taylor, H.L., Orban, G., Di Giovanni, G., Uebele, V.N., Renger, J.J., Lambert, R.C., Leresche, N., Crunelli, V., 2013. Essential thalamic contribution to slow waves of natural sleep. J. Neurosci. 33, 19599e19610.
de los Campos, G., Hickey, J.M., Pong-Wong, R., Daetwyler, H.D., Calus, M.P.L., 2013.
Whole-genome regression and prediction methods applied to plant and animal breeding. Genetics 193, 327e345.
Delorme, A., Makeig, S., 2004. EEGLAB: an open source toolbox for analysis of single-trial EEG dynamics including independent component analysis.
J. Neurosci. Methods 134, 9e21.
Dresler, M., Spoormaker, V.I., Beitinger, P., Czisch, M., Kimura, M., Steiger, A., Holsboer, F., 2014. Neuroscience-driven discovery and development of sleep therapeutics. Pharmacol. Ther. 141, 300e334.
Dube, J., Lafortune, M., Bedetti, C., Bouchard, M., Gagnon, J.F., Doyon, J., Evans, A.C., Lina, J.M., Carrier, J., 2015. Cortical thinning explains changes in sleep slow waves during adulthood, 35, 7795e7807.
Esser, S.K., Hill, S.L., Tononi, G., 2007. Sleep homeostasis and cortical synchroniza- tion: I. Modeling the effects of synaptic strength on sleep slow waves. Sleep 30, 1617e1630.
Feinberg, I., Campbell, I.G., 2013. Longitudinal sleep EEG trajectories indicate com- plex patterns of adolescent brain maturation. Am. J. Physiol. Regul. Integr. Comp.
Physiol. 304, 28.
Gignac, G.E., 2015. Raven’s is not a pure measure of general intelligence: implica- tions for g factor theory and the brief measurement of g. Intelligence 52, 71e79.
Halász, P., 2005. K-complex, a reactive EEG graphoelement of NREM sleep: an old chap in a new garment. Sleep Med. Rev. 9, 391e412.
Huber, R., Felice Ghilardi, M., Massimini, M., Tononi, G., 2004. Local sleep and learning. Nature 430, 78e81.
Huber, R., Esser, S.K., Ferrarelli, F., Massimini, M., Peterson, M.J., Tononi, G., 2007.
TMS-induced cortical potentiation during wakefulness locally increases slow wave activity during sleep. PLoS One 2, e276.
Huber, R., Mäki, H., Rosanova, M., Casarotto, S., Canali, P., Casali, A.G., Tononi, G., Massimini, M., 2013. Human cortical excitability increases with time awake.
Cereb. Cortex 23, 1e7.
Iber, C., Ancoli-Israel, S., Chesson, A., Quan, S., 2007. The AASM Manual for the Scoring of Sleep and Associated Events: Rules, Terminology and Technical Specification,first ed. American Academy of Sleep Medicine, Westchester, IL.
Jasper, H.H., 1958. Report of the committee on methods of clinical examination in electroencephalography: 1957. Electroencephalogr. Clin. Neurophysiol. 10, 370e375.
Ju, Y.-E.S., Lucey, B.P., Holtzman, D.M., 2013. Sleep and Alzheimer disease patho- logyda bidirectional relationship. Nat. Rev. Neurol. 10, 115.
Key, A.P., Dove, G.O., Maguire, M.J., 2005. Linking brainwaves to the brain: an ERP primer. Dev. Neuropsychol. 27, 183e215.
Krapohl, E., Patel, H., Newhouse, S., Curtis, C.J., von Stumm, S., Dale, P.S., Zabaneh, D., Breen, G., O’Reilly, P.F., Plomin, R., 2017. Multi-polygenic score approach to trait prediction. Mol. Psychiatry 23, 1368e1374.
Kurth, S., Ringli, M., LeBourgeois, M.K., Geiger, A., Buchmann, A., Jenni, O.G., Huber, R., 2012. Mapping the electrophysiological marker of sleep depth reveals skill maturation in children and adolescents. Neuroimage 63, 959e965.
Ladenbauer, J., Ladenbauer, J., Külzow, N., de Boor, R., Avramova, E., Grittner, U., Flöel, A., 2017. Promoting sleep oscillations and their functional coupling by transcranial stimulation enhances memory consolidation in mild cognitive impairment, 37, 7111e7124.
Latreille, V., Gaubert, M., Dubé, J., Lina, J.-M., Gagnon, F., Carrier, J., 2019. Age-related cortical signatures of human sleep electroencephalography. Neurobiol. Aging 76, 108e114.
Lello, L., Avery, S.G., Tellier, L., Vazquez, A., de los Campos, G., Hsu, S.D.H., 2018.
Accurate Genomic Prediction of Human Height. Genetics 210, 477e497.
Lucey, B.P., Holtzman, D.M., 2015. How amyloid, sleep and memory connect. Nat.
Neurosci. 18, 933e934.
Mander, B.A., Winer, J.R., Walker, M.P., 2017. Sleep and human aging. Neuron 94, 19e36.
Mander, B.A., Marks, S.M., Vogel, J.W., Rao, V., Lu, B., Saletin, J.M., Ancoli-Israel, S., Jagust, W.J., Walker, M.P., 2015.b-amyloid disrupts human NREM slow waves and related hippocampus-dependent memory consolidation. Nat. Neurosci. 18, 1051.
Mander, B.A., Rao, V., Lu, B., Saletin, J.M., Lindquist, J.R., Ancoli-Israel, S., Jagust, W., Walker, M.P., 2013. Prefrontal atrophy, disrupted NREM slow waves and impaired hippocampal-dependent memory in aging. Nat. Neurosci. 16, 357e364.
Massimini, M., Huber, R., Ferrarelli, F., Hill, S., Tononi, G., 2004. The sleep slow oscillation as a traveling wave. J. Neurosci. 24, 6862e6870.
Mazzotti, D.R., Guindalini, C., Moraes, W., Andersen, M.L., Cendoroglo, M.S., Ramos, L.R., Tufik, S., 2014. Human longevity is associated with regular sleep patterns, maintenance of slow wave sleep and favorable lipid profile. Front.
Aging Neurosci. 6, 134.
Nir, Y., Staba, R.J., Andrillon, T., Vyazovskiy, V.V., Cirelli, C., Fried, I., Tononi, G., 2011.
Regional slow waves and spindles in human sleep. Neuron 70, 153e169.
Papalambros, N.A., Santostasi, G., Malkani, R.G., Braun, R., Weintraub, S., Paller, K.A., Zee, P.C., 2017. Acoustic enhancement of sleep slow oscillations and concomi- tant memory improvement in older adults. Front. Hum. Neurosci. 11, 109.
Piantoni, G., Poil, S.S., Linkenkaer-Hansen, K., Verweij, I.M., Ramautar, J.R., Van Someren, E.J., Van Der Werf, Y.D., 2013. Individual differences in white matter diffusion affect sleep oscillations. J. Neurosci. 33, 227e233.
Piccini, A., Russo, C., Gliozzi, A., Relini, A., Vitali, A., Borghi, R., Giliberto, L., Armirotti, A., D’Arrigo, C., Bachi, A., Cattaneo, A., Canale, C., Torrassa, S., Saido, T.C., Markesbery, W., Gambetti, P., Tabaton, M., 2005. beta-amyloid is different in normal aging and in Alzheimer disease. J. Biol. Chem. 280, 34186e34192.
Pótári, A., Ujma, P.P., Konrad, B.N., Genzel, L., Simor, P., Körmendi, J., Gombos, F., Steiger, A., Dresler, M., Bódizs, R., 2017. Age-related changes in sleep EEG are attenuated in highly intelligent individuals. Neuroimage 146, 554e560.
Riedner, B.A., Vyazovskiy, V.V., Huber, R., Massimini, M., Esser, S., Murphy, M., Tononi, G., 2007. Sleep homeostasis and cortical synchronization: III. A high- density EEG study of sleep slow waves in humans. Sleep 30, 1643e1657.
Salthouse, T.A., 2004. Localizing age-related individual differences in a hierarchical structure. Intelligence 32, 541e561.
Schwarz J, F.A., Åkerstedt, T., Lindberg, E., Gruber, G., Fischer, H., Theorell-Haglöw, J., 2017. Age affects sleep microstructure more than sleep macrostructure. J. Sleep Res. 26, 277e287.
Sprecher, K.E., Riedner, B.A., Smith, R.F., Tononi, G., Davidson, R.J., Benca, R.M., 2016.
High resolution topography of age-related changes in non-rapid eye movement sleep electroencephalography. PLoS One 11, e0149770.
Sun, H., Paixao, L., Oliva, J.T., Goparaju, B., Carvalho, D.Z., van Leeuwen, K.G., Akeju, O., Thomas, R.J., Cash, S.S., Bianchi, M.T., Westover, M.B., 2019. Brain age from the electroencephalogram of sleep. Neurobiol. Aging 74, 112e120.
Steriade, M., Nunez, A., Amzica, F., 1993. A novel slow (<1 Hz) oscillation of neocortical neurons in vivo: depolarizing and hyperpolarizing components.
J. Neurosci. 13, 3252e3265.
Tibshirani, R., 1996. Regression shrinkage and selection via the lasso. J. R. Stat. Soc.
Series. B Stat Methodol 58, 267e288.
Tononi, G., Cirelli, C., 2014. Sleep and the price of plasticity: from synaptic and cellular homeostasis to memory consolidation and integration. Neuron 81, 12e34.
Ujma, P.P., Konrad, B.N., Genzel, L., Bleifuss, A., Simor, P., Potari, A., Kormendi, J., Gombos, F., Steiger, A., Bodizs, R., Dresler, M., 2014. Sleep spindles and intelli- gence: evidence for a sexual dimorphism. J. Neurosci. 34, 16358e16368.
Ujma, P.P., Halász, P., Simor, P., Fabó, D., Ferri, R., 2018. Increased cortical involve- ment and synchronization during CAP A1 slow waves. Brain Struct. Funct. 8, 3531e3542.
Vyazovskiy, V.V., Riedner, B.A., Cirelli, C., Tononi, G., 2007. Sleep homeostasis and cortical synchronization: II. A localfield potential study of sleep slow waves in the rat. Sleep 30, 1631e1642.
Vyazovskiy, V.V., Cirelli, C., Pfister-Genskow, M., Faraguna, U., Tononi, G., 2008.
Molecular and electrophysiological evidence for net synaptic potentiation in wake and depression in sleep. Nat. Neurosci. 11, 200e208.
Wilckens, K.A., Ferrarelli, F., Walker, M.P., Buysse, D.J., 2018. Slow-wave activity enhancement to improve cognition. Trends Neurosci. 47, 470e482.
Yaffe, K., Falvey, C.M., Hoang, T., 2014. Connections between sleep and cognition in older adults. Lancet Neurol. 13, 1017e1028.