Balla, E., & Vad, J. (2021). An empirical model to determine lift and drag coefficients of cambered plates at moderate Reynolds numbers. Proceedings of the Institution of Mechanical Engineers, Part A: Journal of Power and Energy, 235(2), 202-210
https://doi.org/10.1177/0957650920915317 Accepted for publication
Reuse is restricted to non-commercial and no derivative uses
An empirical model to determine lift and drag coefficients of cambered plates at moderate Reynolds numbers
Esztella BALLA, János VAD Department of Fluid Mechanics Faculty of Mechanical Engineering Budapest University of Technology and Economics
Bertalan Lajos u. 4-6., H-1111 Budapest, Hungary; balla@ara.bme.hu, vad@ara.bme.hu
ABSTRACT
This paper presents the lift and drag coefficients of cambered plate blade sections of different relative camber at moderate Reynolds numbers. Relative cambers between 0%
and 8% are investigated at an angle of attack range from 0° to 10°. Based on own measurements and literature data, empirical formulae are proposed for the determination of the lift and drag coefficients for Reynolds numbers within the range of 60 000 to 300 000. The formulae determine the lift and drag coefficients as a function of angle of attack, relative camber, and Reynolds number. Third order polynomials have been proven to be suitable for the empirical formulae. The coefficients of the third order polynomials have been determined and reported by the authors herein.
KEYWORDS
cambered plate blade, low-Reynolds-number axial fan, low-speed fan, lift and drag coefficients
NOMENCLATURE
A, B, C, D empirical coefficients
c chord [m]
CD drag coefficient CL lift coefficient
f maximum camber [m]
R2 determination coefficient
Re Reynolds number
S slope
t thickness [m]
U free-stream velocity [m/s]
α angle of attack [°]
ν kinematic viscosity [m2/s]
Subscripts
300 datum point
D drag
i, j indices
L lift
Abbreviations
2D two-dimensional
AR aspect ratio
LE leading edge
TE trailing edge
1) INTRODUCTION AND OBJECTIVES
The aim of the present paper is to provide empirical formulae to calculate the lift and drag coefficients acting on isolated cambered plates at low Reynolds numbers. The Reynolds number is defined as
𝑹𝒆 =𝒄𝑼
𝝂 (𝟏)
where c is the chord of the cambered plate, U is the free-stream velocity, and ν is the kinematic viscosity. The present investigation focuses on the Reynolds number
range between 60 000 and 300 000, being relevant to axial flow ventilating fans of low speed and/or size. Cambered plates are used in ventilating fan applications due to their low manufacturing cost. Cambered plate blading is also suitable for the construction of guide vanes in turbomachines and other air technical applications [1]. Fans with small rotor diameter and/or rotational speed are characterized by low Reynolds number, e.g.
cooling fans for electric motors [2, 3]. Low Reynolds number applications also appear at newly emerging fields, for instance in the aerospace industry, e.g. the design of a small Mars helicopter [4].
At Reynolds numbers below a certain limiting Reynolds number, the performance of profiled blading starts to deteriorate rapidly, due to the increased drag [5]. The increase of drag with decreasing Reynolds number can also be observed in the case of cambered plates, however it is less significant compared to profiled airfoils. According to the studies of Schmitz [6], and to the qualitative description by Wallis [7], the lift coefficient of cambered plates decreases with the decrease of Reynolds number. On the contrary, the drag coefficient of cambered plates increases with the decrease of Reynolds number. The underlying physics of these trends can qualitatively be explained, referring to Wallis [7], as follows. The variations with the Reynolds number are caused by thickening of the boundary layer with decreasing Reynolds number. The thickened boundary layer produces higher drag, and also decreases the effective camber, which results in lower lift. At sufficiently large Reynolds number, the
change of the lift and drag coefficients is negligible, and thus, they can be considered Reynolds number independent. Schmitz also found that for cambered plates a plateau appears in the drag coefficient between Re = 20 000 and Re = 60 000. This phenomenon did not appear for the lift coefficient however. The lift coefficient continued to decrease also below Re = 60 000.
The lift and drag coefficients and their ratio are important parameters to judge the aerodynamic performance of a blade section. However, the knowledge of the drag coefficient can also be utilized to estimate the frequency of profile vortex shedding, occurring on blades [8]. Vortex shedding noise has been identified by Dou et al. [9] as one of the primary noise source of small scale ventilating fans, and thus been the subject of recent research [9-11].
In this paper, lift and drag coefficient data on cambered plates with various relative camber, f/c are presented, based on results from the literature, supplemented with own measurements. An angle of attack range between 0° and 10° is chosen. The upper limit is in accordance with the region of maximum obtainable lift. The largest investigated relative camber was selected to be 8%, approximating a maximum in lift-to-drag ratio, in accordance with [7]. Empirical formulae are established herein to determine the lift and drag coefficients for a given relative camber, angle of attack and Reynolds number. The investigated Reynolds number range is between 60 000 and 300 000. To the authors’ best knowledge, no analytical or empirical model has been established in the literature until
now, for lift and drag coefficients at such Reynolds number range and blade geometries.
The authors wish to add to the open literature by providing empirical formulae, which are easily applicable in basic fan design [7, 12] for the determination of lift and drag coefficients.
2) INVESTIGATED CASES
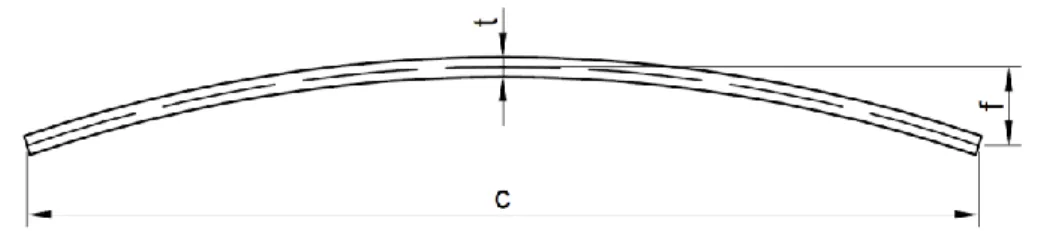
This paper focuses on cambered plates, with different relative cambers. Four relative cambers have been investigated, 0% - i.e. flat plate - , 4%, 6%, and 8%. The literature lacks a comprehensive study on the lift and drag coefficients of cambered plates at a wide range of Reynolds numbers. Data has been collected from various authors to examine the effect of Reynolds number, camber, and the angle of attack on the lift and drag coefficients. The most important geometrical parameters of cambered plates are represented in Figure 1, and the investigated cases are summarised in Table 1.
Figure 1. Cambered plate. c: chord, f: maximum camber, t: thickness
Wallis [7] reported measurements on plates with different relative cambers at Re = 300 000 and 600 000. Above Re = 300 000, the Reynolds number has only a minor effect on the lift and drag coefficients. Furthermore, results for higher Re values are widely
available in the literature. Thus the authors take only the data related to Re = 300 000 into account in the investigations presented herein. The measurement results are presented in Wallis [7] in a form eliminating the influence of the test rig and tunnel constraint, corrected to infinite span, i.e. for two-dimensional (2D) flow, based on the correction method presented in [13]. This makes these results suitable to be used as baseline data points. Data corrected to infinite span are utilised in preliminary design of fans, since the flow developing through the elemental blade cascades is assumed to be 2D [7, 12]. The measurement uncertainty for the results of Wallis [7] has been estimated by the authors to be approximately 0.02 and 0.002 for the lift and drag coefficients respectively, on the basis of the graphical representation of the data in [7].
Results on a cambered plate with 4% relative camber have been reported by Mueller [14]
at the conditions presented in Table 1. No correction to infinite span was made. The uncertainty of the measurements were determined by Mueller [14] to be approximately 6% to 7% for both the lift and drag coefficients.
Schmitz [6] made measurements on various profiles at a wide range of Reynolds numbers (Re = 20 000-168 000), which included a cambered plate with rounded leading and trailing edge, see Table 1. Compared to the previously discussed measurements of Wallis [7] and Mueller [14], the camber geometry used by Schmitz [6] differs from a circular arc shape. The maximum camber is reached at 40% chord, and its relative camber is 6%. The
measurement uncertainty has been estimated by the authors to be maximum 0.3%
and 1% for the lift and drag coefficients, respectively.
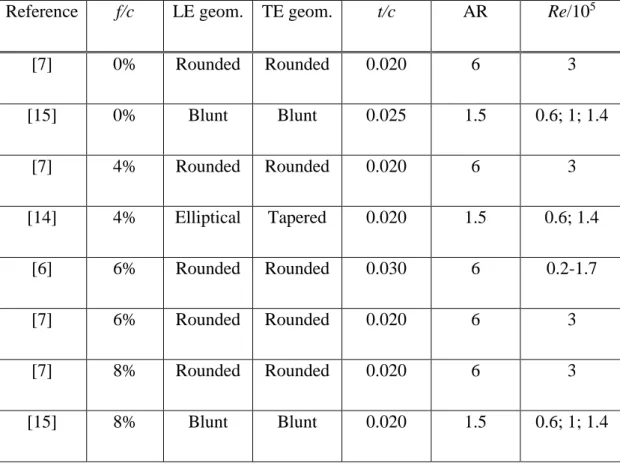
Table 1. Geometry and Reynolds number of the investigated cases
Reference f/c LE geom. TE geom. t/c AR Re/105
[7] 0% Rounded Rounded 0.020 6 3
[15] 0% Blunt Blunt 0.025 1.5 0.6; 1; 1.4
[7] 4% Rounded Rounded 0.020 6 3
[14] 4% Elliptical Tapered 0.020 1.5 0.6; 1.4
[6] 6% Rounded Rounded 0.030 6 0.2-1.7
[7] 6% Rounded Rounded 0.020 6 3
[7] 8% Rounded Rounded 0.020 6 3
[15] 8% Blunt Blunt 0.020 1.5 0.6; 1; 1.4
As supplement to the aforementioned literature data, measurements have been carried out in a wind tunnel at the Department of Fluid Mechanics, Faculty of Mechanical Engineering, Budapest University of Technology and Economics. The measurement setup is shown in Figure 2. The length and the width of the test section
is 1m, and the spanwise extension is 0.15m. At the inlet of the test section, the turbulence intensity is 0.8%. The dynamic pressure was measured using a Pitot- static tube. Load cells were used to measure the lift and drag forces. The inflow direction was determined with a three-hole probe. The angle of attack was defined as the angle between the inflow and the chord line. The angle of attack was set manually, with the use of a built-in protractor. The overall absolute measurement uncertainty was calculated to be ±7∙10-2 and ±2∙10-2 for the lift and drag coefficients, respectively. The measurement setup and the uncertainty calculations are described in more detail in [15]. A flat plate and a cambered plate with 8% relative camber were under investigation at three Reynolds numbers: 60 000, 100 000, and 140 000. The aspect ratio of the plates was 1.5. The leading and trailing edge of the plates were left blunt. The relative thickness was 2.5% and 2% for the flat and the cambered plate, respectively.
Figure 2. Measurement setup [15]. 1: Motor, 2: Frequency converter, 3: Radial fan, 4: Inlet bell mouth, 5: Guide vanes, 6: Flexible connector, 7: Split diffuser, 8: Honeycomb, 9: Turbulence reduction screens, 10: Transition element, 11: Closed test section
According to Hoerner [16], 1% change in the relative thickness causes less than 0.001 change in the lift coefficient values. Mueller [14] reported that the trailing edge geometry has a minor effect on thin profiles with a relative thickness below 6%. From the above, the authors concluded that the measurement results on cambered plates from various literature sources and on the own cambered plates can be compared with each other.
However the differences in the leading edge geometry should be kept in mind, and its effect should critically be viewed in evaluation of the results.
As already reported in [15], the endwall effect may have a significant impact on measurements in closed test section wind tunnels. Mueller [14] also found that the endwall effect may be notable for cambered plates at low Re values. The measurements of Wallis [7] have originally been corrected for three dimensional effects, while the results of Schmitz have been corrected (see the Acknowledgement) according to the principles established in [17]. The measurements of Mueller [14] and the own measurements were left uncorrected. The reason is the absence of a generally proven correction technique for measurements in which the wind tunnel sidewalls form endwalls with the tested model with practically zero gap. An attempt has been made during the processing of the measurement results to filter the data points affected by endwall effect out, which will be discussed in what follows.
3) RESULTS
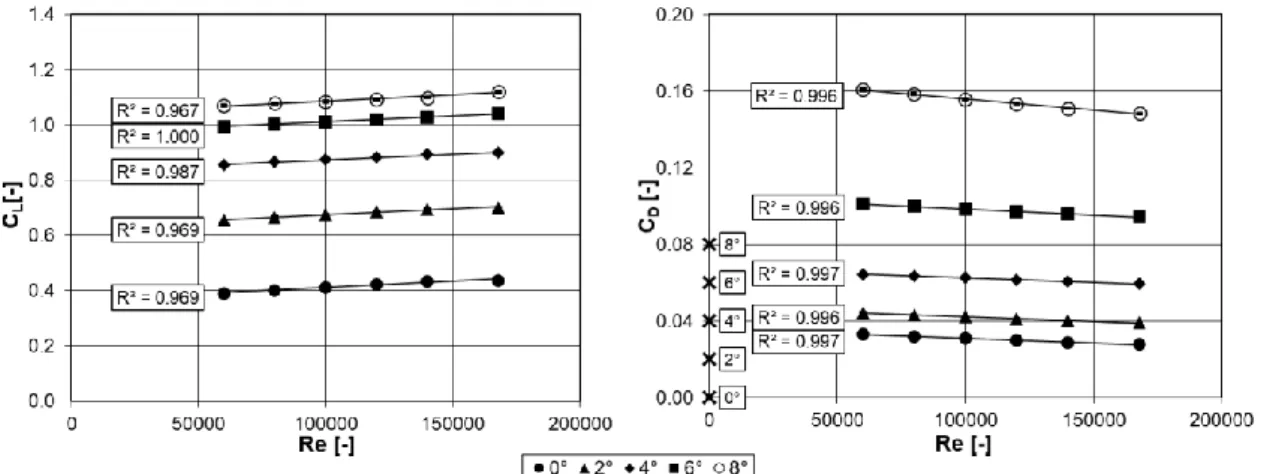
First, a linear trendline has been fitted to the measurements of Schmitz [6] between Re = 60 000 and 168 000 for both the lift and the drag coefficients, for α = 0° to 8°. The fits are shown in Figure 3. For better visibility, offset was applied to the origins of the drag coefficient for the different angles of attack. Each angle is offset by 0.02 compared to the previous one, α = 0° is not offset. The shifted origins are indicated on the vertical axis with black crosses, each labelled with the corresponding angle of attack. For all cases the determination coefficient, R2 was beyond 0.96. This confirms that within the presented Reynolds number range, the lift and drag coefficients follow a linear trend in case of a cambered plate. Thus, for cambered plates with other relative camber, linear trends were also searched for. According to Mueller [14] the endwall effect becomes more significant at lower Reynolds numbers, e.g. for the measurements at Re = 60 000.
Measurement points which are affected by the endwall effect the most, were filtered out by using the customised technique described as follows. The base of the filtering was the compliance with the linear trend.
Figure 3. Linear trendlines fitted to the lift and drag coefficients measured by Schmitz on a cambered plate (f/c = 6%). Black crosses, labelled with the angle of attack denote the offset origins
Linear trendlines have been fitted to the experimental result for each case with different relative camber and angle of attack. The measurements of Wallis [7] are considered to be accurate, as the three-dimensional flow effects due to the tip and to the proximity of the endwalls, being undesirable in judging the 2D performance of the blade, are fully eliminated by correcting to infinite span [13]. The importance of such 2D performance is emphasized as follows. The performance of blade sections is often considered in 2D approach in preliminary design of axial flow fans [7, 12]. Thus the trendlines have been fitted so that they fit to the measurement points of Wallis [7] at Re
= 300 000, termed as datum points. The method of least squares has been used for the best fit.
According to Mueller [14], endwall effect was assumed to be the most pronounced for the lowest measured Reynolds number, i.e. Re = 60 000. Based on this the filtering
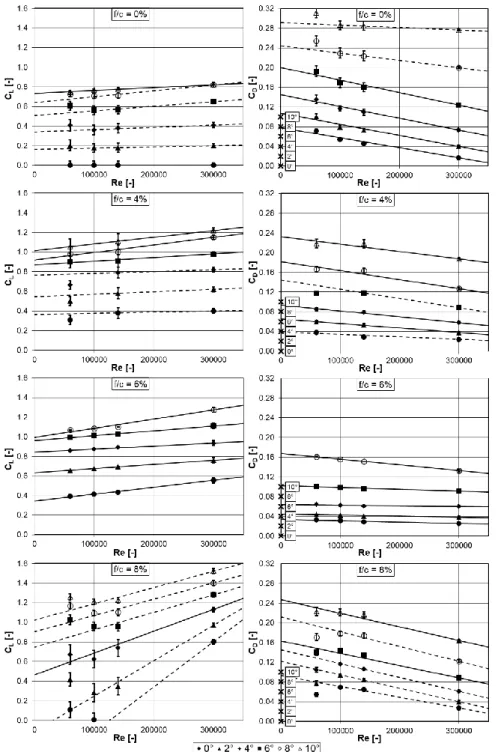
method established herein focuses on the Re = 60 000 points, which are most likely to be corrupted by the endwall effect. The filtering was applied to those results which were not corrected to infinite span previously, namely the Mueller [14] and own [15] cases (see Table 1). Two types of fit have been made, first the trendlines have been fitted to the data including the Re = 60 000 point. Another fit was made excluding the Re = 60 000 points as they are possibly affected by the endwall effect. R2 values have been determined for each case. A criterion of R2 ≥ 0.9 has been proven to be suitable for identification of the linear trend. During the determination of the criterion of R2 ≥ 0.9 the following aspects were considered: (a) the minimum obtained determination coefficient was R2 = 0.96 from the fits applied to the measurements of Schmitz, shown in Figure 3, (b) an increased data scatter was allowed corresponding to the experimental uncertainty of the own measurements. If the fit including the Re = 60 000 had an R2 ≥ 0.9, then the fit was considered satisfactory. If R2 was below 0.9 then the option (with or without Re = 60 000 point) with the better fit, i.e. higher R2, has been chosen. The results of the fitting are shown in Figure 4. Solid lines indicate those trendlines which include the Re = 60 000 point, and dashed lines indicate trendlines without the Re = 60 000 point. The same offset was applied to the origin of the drag coefficients, as in Figure 3. It can be seen that the linear trendline fits the measurement points within the measurement uncertainties, also indicated in Figure 4 with error bars. If the error bars are not visible, the size of the marker symbols correspond to the error. It can be concluded that despite the differences in the
leading edge geometry, the cases of various relative camber can be treated together empirically in a systematic manner.
Figure 4. Lift and drag coefficients for various relative cambers and angles of attack as a function of Reynolds number. Black crosses, labelled with the angle of attack denote the offset origins
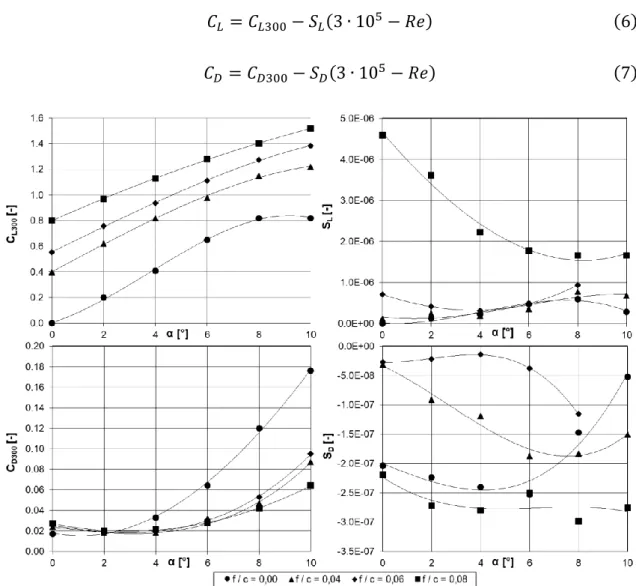
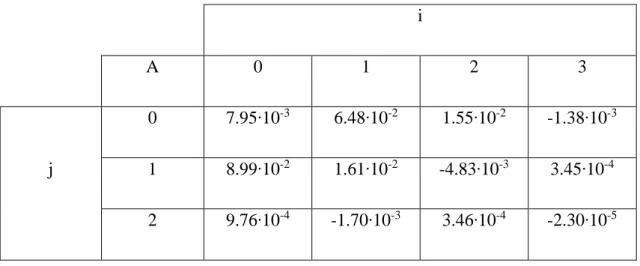
Each trendline is characterized by the datum point and its slope. The slopes and the datum points have been plotted as a function of angle of attack in Figure 5, in order to find a relation between them. To each case with different relative camber a third order polynomial has been fitted. For each coefficient of the third order polynomial a second order polynomial has been fitted to determine the dependence on the relative camber as well. The coefficients of the polynomials are summarized in Table 2-5, which contain the coefficients A-D of Equation (1)-(4), respectively. Thus the datum point and the slope can be determined using the coefficients of the fitted curves, the angle of attack, and the relative camber the following way:
𝐶𝐿300 = ∑ ∑ 𝐴𝑖𝑗(𝑓 𝑐)
𝑗
𝛼𝑖
2
𝑗=0 3
𝑖=0
(2)
𝑆𝐿 = ∑ ∑ 𝐵𝑖𝑗(𝑓 𝑐)
𝑗
𝛼𝑖
2
𝑗=0 3
𝑖=0
(3)
𝐶𝐷300 = ∑ ∑ 𝐶𝑖𝑗(𝑓 𝑐)
𝑗
𝛼𝑖
2
𝑗=0 3
𝑖=0
(4)
𝑆𝐷 = ∑ ∑ 𝐷𝑖𝑗(𝑓 𝑐)
𝑗
𝛼𝑖
2
𝑗=0 3
𝑖=0
(5)
Where CL300, SL, CD300 and SD stand for the lift coefficient datum point, slope and the drag coefficient datum point, slope respectively, f/c is in percent and α is in degrees. From the
datum points and the slopes the lift and drag coefficients for a given Re can be expressed as follows:
𝐶𝐿 = 𝐶𝐿300− 𝑆𝐿(3 ∙ 105− 𝑅𝑒) (6) 𝐶𝐷 = 𝐶𝐷300− 𝑆𝐷(3 ∙ 105− 𝑅𝑒) (7)
Figure 5. Lift and drag coefficient datum points and slopes for various relative cambers as a function of angle of attack. The fitted third order polynomials are indicated with the solid line
Table 2. Empirical coefficients for the datum point of the lift coefficient
i
A 0 1 2 3
j
0 7.95∙10-3 6.48∙10-2 1.55∙10-2 -1.38∙10-3 1 8.99∙10-2 1.61∙10-2 -4.83∙10-3 3.45∙10-4 2 9.76∙10-4 -1.70∙10-3 3.46∙10-4 -2.30∙10-5
Table 3. Empirical coefficients for the slope of the lift coefficient
i
B 0 1 2 3
j
0 1.03∙10-7 -5.40∙10-8 4.16∙10-8 -3.46∙10-9 1 -7.60∙10-7 9.32∙10-8 -5.61∙10-9 5.40∙10-10 2 1.62∙10-7 -2.13∙10-8 4.99∙10-10 5.77∙10-12
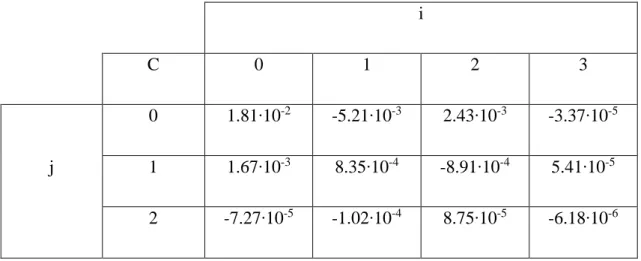
Table 4. Empirical coefficients for the datum point of the drag coefficient
i
C 0 1 2 3
j
0 1.81∙10-2 -5.21∙10-3 2.43∙10-3 -3.37∙10-5 1 1.67∙10-3 8.35∙10-4 -8.91∙10-4 5.41∙10-5 2 -7.27∙10-5 -1.02∙10-4 8.75∙10-5 -6.18∙10-6
Table 5. Empirical coefficients for the slope of the drag coefficient
i
D 0 1 2 3
j
0 -2.04∙10-7 -1.81∙10-8 -2.16∙10-10 3.66∙10-10 1 9.84∙10-8 4.72∙10-9 -1.23∙10-9 -6.05∙10-11 2 -1.24∙10-8 -6.74∙10-10 2.44∙10-10 -4.53∙10-12
4) UNCERTAINTY ANALYSIS
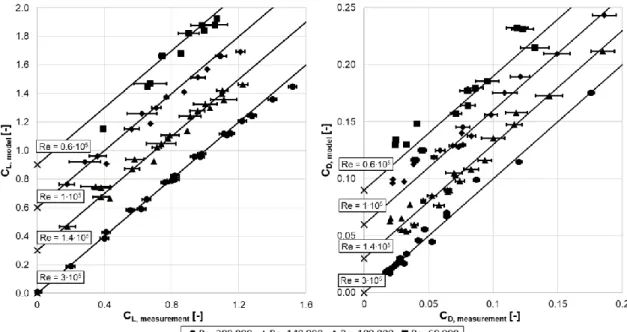
The measured and modelled lift and drag coefficient values are shown in Figure 6 for four different Reynolds numbers. For better visibility offset was applied to the origins, for
each Reynolds number except for Re = 300 000. For Re = 1.4∙105, 1∙105 and 0.6∙105, an offset of 0.3, 0.6 and 0.9 was applied respectively for the lift coefficients, and 0.03, 0.06 and 0.09 for the drag coefficients. The shifted origins are indicated on the vertical axis with black crosses, each labelled with the corresponding Reynolds number. Solid lines indicate the values corresponding to perfect match between the model and the measurement, i.e when the measured and modelled lift and drag coefficients would have the same values. The error bars indicate the measurement errors. If the error bars are not visible, the size of the marker symbols correspond to the error.
Figure 6. Measured and modelled lift and drag coefficients at Re = 0.6∙105, 1∙105, 1.4∙105 and 3∙105. Black crosses, labelled with the Reynolds number denote the offset origins
The signed relative discrepancy has been obtained for each data point in Figure 6 as the difference between the empirically estimated value and the measurement-based value, normalized by the measurement-based value. Statistical samples were generated from the signed relative discrepancy data for CL and CD, involving data representing the cases of circular arc camber line, with relative camber changing in uniform steps, i.e. f/c=0%, 4%
and 8%, over the entire Re and α values under discussion. The standard deviation of such a sample is considered as a single-value metric, quantifying the error of the empirical model presented herein. The uncorrected standard deviations of the aforementioned samples have been calculated to be 7% for CL and 11% for CD. These standard deviations include the following effects: measurement uncertainty, alterations in the leading edge geometry, approximation due to polynomial fitting.
5) SUMMARY
Based on own measurements and an extensive literature review a linear trend has been assumed for the lift and drag coefficients of cambered blade sections between Re= 60 000 and 300 000. In order to determine the values of the lift and drag coefficients as a function of the relative camber, the angle of attack and the Reynolds number, empirical polynomials have been proposed. The polynomials are presented in Equations (1)-(4), and the coefficients are summarized in Table 2-5.
In spite of the differences in the leading edge geometries, the fitted empirical polynomials estimate the lift and drag coefficients adequately, the investigated cases can be treated
together in a comprehensive approach. Although the f/c = 6% case [6] is of non-circular- arc camber geometry, it can be treated empirically together with the other cases in a systematic manner.
In the future, the results can also be utilized for aeroacoustic purposes. Utilizing the drag coefficient, the frequency of profile vortex shedding can be determined [8], and by means of supplementary phased array microphone measurements [18, 19], aeroacoustic phenomena can be investigated in detail.
FUNDING
This work has been supported by the Hungarian National Research, Development and Innovation Centre under contract No. K 129023. The research reported in this paper was supported by the Higher Education Excellence Program of the Ministry of Human Capacities in the frame of Water science & Disaster Prevention research area of Budapest University of Technology and Economics (BME FIKP-VÍZ) and by the National Research, Development and Innovation Fund (TUDFO/51757/2019-ITM, Thematic Excellence Program).
ACKNOWLEDGEMENT
Gratitude is expressed to Mr. Gábor Daku for processing the data of Schmitz [6] and applying the corrections established by Prandtl [17] to the measurement results. The processed data are shown in Figure 3.
CONFLICT OF INTEREST
The Authors declare that there is no conflict of interest.
REFERENCES
[1] Bian T, Shen X, Wang B, Feng J, Han Q. (2019). Numerical and experimental investigation of flow loss and flow structure of circular arc cambered plate blade cascade.
Proc IMechE, Part A: J Power and Energy 2019; Online first
[2] Vad J, Horváth Cs and Kovács JG. Aerodynamic andmaero-acoustic improvement of electric motor cooling equipment. Proc IMechE, Part A: J Power and Energy 2014;
228: 300–316.
[3] Borges SS. CFD techniques applied to axial fans design of electric motors. In:
Proceedings of the international conference on fan noise, technology and numerical methods (FAN2012), Senlis, France.
[4] Koning WJ, Johnson W, Grip HF. Improved Mars helicopter aerodynamic rotor model for comprehensive analyses. In: 44th European Rotorcraft Forum, Delft, Netherlands, 2018, pp. 1–14.
[5] McMasters J, Henderson M, Low-speed single-element airfoil synthesis.
Technical Soaring, vol. 6, no. 2, pp. 1–21, 1980
[6] Schmitz FW. Aerodynamics of the model airplane. Part 1 -Airfoil measurements, NASATMX60976, RSIC-721-PT-1, Huntsville, Alabama, 1967 (translated from German)
[7] Wallis RA. Axial flow fans. London: George Newnes Ltd., 1961.
[8] Balla E, Vad J. A semi-empirical modell for predicting the frequency of profile vortex shedding relevant to low-speed axial fan blade sections. In: Proceedings of 13th European conference on turbomachinery – Fluid dynamics and thermodynamics, Lausanne, Switzerland,8–12 April 2019
[9] Dou H, Li Z, Lin P, Wei Y, Chen Y, Cao W, He H. An improved prediction model of vortex shedding noise from blades of fans. Journal of Thermal Science 2016; 25(6) 526-531.
[10] Lee C, Chung MK, Kim YH. A prediction model for the vortex shedding noise from the wake of an airfoil or axial flow fan blades. Journal of Sound and Vibration 1993 164 (2) 327-336
[11] Sasaki S, Kodama Y, Hayashi H, Hatakeyama M. Influence of the Karman vortex street on the broadband noise generated from a multiblade fan. Journal of Thermal Science 2005 14(3) 198-205.
[12] Carolus T. Ventilatoren. Wiesbaden: B. G. Teubner Verlag. 2003
[13] Jacobs EN, Abbott IH. The NACA variable-density wind tunnel.Tech.Rep.416.
NACA 1933
[14] Mueller TJ. Aerodynamic measurements at low Reynolds numbers for fixed wing micro-air vehicles. In: RTO AVT/VKI special course on development and operation of
UAVs for military and civil applications, 13–17 September 1999. Belgium: Von Karman Institute for Fluid Dynamics.
[15] Balla E, Vad J. Lift and drag force measurements on basic models of low-speed axial fan blade sections, Proc IMechE, Part A: J Power and Energy 2019 233(2) 165- 175.
[16] Hoerner SF. Fluid-dynamic lift. 2nd ed. Bricktown, New Jersey, USA: Hoerner Fluid Dynamics, 1992.
[17] Prandtl, L., Ergebnisse der Aerodynamischen Versuchsanstalt zu Goettingen (Findings of the Aerodynamic Research Laboratory at Goettingen), 4th ed. R.
Oldenhourg, Munich, 1932.
[18] Balla E., Vad J. Establishment of a beamforming dataset on basic models of low-speed axial fan blade sections, Periodica Polytechnica, Mechanical Engineering, 2017 61(2) 122-129
[19] Tóth B., Vad J., Kotán G. Comparison of the rotating source identifier and the virtual rotating array method, Periodica Polytechnica Mechanical Engineering, 2018 62(4) 261-268.
![Figure 2. Measurement setup [15]. 1: Motor, 2: Frequency converter, 3: Radial fan, 4: Inlet bell mouth, 5: Guide vanes, 6: Flexible connector, 7: Split diffuser, 8: Honeycomb, 9: Turbulence reduction screens, 10: Transition el](https://thumb-eu.123doks.com/thumbv2/9dokorg/733371.29393/9.892.218.677.723.905/measurement-frequency-converter-flexible-connector-honeycomb-turbulence-transition.webp)