13th Alps-Adria Scientific Workshop Villach, Ossiacher See – Austria – 2014
1
CORRELATION BETWEEN LIME CONTENT AND HYPERSPECTRAL PROPERTIES OF SOILS
Imre Tibor TOLNER
1– Miklós NEMÉNYI
1– László FENYVES I
2– Kornél D SZALAY
2– György FÜLEKY
31 Faculty of Agricultural and Food Science, University of West Hungary, H-9200 Vár 2, Mosonmagyaróvár , Hungary, tolner.imre@mtk.nyme.hu
2 Hungarian Institute of Agricultural Engineering
3 Departmentof Soil Science and Agricultural Chemistry, Institute of Environmental Science, Faculty of Agricultural and Environmental Science, Szent István University
Abstract:
Soil properties necessary for precision soil cultivation can be determined and monitored by remote sensing.
The successful application of measured information needs a well-defined correlation between the traditional soil measurements and the data measured with optical sensors. To determine these relationships one has to use the typical soils of the studied area (Hungary). In this work we use 18 soils of the Hungarian Soil Bank - collected by Füleky in 1978 from different parts of the country. The Soil Bank consist of soil samples with different clay particles (soil texture) , pH, CaCO3 content, humus content, , etc.
The ASD FieldSpec ® 3 Max portable spectroradiometer of the Hungarian Institute of Agricultural Engineering was used between 350 nm and 2500 nm of wavelength to determine the reflection spectra of soil samples. The relationships between chemical and physical properties of air dry and absolute dry soil samples were determined. There was a strong exponential relationship between the magnitude of the adsorption peaks near 1900 nm characteristic to OH groups and the lime content of the soils.
Keywords: remote sensing, hyperspectral, precision soil cultivation, lime content, Soil Bank
Introduction
As the practice of precision agriculture spreads the development of examination methods based on remote sensing applications become more and more important.
Especially remarkable is to know the soil acidity or its lime content (Vágó et al., 2008;
Tolner et al. 2008). Soil features - physical processes, chemical and biological changes - affect the optical characteristic of soil surface. Changes can be effectively detected by means of remote sensing applications.
The airborne hyperspectral sensor system – AISA DUAL – operated jointly by the University of Debrecen and the Hungarian Institute of Agricultural Engineering and the portable spectroradiometer –ASD FieldSpec
®3 Max – operated by the Hungarian Institute of Agricultural Engineering make possible to gather information of large areas.
The detected range of the ASD equipment covers the electromagnetic radiation between 350 to 2500 nm.
Chang et al. (2005) examined the correlation based on 400 soil samples. Calibrations were based on partial least-squares regression (PLSR), using the first differentials of log (1/R) for the 1100 to 2500-nm spectral range. The results for the calibration set and validation set indicated that NIRS-PLSR was able to predict many soil properties (total C, organic C, inorganic C, total N, CEC, % clay, and moisture) with reasonable accuracy for both the air dry (R
2> 0.76) and moist (R
2> 0.74) soils.
In this and in our previous studies we have not been working on calibration models
which can be gained by mathematical statistical methods but took up the question of
clarifying the reasons of phenomena. Soils which contain CaCl
2- which is one main
Vol. 63. 2014. Suppl Növénytermelés
2
characteristic of acid soils – we experienced decisive differences in absorption maximum in the wavelength range of 1900 to 2000 nm at variously dried soil samples (Tolner et al., 2012).
During our former test in case of soil samples with various pH levels – which was set by different hydrochloric acid treatment - we experienced changes in hygroscopic feature of soil (Tolner et al., 2012). The moisture content of soil affects decisively the reflection spectrum (Neményi, 2008; Milics, 2004), thus special attention was paid to the drying process.
In this experiment we study the effect of moisture content, water retention property (hy) and lime content of soil on the NIR reflection spectra.
Materials and methods
The successful application of measured information needs a good correlation between the traditional soil measurements (Buzás, 1988) and the data measured with optical sensors. To determine these relationships one has to use the typical soils of the studied area (Hungary). In this work we use 18 soils (Table 1.) of the Hungarian Soil Bank (Füleky, 1987), collected from different parts of the country.
Table 1. 18 soil from the Hungarian Soil Bank (KA: soil plasticity index, y1: hydrolytic acidity, hy: water retention property)
Code Locality Soil type pH(H2O) pH(KCl) CaCO3% y1 humus% KA hy
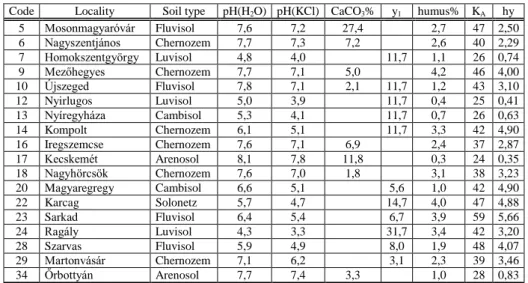
5 Mosonmagyaróvár Fluvisol 7,6 7,2 27,4 2,7 47 2,50
6 Nagyszentjános Chernozem 7,7 7,3 7,2 2,6 40 2,29
7 Homokszentgyörgy Luvisol 4,8 4,0 11,7 1,1 26 0,74
9 Mezőhegyes Chernozem 7,7 7,1 5,0 4,2 46 4,00
10 Újszeged Fluvisol 7,8 7,1 2,1 11,7 1,2 43 3,10
12 Nyirlugos Luvisol 5,0 3,9 11,7 0,4 25 0,41
13 Nyíregyháza Cambisol 5,3 4,1 11,7 0,7 26 0,63
14 Kompolt Chernozem 6,1 5,1 11,7 3,3 42 4,90
16 Iregszemcse Chernozem 7,6 7,1 6,9 2,4 37 2,87
17 Kecskemét Arenosol 8,1 7,8 11,8 0,3 24 0,35
18 Nagyhörcsök Chernozem 7,6 7,0 1,8 3,1 38 3,23
20 Magyaregregy Cambisol 6,6 5,1 5,6 1,0 42 4,90
22 Karcag Solonetz 5,7 4,7 14,7 4,0 47 4,88
23 Sarkad Fluvisol 6,4 5,4 6,7 3,9 59 5,66
24 Ragály Luvisol 4,3 3,3 31,7 3,4 42 3,20
28 Szarvas Fluvisol 5,9 4,9 8,0 1,9 48 4,07
29 Martonvásár Chernozem 7,1 6,2 3,1 2,3 39 3,46
34 Őrbottyán Arenosol 7,7 7,4 3,3 1,0 28 0,83
The Soil Bank has complete information registered of each samples’ clay mineralogy, pH, CaCO
3content, humus content, texture, etc. The ASD FieldSpec ® 3 Max portable spectroradiometer of the Hungarian Institute of Agricultural Engineering was used between 350 nm and 2500 nm to determine the reflection spectra of soil samples.
Spectra of absolute dry samples (DR) – dried on 105C° - and air dry samples (LW) –
moisture content in balance with the air humidity - were collected. Processing of the
spectra was performed after continuum removal.
13th Alps-Adria Scientific Workshop Villach, Ossiacher See – Austria – 2014
3
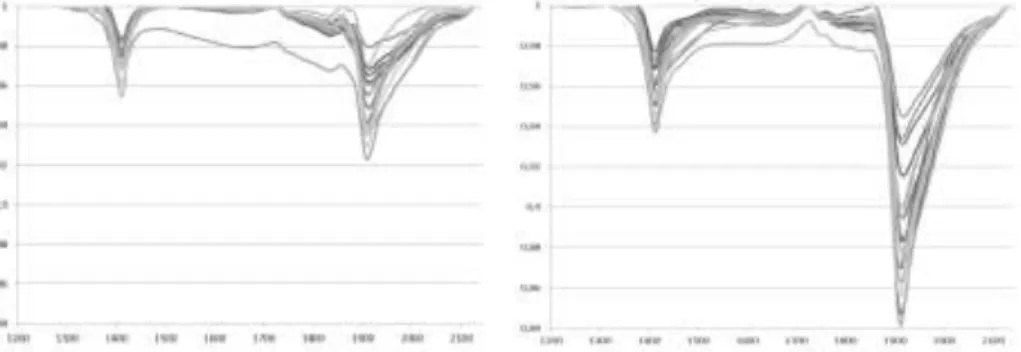
Results and discussionThe spectral deviation of soil spectra was mainly caused by the different moisture content. On Figure 1. The result of continuum removed spectra of absolute dry (DR) samples (left) and the result of air dry (LW) continuum removed spectra are presented (right).
Figure 1. The hyperspectral spectra of examined soil samples in absolute dry (left, DR) and air dry (right, LW) state
The biggest absorption peaks were measured at the wavelength range of 1410 and 1910 nm. Peaks measured at 1910 nm showed the highest differences based on the two levels (DR, LW) of moisture content. In Table 2. the exact locations of absorption peaks (DR nm, LW nm) and the absorption intensities (DR I and LW I) are presented.
Table 2. Wavelengths of absorption maxima in absolute dry (DR nm) and air dry (LW nm) states and the pertaining absorption maxima (DR I, LW I). LW-DR values are the differences between absorption maxima
of air dry and absolute dry states.
Code DR nm DR I LW nm LW I LW-DR pH KCl CaCO3% KA hy 5 1913 0,9654 1915 0,9314 0,0340 7,2 27,4 47 2,50 6 1915 0,9685 1917 0,9154 0,0531 7,3 7,2 40 2,29
7 1913 0,9796 1917 0,9450 0,0346 4,0 26 0,74
9 1915 0,8829 7,1 5,0 46 4,00
10 1910 0,9417 1911 0,8696 0,0721 7,1 2,1 43 3,10
12 1914 0,9620 1915 0,9343 0,0277 3,9 25 0,41
13 1914 0,9607 1917 0,8840 0,0767 4,1 26 0,63
14 1911 0,9416 1913 0,8469 0,0947 5,1 42 4,90
16 1911 0,9556 1914 0,9000 0,0556 7,1 6,9 37 2,87 17 1914 0,9382 1916 0,8944 0,0438 7,8 11,8 24 0,35 18 1913 0,9487 1915 0,8784 0,0703 7,0 1,8 38 3,23
20 1910 0,9229 1912 0,8411 0,0818 5,1 42 4,90
22 1913 0,9550 4,7 47 4,88
23 1910 0,9352 1911 0,8423 0,0929 5,4 59 5,66
24 1911 0,9703 1914 0,8943 0,0760 3,3 42 3,20
28 1909 0,9290 1911 0,8557 0,0733 4,9 48 4,07
29 1910 0,9427 1912 0,8627 0,0800 6,2 39 3,46
34 1913 0,9401 1916 0,8774 0,0627 7,4 3,3 28 0,83
Differences between the maximum absorption intensity of air dry and absolute dry
samples were calculated (LW-DR). We examined the correlation between the
Vol. 63. 2014. Suppl Növénytermelés
4
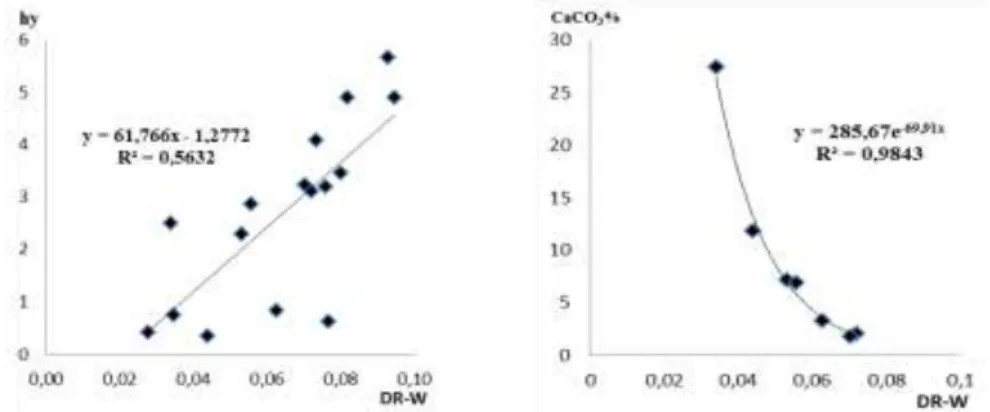
absorption intensity differences (LW-DR ) and soil features. The most notable correlations were received in case of hygroscopic value (hy) and lime content (CaCO
3%) (Figure 3.).
Figure 2. The correlation between the absorption intensity differences (LW-DR) and hygroscopic value (hy) and lime (CaCO3%) content of samples
Conclusions
The maximum absorption intensity differences of air dry and absolute dry states (LW- RD) showed linear correlation with hygroscopic value (hy) and strong exponential correlation with lime (CaCO
3%) content.
Acknowledgements
Tibor Imre Tolner’s research and the resulted publications were founded within the framework of TÁMOP-4.2.4.A/2-11/1-2012-0001 Project. (Project title: „National Excellence Programme – Convergence programme for the development and actuation of the personal supporting system for Hungarian students and researchers”). The project was supported by the European Union and co-financed by the European Social Fund.
References
Buzás I.: 1988. Talaj és agrokémiai vizsgálati módszerkönyv 2. Mezőgazdasági Kiadó, Budapest, 244 p.
Chang C.W. - Laird D.A. - Hurburgh G.R.: 2005. Influence of soil moisture on near-infrared reflectance spectroscopic measurement of soil properties. Soil Sci. 170: 244–255.
Füleky Gy.: 1987. Potassium supply in typical soils os Hungary. Bulletin of the Szent István University Gödöllő 113-119.
Neményi M. - Milics G. - Mesterházi P.Á.: 2008. The role of the frequency of soil parameter database collection with special regard to on-line soil compaction measurement. In: Andrea Formato: Advence in Soil & Tillage Research. pp. 125-140. ISBN 978-81-7895-353-3
Tolner I.T. - Tolner L. - Milics G. - Deákvári J. - Fenyvesi L. - Neményi M.: 2012. Talaj pH meghatározás hiperspektrális módszerekkel. Óvári Tudományos Napok, Mosonmagyaróvár, 2012.10.05.
Tolner L. - Vágó I. - Czinkota I. - Rékási M. - Kovács Z.: 2008. Field testing of new, more efficient liming method. Cereal Res. Commun. 36: 543 - 543.
Vágó I. - Tolner L. - Eichler-Löbermann B. - Czinkota I. - Kovács B.: 2008. Long-term effects of liming on the dry matter production and chemical composition of perennial ryegrass (Lolium perenne L.). Cereal Res. Commun. 36: 103 - 106.