CORVINUS UNIVERSITY OF BUDAPEST FACULTY OF FOOD SCIENCE
OPTIMIZATION OF FOOD LOGISTIC PROCESSES BY SIMULATION
TECHNIQUE
Éva Hajnal
THESES OF THE DOCTORAL DISSERTATION
Budapest
2007
PhD School/Program
Name: PhD School of Food Science Field: Food Science
Head: Prof. Péter Fodor
Department of Applied Chemistry Faculty of Food Science
Corvinus University of Budapest
Supervisor: Prof. Gábor Kollár
Department of Post-Harvest Faculty of Food Science Corvinus University of Budapest
The applicant met the requirement of the PhD regulations of the Corvinus University of Budapest and the thesis is accepted for the defence process.
……….………. .………...
Signature of Head of School Signature of Supervisor
2 Background and objectives of the research
Nowadays consumers pay more and more attention to the quality and safety of the food they consume as well as to the availability of relevant information. While on the part of the managements it is a discovery of vital importance that the quality of goods and services can only be ensured by suitably designed processes. In order to achieve the necessary efficiency of food distribution those processes need to be elaborated and operated in an optimal way.
One way of optimizing processes may be the application of such elaborated and standardized methods like statistics-based sample taking and/or the use of decision-making supporting systems that help reduce the uncertainty of decision-making by providing quick and precise information. Simulation techniques may be such a tool. For the past three decades the application of simulation methods have quickly spread in the fields of the optimisation of production and logistics processes. However, in the food sector this tool is just rarely applied;
mostly only in the case of investments or before major projects although well built, verified and validated models can greatly facilitate decision-makers' jobs also in daily decision making situations. By evaluating the alternative scenarios the right operative decisions can be made taking also their environmental aspects into consideration. At the same time, process simulation models can decrease the costs of support for decision-making as well.
It is in the basic interest of all actors of the food distribution chain that the inventory management should be of a high standard, so that the goods reaching the customers will always be of a good quality and the owners of the products will have to discard as little amount of unsold goods as possible. Optimal inventory management is supposed to be guaranteed also by the various pre-delivery organising methods (FIFO, FEFO, LIFO etc.). In the case of food continuous monitoring of self life would also be of vital importance in order to achieve genuine quality controlled logistics.
I carried out my research in two fields; one of them was the applicability of the statistics-based sample taking, while the other one was process simulation. For the investigation of the latter I built three simulation models, two of which were exclusively based on the inner processes of the distribution centre studied by me, while the third one demonstrates the distribution chain of a particular frozen fruit all the way from processing until dispatch from the distribution centre.
3 The main objectives of my research
In the course of my work I tried to answer the following questions:
Can total inspection at the end of the pre-delivery marshalling process be replaced by some standard, statistics-based sample taking method of inspection in the case of very strict customer requirements?
• Is simulation technique suitable as a tool of supporting decision-making in daily operative situations in the case of food distribution centres in order to reduce the uncertainty of decision-making? Could it help managers revise their decisions also on the grounds of the effects they may have on the environment?
• Is the simulation software which I have used (Extend) appropriate for solving resources optimization problems compared to our program written for Matlab and in the Visual Basic for Excel language -which in the case of a given problem uses only the necessary numerical approximations?
• What is the model that can visualize the way shelf life diminishes as the goods move along the distribution chain in the case of a seasonally grown but continuously marketed frozen food (strawberry) like? How great is the consumed shelf life in the cases of certain set model parameters?
• Is there a pre-delivery organisation rule which could ensure not only that the goods reach the customers in an appropriate quality but also allow the owner of the goods to manage their inventory in a more favourable way? Concerning this question I studied the following points:
What equation can describe the relationship between shelf life and temperature in the case of deep-frozen strawberries?
Is there a significant difference concerning the consumed shelf life (∑fcon) of different pallets of deep-frozen strawberries regarding the period of time examined depending on whether we choose the conventional FIFO/FEFO pre-delivery organising rules or the DEFO (Dynamic Expiry First Out) rule, which was introduced by me?
Materials and methods
During my research my only focus was the distribution logistics in a distribution centre that operates in three temperature ranges. In the ambient goods section foodstuffs that do not need refrigeration (AMB) are stored and handled; apart from that there is also a chilled (CHL) and a deep-frozen (FRZ) storage area. The centre is unimodal; the goods are transported by lorries.
Inspection by sample-taking
My first area of research was the applicability of inspection by sample taking. As a basis for that I used the ISO 2859-0 and 2859-1 standards, and I carried out the analysis in the distribution centre of my investigation using historical data. The basis of sample taking was the goods made ready and waiting for delivery here; they conventionally undergo a final 100%
inspection. The purpose of that is to make sure that customers get exactly prepared deliveries and to be able to assess staff performance. From the point of view of sample taking it is very important that there are two processes of getting the goods ready for dispatch: one operating on paper basis and a modern one with a radio frequency system.
A stack is considered faulty if it does not comply with the requirements. During my investigations I concentrated on non-conformity in quality (damaged outer carton) but especially in quantity.
Process simulation
The second field of my research was the investigation of the applicability of process simulation;
firstly regarding the intake process of the distribution centre of my research and then analysing a section of the distribution chain of a particular product. For the examination I chose processes which had already become steady in time. The investigation of behaviour in temporary periods of 'building-up' or disturbances was not within the scope of the present dissertation; they may be the basis of future research.
The performance of a given process was established with the help of performance indicators typical of it. In the course of my investigations such performance indicators were the cycle time, waiting time, queue length, labour intensity, operation cost and remaining shelf life.
During the modelling of the process it was one of my important tasks to choose the right level of the model.
process simulation software developed by Gedeon Almásy for MATLAB. We created a simplified version of the latter in the Visual Basic for Excel language.
In the case of the queuing model I analysed the arrival and unloading of the lorries at the warehouse as well as the time they spent waiting before that. I examined two alternative solutions (var1, var2). In the first model a given type of goods was allowed to be unloaded only at docks originally meant for them while in the other one rerouting was also possible –of course- with the observation of some priority rules. The input data of the model are shown in Table 1.
That is a typical queuing problem but on the basis of the input data it is impossible to decide which will be the more efficient scenario, although it may be of great significance from the point of view of operation organisation.
The question to be answered with the help of the queuing model is the following:
Does the fact that dry goods lorries are allowed to be unloaded at the free refrigerated docks have an effect on their waiting time and the length of the queue?
In the case of the resources model I modelled also the arrival of goods, but this time only at the docks of the dry goods section of the warehouse. I examined the amount of human resources needed for the performance of the above job if we keep the given priority rules. I built a model that calculates the number of warehouse staff with optimization according to the objective function given by me. The input data of the model are shown in Table 1.
The objective function given for the optimization takes the maximisation of profits as its base:
MaxProfit =
IPP*InPalNum-cWHK*WHKnum-cRTD*RTDnum-csPPTD*PPTDnum where
IPP income by pallets
InPalNum number of pallets loaded into the warehouse cWHK cost of one warehouse keeper
WHKnum number of warehouse keepers cRTD cost of one reach truck driver RTDnum number of reach truck drivers cPPTD cost of one pedestrian pallet truck driver PPTDnum number of pedestrian pallet truck drivers.
6
The questions to be answered with the help of the resources model are the following:
Can the right scheduling of human resources solve the problem of queuing at the dry goods docks without having to redirect the lorries to the refrigerated docks?
Does the running of the model built by the simulation software together with the optimising algorithm embedded in the software give sufficiently precise results?
Can this function of the software be used in everyday operation?
The basis of the supply chain model is the Time-Temperature-Tolerance model, which assumes that if the temperature history of a given product is known, the proportion of the shelf life that has been consumed up to a given point in time (fcon) equals the time spent in each temperature zone (ti) divided by the self life associated with the given temperature (θi).
fcon= ∑(ti / θi)
My goal was to calculate the shelf life consumed up to the time of dispatch from the central warehouse in the cases of different model parameters and to find out whether it is worth arranging the pallets prior the delivery according to the ∑fcon values instead of the conventional FIFO/FEFO rule of organisation. I named the queue processing technique based on ∑fcon values DEFO. It takes the real stress undergone by the food products into account and it keeps changing until the time of the final arrangement. As the basis of my analysis I selected deep frozen strawberries because the published data necessary for analysis were available for that product.
The question to be answered with the help of the distribution chain model is the following:
Are there any anomalies –examining the distribution chain- concerning the handling of certain pallets up to the time of dispatch from the central warehouse that result in significant differences between the two investigated model scenarios (FIFO and DEFO) on the basis of the
∑fcon values of the lots to be delivered at a given level of probability?
I built the model only with the Extend simulation software, which is better suited for use in an industrial environment. I worked with effective temperatures during my analysis. The temperature data I set in the three series of runs were the following:
1. Teff_transport= -18ºC, Teff_intake = 5ºC, Teff_storing = -20ºC 2. Teff_transport= -18ºC, Teff_intake = 5ºC, Teff_storing = -18ºC 3. Teff_transport= -18ºC, Teff_intake = 15ºC, Teff_storing = -20ºC
7
I determined the arrival and the dispatch according to previously defined patterns. The input data are shown in Table 1.
Table 1: Input data of the examined models Queuing
model
Resources model Distribution chain model Model type discrete,
stochastic
discrete, stochastic discrete, stochastic Mode of
analysis
scenario analysis
optimization scenario analysis Storing
information
attribute no attribute database
Entities lorries lorries, pallets lorries, pallets Type of
foodstuff
AMB, CHL and FRZ
AMB FRZ
Arrival exponential distribution (mean 5 min)
the same as in the queuing model
according to harvesting pattern
Starting event arrival of lorries at the warehouse
arrival of lorries at the warehouse
departure of lorries from freezing plant Final event storage on
racks
storage on racks dispatch from warehouse Time needed
for the operation
Loading into warehouse: 50 min/lorry
unloading: 90, administration: 15, intake: 90 min/(lorry/worker)
incoming delivery:
normal distr., mean 1 hour, SD 20 min, intake:
normal distr. mean: 3 min/pallet, SD 0.5 min Number of
docks
5-5-5 5 1
Resources unlimited to be optimized unlimited Length of run 24 hours 24 hours 1 year Number of
runs
4 according to
convergence
4 Objective
function
none yes none
The summary of the results
For the examination of the applicability of statistics-based, sample taking inspection I determined the type and strictness of the inspection plan and the number of the stages of sample taking in advance (type of inspection plan), while the value of the acceptable quality level (AQL) was agreed on with the customer. During the analysis, which was carried out with historical data I found that we could save around 80% of the total time of the regular pre- delivery inspections, if we applied the method described in ISO 2859 standard.
In the case I examined, the key performance indicator –from which the AQL is calculated- was so strict, that only a great number of samples could ensure an appropriate ability to discriminate between lots of good and bad quality. In that case, however, the homogeneity of the samples cannot be guaranteed and a whole lot cannot be hold back until the end of the examination, either. On the other hand, this method may be appropriate in the case of the inspection of incoming deliveries to the warehouse or even in the case of pre-delivery inspection at other warehouses if the other conditions are met.
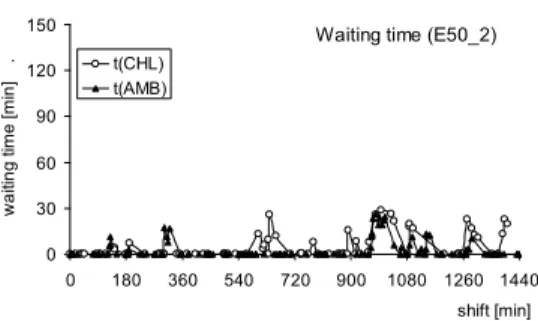
In the case of the queuing model I chose settings in which it was unpredictable which of the two inspected scenarios would be more appropriate, but after running the model it became clear at once. In the first version of the model the length of the queue and the waiting time started to increase during the last third of the 24-hour shift with lorries that had not been served remaining in the queue. The level of utilisation of the docks levelled off in the second version, and both the average and maximum waiting times decreased as well (Figure 1). The summary of the results of all the runs is shown in Table 2.
Waiting time (E50_1)
0 30 60 90 120 150
0 180 360 540 720 900 1080 1260 1440 shift [min]
waiting time [min] . t(CHL) t(AMB)
Waiting time (E50_2)
0 30 60 90 120 150
0 180 360 540 720 900 1080 1260 1440 shift [min]
waiting time [min] . t(CHL) t(AMB)
Figure 1: Waiting time results for the queuing models Var1 (E50_1) and Var2 (E50_2) Table 2: Numeric results of the runs of the two versions of the queuing model (runs 1-4)
Run Lorry AMB CHL FRZ Total
Level of utilisation(AC)%
1 arrived 136 84 44 264
Intake v1 125 82 44 251 94%
Intake v2 132 81 44 257 97%
2 arrived 143 89 48 280
Intake v1 137 88 47 272 97%
Intake v2 138 87 47 272 97%
3 arrived 147 93 48 288
Intake v1 138 92 48 278 96%
Intake v2 143 92 48 283 98%
4 arrived 156 94 53 303
Intake v1 137 93 50 280 92%
Intake v2 150 93 50 293 97%
I observed that in the case of my queuing model the Extend software could effectively give the same result as the Almásy program. Sop, the Extend software can be used to solve daily queuing problems also in other distribution centres, provided the processes are the same in the other distribution centres as in the one I investigated. The generalization is also true when the monitoring system is case- rather than pallet-based, because the software can handle both.
In the case of the resources model I examined which combination of the resources ensures the
10
results as our control Almásy program even after numerous runs; the optimization block mostly found only local maximums.
Table 3 compares the numerical results of the Extend and Almásy models.
Table 3: results of the Almásy Extend models arrived
(#lorries)
received (#lorries)
WHK (pers)
RTD (pers)
PPTD (pers)
MaxProfit (HUF)
Almásy 135 135 2 9,5 9 858 340
Extend 135 133 2 11 11 819 500
In the case of the Almásy model we also allowed 4-hour shifts during the simulation, and the model counted among the received lorries also the ones that had arrived at the end of the 8-hour shift and had already docked in, while Extend put them with the cycle of the following day.
Even if we unify these data (133 received lorries, only 8-hour shifts), we will still find that the Almásy model solves this problem more efficiently (Almásy's corrected MaxProfit= HUF 839500).
According to my observations the simulation software effectively provides solutions for queuing problems, does scenario and sensitivity analysis as well as Monte Carlo simulation, but in the case of optimization additional analyses are necessary, too. We can generalize the resources optimization results to other optimization problems but –of course- not to other simulation software, since their optimization algorithms might work in a different way. The investigation of that was not a goal of the present dissertation.
Naturally, the numerical results which I got from the experiments with the models are only valid for distribution centres whose processes and their parameters are the same as those of the centre examined by me. In case of any differences, we can only get exact results either by changing the parameters or by building a new model as described above. It is very important that the processes of the distribution centre should be controlled and there should be exact and reliable data available for the analysis.
With the distribution chain model I modelled the quality deterioration by attaching to each pallet changing attributes, which sum the fcon values at different stages of the distribution chain. One scenario of the model identifies pallets to be dispatched according to their SKU values (FIFO rule, lower first), while the other scenario selects the pallets with the highest
11
values according to their current Σfcon values before the delivery (higher first). I named the latter method DEFO (Dynamic Expiry First Out). For the model I applied Just-in-time inbound delivery and defined the relationship between temperatures and shelf life based on experimental results in the scientific literature. The equation and parameters of the adjusted function are the following (R2=0.9996):
θ(T)=(A T2 + B T + C) ekT
A=0.01026; C=8.32861
B=0.58124; k= - 0.326454
The model uses this function and calculates with times spent at different stages of the distribution chain, and with temperatures in these stages.Its structure is very complicated; it contains hierarchical blocks at three levels(figure 2).
production deliv ery
A
∆ Get
Statistics
orders
transport intake
storage
Figure 2: The hierarchical version of the distribution chain model
With the model I investigated three sorts of input data systems. The first set of parameters is typical of normal operation. According to my results the consumed shelf-life until delivery averaged 33% with the minimum and maximum values of 4% and 61%, respectively. This experiment shows that complying with the rules there is practically hardly any difference in results when using either the FIFO or the DEFO organising principles.
In the case of the second set of parameters, when the storage temperature is -18ºC (it is still acceptable) the average consumed shelf life reaches 43% with minimum and maximum values of 6% and 79% respectively. That means that if we applied the rule (which numerous manufacturers actually do) of retaining pallets which have reached 70% of their shelf-life, a significant number of the pallets would get stuck in the warehouse. In these cases the two scenarios of the model gave practically the same results.
In the case of the third set of parameters, when the intake temperature is increased to 15ºC there is a major difference between the FIFO and the DEFO methods. The average consumed shelf-
life jumps to 54% but while FIFO shows minimum and maximum values of 5% and 102% (std.
deviation 19%) respectively, DEFO shows minimum and maximum values of only 45% and 63% (std. deviation 4%) respectively, i.e. there are products in the stock that are already expired In the case of FIFO the number of pallets with fcon values of over 70% varied between 214 and 227 in the different runs. That means that applying the DEFO method an appropriate product quality can be ensured even under the circumstances where it is impossible with the FIFO method. It is important to note that without this kind of analysis these facts never become known; the lots are all dispatched because the products are still not expired according to the best-before date printed on their packaging. I am of the opinion that this method would mean real quality control in logistics.
The application of this method requires two conditions to be met. The first one is the availability of the appropriate temperature-shelf life data of the examined frozen foodstuff.
These data –of course vary depending on the products and the processing and packaging technologies.
The other condition is that the necessary time and temperature data have to be reliably precise and always available throughout the distribution chain, especially in the distribution centre. The latter condition is much easier to fulfil where there is already a working radio frequency system in the warehouse. But enforcing the well defined processes of operation is very important also in this case. There is, however, need for further research in this field, for example, in order to find out how -beside the packaging method- the palletisation technology can affect the temperature-shelf life plots, or to find out what corrections need to be made in the cases of inner and outer cartons on the same pallet.
Newly achieved scientific results
I have proved that due to the extremely strict customer requirements in the distribution centre that I investigated the statistics-based, sample-taking method of pre-delivery inspection cannot be applied.
I have verified that the simulation technique is appropriate as a tool for supporting decision-making in food logistics -even in daily operational situations- in order to
With the help of our program written for Matlab and in the Visual Basic for Excel language I have demonstrated that the applied simulation software effectively solved queuing problems and did scenario analysis or Monte Carlo simulation, while in the case of resources optimization further analyses are needed to reach reliable results.
Based on the example of frozen strawberry I have worked out a simulation model which shows the remaining shelf-life of frozen products.
I have worked out the DEFO (Dynamic Expiry First Out) pre-delivery organization method, which can be an alternative method of the conventional FIFO or FEFO methods in the case of foodstuffs.
I have verified that the DEFO rule is very effective when the intake is carried out at a very high ambient temperature. The method –contrary to the FIFO rule- can ensure that the products will reach the customers in an appropriate quality even under such circumstances.
14 List of publications related to the dissertation
Publications in journals
Articles published in peer-reviewed journals with impact factors
É.Hajnal, G. Kollár (2007): Process modelling and simulation in food logistics – application of DEFO method in frozen fruit storage. Acta Alimentaria. Accepted article. Expected issue: 2nd half of 2008.
É.Hajnal, G. Almásy, K. Kollár-Hunek, G. Kollár (2007): Resource optimization by simulation technique in food logistics. Applied Ecology and Environmental Research. Vol 5 pp. 108-120.
Articles published in journals without impact factors
É. Hajnal, G. Kollár (2005): Optimization of food logistic processes by simulation technique.
Hungarian Journal of Industrial Chemistry (Special Issue on Recent advances in Computer Aided Process Engineering), Vol 33. pp. 105-111.
É. Hajnal, G. Kollár, M. Láng-Lázi (2004): IT support and statistics in traceability and product recall at food logistics providers. Periodica Polytechnica ser. Chemical Engineering Vol.48, NO.1 pp.21-29 (2004)
Hajnal É. (2004): EU környezetvédelmi elıírásainak érvényesítése a logisztikai szolgáltatásban. Logisztikai Évkönyv 2004., Budapest, pp 61-66.
Hajnal É. (2001): Élelmiszerlogisztikai szolgáltatások speciális minıségi és élelmiszerbiztonsági követelményei. Az Európai Unio agrárgazdasága 2001.VI. évfolyam 7-8 sz., Budapest
Publications in conference papers National conference (full paper)
Hajnal É., Kollár G. (2002): A logisztikai szolgáltatásban kiépített integrált minıségbiztosítási rendszerek alapkövetelményei:termékbiztonság és nyomonkövethetıség. Mőszaki Kémiai Napok konferencia kiadványa, Veszprém, p. 172-176.
Hajnal É., Kollár G. (2003): Statisztikai áruellenırzés logisztikai központban. Mőszaki Kémiai Napok konferencia kiadványa, Veszprém, p. 49-54.
Hajnal É., Kollár G. (2003): HACCP rendszer kiépítése logisztikai központban Mőszaki Kémiai Napok konferencia kiadványa, Veszprém, p. 55-60.
Hajnal É., Kollár G. (2004): Folyamatoptimalizálás és monitoring a logisztikában. Mőszaki Kémiai Napok 2004. konferencia kiadványa, Veszprém, p. 41-43.
National conference (abstract)
Hajnal É., Kollár G. (2004): Application of simulation models in food logistics. Szegedi Konferencia 2004. konferencia kiadványa, Szeged, p. 267.
15 International conference (full paper)
Hajnal É. (2002): Környezetirányítási rendszer alapelveinek alkalmazása logisztikai központban. VIII. Nemzetközi Vegyészkonferencia konferencia kiadványa, Kolozsvár, p. 101- 104.
Hajnal É., Kollár G. (2003): EU környezetvédelmi elıírásainak érvényesítése a logisztikai szolgáltatásban. IX. Nemzetközi Vegyészkonferencia Kolozsvár konferencia kiadványa, Kolozsvár, p. 187-189.
International conference (abstract)
É. Hajnal, G. Kollár (2003): Statistics and IT support in traceability and product recall at food logistics providers. 9th International Workshop on Chemical Engineering Mathematics, Bad Honnef, Germany, July 14-17 2003, p. 11.
É. Hajnal, G. Kollár (2005): Optimization of food logistic processes by simulation technique.
10th International Workshop on Chemical Engineering Mathematics, Budapest, Hungary, August 18-20 2005, p. 6.