KFKI
8/1968
\ц|Ч
^ÍIOKH
I у KÖNYVTÁRA *1
sf^ÁTó INTf/v
J968 MÁV 2 A
N EU TR O N SCATTERING IN V E S TIG A TIO N S O F THE D Y N A M IC S O F CRITICAL STATE IN IRON
J. Gordon, Éva Kisdi-Koszó, L. Pál, Í. Vizi
HUNGARIAN ACADEMY OF SCIENCES CENTRAL RESEARCH INSTITUTE FOR PHYSICS
B U D A P E S T
NEUTRON SCATTERING INVESTIGATIONS OF THE DYNAMICS OF CRITICAL STATE IN IRON J.Gordon, Éva Kisdi-Koszó, L.Pál, I.Vizi
Central Research Institute for Physics Budapest, Hungary
Abstract
The inelasticity of critical scattering has been investigated in iron with the use of pulsed monochromatic neutron beam at the IBR-1 reactor in Dubna. The measure-
-3 -3
ment covered the temperature range
-2,5-10 ^
ГГ <в,5-10
where Т=Т/ТС~ 1 and the critical temperature was approach
ed within T < 5-10~4 .
The slight temperature dependence of the inelastic
ity was confirmed for =
5,7-10 2 . r
but the observed diffusion constant was found to be temperature independent and higher (/> = ^6,-5) than the value
(
jul-H)
reported earlier by other authors.1. Introduction
Neutron scattering experiments offer one of the most powerful, methods for the investigation of the critical mag
netic state. Owing to its favourable magnetic and neutron scattering properties, iron has been extensively studied by this method.
The static properties of fluctuations i.e. the tem
perature dependence of the correlation range and the sus
ceptibility of iron were measured by several authors |^l]
f 2 J , ["3 ] , J^4 j and the correlation range and susceptibil
ity were found to be ^
(T
) ~ T ~ and X(T ) ~ T f’33;Т^Т/ТГ~'\
respectively.
The dynamics of the magnetic fluctuations were first studied by Van Hove ^5 J who introduced a thermodynamical spin diffusion model. This model predicts a slowing down of the fluctuations near the Curie temperature. A similar result was obtained, from several microscopic theories [б],
bJ • [ * ] •
The cold neutron experiments of Jacrot,Konstantinovic, Parette and Cribier 9 J showed, however, an unexpected broadening of the energy distribution even near the Curie point. Later, Passeil, Blinowski, Brun and Nielsen [lo]
confirmed this observation and evaluated a temperature in
dependent spin diffusion constant as
This contradiction of the experimental results with the theory suggests that some of - the processes involved have not been taken into account in the thermodynamical fluctuation model. Marshall [ n ] and Brout [l2^ have pinted out that for
cj
^ >\
, wherehep
is the momentumtransfer of neutrons in the scattering process, collective excitations driven by fluctuation of magnetization may oc
cur even above the transition temperatures.
3 -
The spin-wave-like behaviour for relatively high m o m e n tum transfer above the Neel point was observed by Nathans, Menzinger and Pickart [ 12J in antiferromagnetic RbMnF^ • No similar effect was found, however, in metallic ferromag- n e t s .
Considering that in the recent inelastic scattering experiments the closest approach to the Curie point was
T= 2 W'3
[lo] , [ll] , it was thought of interest to investigate the temperature dependence of the inelasiticity in closer vicinity of
Tr
The results of the first experimental run are now re
ported.
2. Experimental
The spectrometer and the detection electronics as well as the methods of temperature stabilization, homogenization have been already described in an earlier report [l3] .
The moderated neutron beam of the pulsed reactor IBR-1 is monochromatized by a magnetite monocrystal. The first order (ill) reflexion centred around the wavelength of 4,10
Я
is used. A 24 min. Soller collimator located between the monocrystal and the detector determines the wavelength resolution of the system.The overall moderator-to-detector distance is 16,10 m, while the sample-to-detector vacuum flight path is 6,40 m.
The scattered, transmitted or incident neutrons are counted by detectors of 11x13 cm 2 surface. In the first set of experiments the detectors were located at fixed angle
rJ
=2}16°
. The pulses are transferred to a multichannel analyzer with channel width
0 = 16/1
sec and dead time25 J.isec.
The analyzer stores the counts of all the higher order reflexions of the monocrystal and the fast neutron burst from the reactor, too.The fast neutron burstdetermines the "О" mark of the time scale. A 0,5 cm thick, 10 cm long and 3,5 cm wide, zone-melted "Puron" iron sample of 99.99 % purity was used with a 3x3 cm 2 surface exposed to the neutrons. The temperature stability and homogeneity was found to be better than 0,2° during a 100 hour opera
tion. The ratio of the scattered to transmitted intensity showed a maximum at
Tc = 1041 3K
. Measurements were p e r formed in 0,5° steps around the Curie point from T ~ T C ~= -1,5°
to 1,5° and at temperatures I~ c~ 2,5°
and Tc +6,5°3. Data evaluation
Since the counting rate corrections and the choice of the energy and angular resolution functions play a deci
sive role in the evaluation of the parameters of inelastic
ity, the procedure used for the evaluation of the experi
mental data will be described in some detail.
3.1 Analyzer dead time corrections
In the case of pulsed reactors the counting rate o b tained during a reactor pulse may be so high as to result in an appreciable counting loss, for analyzers with conven
tional dead time. Thus, it was necessary to work out a suitable method of dead time correction. The dead time cor
rections were found to be especially important in the m e a s urement of incident beam distribution.
Assuming the neutron counts to have a Poissonian distribution the number of counts in the i-th channel with correction for dead time is given by the formula
q = N
inv\
where
N
is the number of reactor pulses andV(
is given by the equationYi “ ( N - m M ' m i - Z - m i - 2 yi l<) / ( N - mi - m i - f ) Í K = ( r - 0 ) / r
where m ( is the measured number of counts in the i-th c h a n n e l .
The validity of the correction was checked by compar
ison of the corrected spectrum data with those measured at a small counting rate.
- 5 -
3.2 Background corrections
It was observed that a major fraction of the back
ground of the scattered beam is due to diffuse incoherent scattering from the collimator plates. Whenever the back
ground intensity originates from the "forward" direction /i.e. from neutrons transmitted by the sample/ the intensi
ty has to be corrected by use of the formula n k= N k ~ B kfk
where n k and
Nk
are the corrected and measured intensitiesBk
is the background in the k-th channel, respectively,fk
is the /temperature dependent/ transmission factor.3.3 Determination of the input b e a m parameters
Assuming а
Г
-type time distribution of the neutrons which have left the moderator, the probability of a neutroncount in the i-th channel is
ho
l 'jeXP r , j/r eXPr[(l‘‘ti_io)/?,ol ? <f »,) * W
Here
tj
is the time at which the neutron leaves the mo d e r ator,t - t = c - A , t0/ c = X о i s
the maximum of the Gaussian wavelength distribution, andf(t[~
) is thecorrection for detector efficiency. The parameters
oC,Xf
and t0 as determined by least square fit areot~ 0,69 ±0,07
T- 133 ±10 ju
sec,=8,7± 0,7-10 \ 1Q= 16420 ±16 yU
sec. The measured distribution and the best fit are shown in Fig. 2.
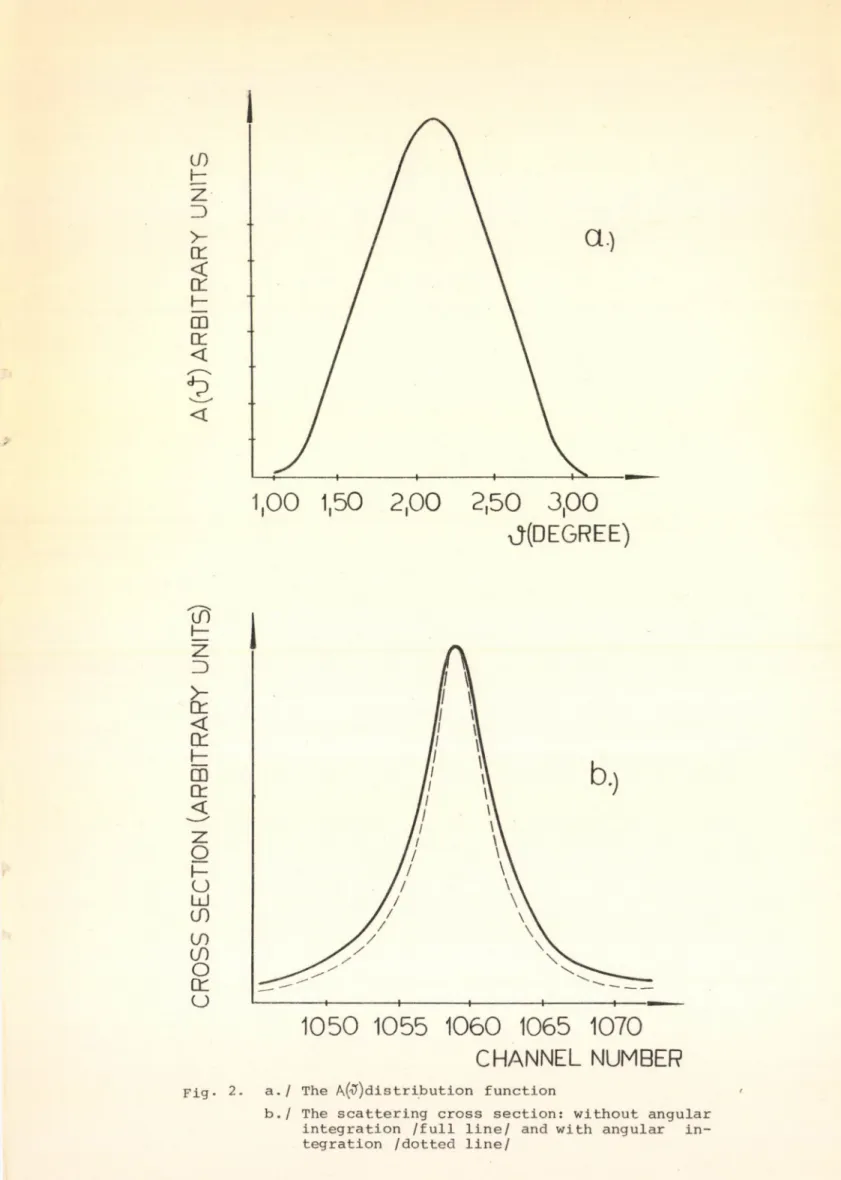
3.4 Correction for angular resolution
Owing to the finite dimensions of the source, sample, detector and collimator, the measured effect is proportional to the value of the scattering cross section averaged over all possible angles permitted by the geometry. The geometry of a system determines a weight function A (if) of the
scattering angles. Thus, the average cross section is given by
m
6 (1T ) « (5 (A ) A (,?) d
Z
*V
А (гГк) & ( ) A k-1The distribution function A (of) was evaluated by Monte Carlo method for the geometry described in § 2. It proved to be sufficient to sum up till m=10. Fig. 2a shows the distrib
ution function A(iT) . In Fig. 2b the cross section б^()Та у) is compared with the averaged CT('J') ~
У<о A(vk )
as a function of the wavelength plotted on time scale. Since the intensity of each element of the scattered beam is propor- tional to-
tJ
and its half-width on the wavelength scaley 2
is
yUv
, it is not surprising that the averaged cross section is narrower than the cross section evaluated for the average angle. In our case the difference in half-width is about 30 %.Two approximations implied in the above calculations have to be pointed out.. First, the b e a m incident on the Soller collimator is taken to be isotropic. This approxima- tion is reasonable since the angular divergence of the beam
x
before the monocrystal is greater than that of the colli
mator. Second, Aj is assumed to be independent of , since the mosaic spread of the monocrystal is not greater than that of the collimator.
3.5 Distribution function of scattered neutrons
Supposing that the inelastic scattering is due to the diffusive motion of spins, the cross section for small angle
7
scattering near Tr is given as
<5( A j , A s ; , /u)AXs=:c o n s i A ( Z x 3 (Kf A
J z t f + z x / / z 2+-(x-x:1f/ U s
where the following notations are used.
X = A /Ap A- being the incident, A Q the scattered wavelength
z
—x + x~^-2 cos
t) ;
j j L ~ A 2 m // his the spin diffusion coefficient.
Considering that A 0 ~ C tQ j A ^ C ^ t - - ^ ) and
where fp is the "reduced flight path";
fg ~ {/L
jf
being the sample-to-moderator, and L the moderator-to-detector distance, the experimental curve wasfitted to the distribution function
i
r ,
R( ^ ) ~ z *Гехрr V r Н М г О / ^ о Г
i"0
/
2
/к
Since in the neighbourhood of the Curie point does not play any important part in the evaluation of the diffusion parameter, its values were replaced by those obtained from angular distribution measurements as
А тс)
K , ( Tc-2,5°)■-4-Ю -4
K*(Tc+6,5°)=5,7-10
All calculated and measured distributions were normal
ized to unit area.
4. Results and discussion
Before evaluating the diffusion parameters ny the method described in the previous section the distribution measured at was compared with that measured at
T
and at
T
+6,5°
using Smirnov's statistical testThe distributions measured above, and below the Curie point, were found to be broader as compared with that measured at
Tc • The reliability of the disagreement with the Curie point curve was higher than 90 %. Then, the normalized dis
tribution /2/ was fitted to the experimental curves making use of 2 values listed at the end of the previous section.
The calculations yielded a temperature - independent diffusion c o n stant:
The best fit and the experimental curve for are shown in Fig. 3.
The disagreement between the diffusion constant eval
uated from the present measurement and the values reported by other authors can be attributed most probably to the dif
ferent procedures of data evaluation, particularly to the fact that no corrections for angular resolution have been made in the earlier calculations of the diffusion constant.
It is apparent from Fig. 2a that without correction for an
gular resolution, we would have , a value which is close to the recently reported
ju=11
^10 j . Of course other reasons, like difference in sample purity, m a y also explain some of the disagreement.Finally, it is of interest to note that in this ex
periment <^>2,5 , thus the temperature independent dif
fusion constant is related to processes occurring within a
t
region of a radius smaller than the correlation length. With the present experimental technique it would be difficult to
yU =
16,5
get any information about processes for which
9
List of References
[l ) SHULL, C.G. and WILKINSON, M.K., Phys.Rev. 103, /1956/
516
2] LOWDE, R.D., Rev.Mod.Phys. 30, /1958/ 69
3] ERICSON, M. and JCROT, B.J., P h y s .C h e m .Solids
13,
/1960/ 235
[4] SPOONER, S. and AVERBACH, B.L., Phys.Rev. 142, /1966/
291
5] VAN HOVE, L., Phys.Rev. 95, /1954/ 1374
6] MORI, H. and KAWASAKI, K . , P r o g r .Theor.Phys. 27, /1962/
529
[7] De GENNES, P.G. and VILLAIN, J., Phys.Chem. Solids 13, /1960/ IO
[8] KAWASAKI, K., Phys.Rev. 142, /1966/ 164
[9] JACROT, B., KONSTANTINOVIC, J., PARETTE, G. and
CRIBIER, D., Proceedings of a Symposium on Inelastic Scattering of Neutrons in Solids and Liquids, Chalk River 1962 IAEA Vienna 1963.
[10] PASSELL, L., BLINOWSKI, K., B R U N , T. and NIELSEN, P., Phys.Rev. 139A, /1965/ 1866
[11] MARSHALL, W., Critical Phenomena. Proceedings of a Conference Washington D.C. 1965. BUREAU of NATIONAL STANDARDS, Washington, 1966.
[1 2] NATHANS, F., MENZINGER, F. and PICKART, S.J., Conference on Magnetism and Magnetic Materials, Boston, 1967 BNL Report No. 11634 /1967/
[1 3] GORDON, J., PELLIONISZ, P., VIZI, I., ZSIGMOND, G.
and SZKATULA, A., Nucl.Instr. and Methods 55, /1967/ 151 [1 4] VAN DER W A E R D E N , B.L., Matematische Statistik.
Springer-Verlag Berlin 1957 pp. 268
CHANNEL NUMBER
Pig. 1. Incident beam spectrum
CR OSS S E C T IO N ( A R B IT R A R Y U N IT S ) A ( il ) A R B IT R A R Y U N IT S
1050 1055 1060 1065 1070
CHANNEL NUMBER
Fig. 2. a./ The A^distribution function
b./ The scattering cross section: without angular integration /full line/ and with angular in
tegration /dotted line/
с.--- >--- 1--- 1---1--- -H--- »Tapi---
1020 1040 1060 1080 1100 1120
CHANNEL NUMBER
Fig. 3. Scattered neutron distribution: measured counts and the best fit curve at T = 7^
Printed in the Central Research Institute for Physics, Budapest Kiadja a KFKI Könyvtár- és Kiadói Osztály
o.v.: Dr. Farkas Istvánná Szakmai lektor: Kroó Norbert Nyelvi lektor: Monori Jenőné
Példányszám: 100 Munkaszám: 3565 Budapest, 1968. április 8.