In: Journal of Physiology, 597(23): 5639-5670 (2019) 10.1113/JP278966 Manuscript as accepted.
This work is licensed under the Creative Commons Attribution 4.0 International License (CC BY 4.0).
Presence of synchrony-generating hubs in the human epileptic neocortex.
Ágnes Kandrács1,2, Katharina T. Hofer1,2, Kinga Tóth1, Estilla Z. Tóth1, László Entz3, Attila G. Bagó3, Loránd Erőss3, Zsófia Jordán3, Gábor Nagy3, Dániel Fabó3, István Ulbert1,2,3 and Lucia Wittner1,2,3
1. Institute of Cognitive Neuroscience and Psychology, Research Center for Natural Sciences, Hungarian Academy of Sciences, 1117 Budapest, Hungary
2. Department of Information Technology, Pázmány Péter Catholic University, 1083 Budapest, Hungary
3. National Institute of Clinical Neuroscience, 1145 Budapest, Hungary
Correspondence to:
Lucia Wittner
Institute of Cognitive Neuroscience and Psychology,
Research Center for Natural Sciences, Hungarian Academy of Sciences, 1117 Budapest, Magyar tudósok körútja 2. Hungary
tel: +36-1-382-6807
e-mail: wittner.lucia@ttk.mta.hu ORCID IDs:
Á. Kandrács: 0000-0002-6408-2397 K. T. Hofer: 0000-0002-1626-9288 L. Wittner: 0000-0001-6800-0953
Running head: Bicuculline-induced epileptiform events in human neocortex
Key points summary:
• Initiation of pathological synchronous events such as epileptic spikes and seizures is linked to the hyperexcitability of the neuronal network both in humans and animals.
• Here we show that epileptiform interictal-like spikes and seizures emerged in human neocortical slices by blocking GABAA receptors, following the disappearance of the spontaneously occurring synchronous population activity.
• Large variability of temporally and spatially simple and complex spikes was generated by tissue from epileptic patients, whereas only simple events appeared in samples from non-epileptic patients.
• Physiological population activity was associated with a moderate level of principal cell and interneuron firing with a slight dominance of excitatory neuronal activity, whereas epileptiform events were mainly initiated by the synchronous and intense discharge of inhibitory cells.
• These results help us to understand the role of excitatory and inhibitory neurons in synchrony generating mechanisms, both in epileptic and non-epileptic conditions.
Abstract
Understanding the role of different neuron types in synchrony generation is crucial to develop new therapies aiming to prevent hypersynchronous events such as epileptic seizures.
Paroxysmal activity was linked to hyperexcitability and to bursting behaviour of pyramidal cells in animals. Human data suggested a leading role of either principal cells or interneurons, depending on the seizure morphology. Here we aimed to uncover the role of excitatory and inhibitory processes in synchrony generation by analysing the activity of clustered single neurons during physiological and epileptiform synchronies in human neocortical slices.
Spontaneous population activity was detected with a 24-channel laminar microelectrode in tissue derived from patients with or without preoperative clinical manifestations of epilepsy.
This population activity disappeared by blocking GABAA receptors, and several variations of spatially and temporally simple or complex interictal-like spikes emerged in epileptic tissue, whereas peritumoural slices generated only simple spikes. About half of the clustered neurons participated with an elevated firing rate in physiological synchronies with a slight dominance of excitatory cells. In contrast, more than 90% of the neurons contributed to interictal-like spikes and seizures, and an intense and synchronous discharge of inhibitory neurons was associated to the start of these events. Intrinsically bursting principal cells fired later than other neurons. Our data suggest that a balanced excitation and inhibition characterized physiological synchronies, whereas disinhibition-induced epileptiform events were initiated mainly by non-synaptically synchronized inhibitory neurons. Our results further underline the differences between humans and animal models, and between in vivo and (pharmacologically manipulated) in vitro conditions.
Abbreviations
4-AP 4-amino-pyridine AP Action potential
BIC GABAA receptor antagonist bicuculline CSD Current source density
gran-infra Granular+infragranular layers HYP Hypersynchronous activity
IIS Bicuculline-induced interictal-like spike IN Inhibitory cell
LFPg Local field potential gradient LVF Low voltage fast activity MUA Multiple unit activity NoEpi Patients with no epilepsy
NoMed Patients having one seizure, but they do not need medication PC Principal cell
PDS Paroxysmal depolarization shift
ResEpi Patients with pharmacoresistant epilepsy SPA Spontaneous population activity
supra-gran Supragranular+granular layers SWC Spike and wave complex TreatEpi Patients with treatable epilepsy UC Unclassified cell
Introduction
Understanding the role of different neuron types in the generation of physiological and pathological synchronies is crucial to identify what makes a brain region predisposed to generate hypersynchronous events, such as epileptic seizures and interictal spikes. Abundant data describe the properties and behaviour of cells and neuronal circuits during epileptic activity in animal models (for reviews see de Curtis & Avanzini, 2001; McCormick & Contreras, 2001;
Avoli et al., 2002; Trevelyan et al., 2015), but information about the human cells and disease is considerably less detailed (for reviews see Avoli & Williamson, 1996; Avoli et al., 2005).
Knowledge about the cellular and network mechanisms related to synchrony generation mainly derive from the hippocampus and the surrounding medial temporal areas, while the role of different neuron types in synchronisation processes of other neocortical regions remains mainly uncovered. In this study, we explored the firing pattern of human neocortical single cells and microcircuits during synchronizations as well as their possible relationship with epilepsy. We induced epileptic seizures and interictal spikes with the GABAA receptor antagonist bicuculline (BIC) in human neocortical slices derived from epileptic and tumour patients and compared these pathological events to synchronous population activity spontaneously occurring in physiological solution. We aimed to get insight into the cellular mechanisms by analysing the discharge properties of clustered excitatory and inhibitory neurons during both epileptiform and physiological synchronous events.
The cellular features and the firing pattern of single neurons provide important information about how synchronous events are initiated. The bursting behaviour and the paroxysmal depolarization shift (PDS) of excitatory principal neurons have been linked to the initiation of interictal discharge in animals (for review see de Curtis & Avanzini, 2001).
However, in humans, neither in vitro (Prince & Wong, 1981; Avoli & Olivier, 1989;
Williamson et al., 2003), nor in vivo early work (Calvin et al., 1973; Ishijima et al., 1975;
Wyler et al., 1982; Staba et al., 2002) could find direct evidence for the relation between bursting behaviour and interictal spike generation. More recently, an in vivo study described that cells with modulated firing during interictal spikes have higher burstiness index than non- modulated cells (Keller et al., 2010). In postoperative human neocortical tissue, pharmacologically induced interictal-like activity was used to reveal the cellular properties presumably contributing to the generation of pathological synchronies. The leading role of
excitatory cells and bursting behaviour in the generation of hypersynchronous events was supported by the fact that bursting neurons and depolarization shift were observed in the Mg2+- free (Avoli et al., 1995) and in the K+-channel blocker 4-aminopyridine (4-AP, Mattia et al., 1995) models of epileptic activity. In the presence of the GABAA receptor antagonist bicuculline (BIC, Hwa et al., 1991) interictal-like activity was also reflected as bursts and PDS in human neocortical neurons at the intracellular level. Contrary to the Mg2+-free and the 4-AP models, where interictal-like and seizure activity spontaneously emerged, when applying BIC- bath, electrical stimulus was needed to induce epileptiform synchrony.
Cellular synchronization mechanisms leading to the initiation of seizures in epileptic patients were investigated recently, with the aid of intracortical microelectrodes. The dynamic balance of excitation and inhibition characterized the human neocortex in physiological conditions, which broke during epileptic seizures (Dehghani et al., 2016). Increased neuronal firing, up to several minutes before the onset of the seizure was observed both in the neocortex (Truccolo et al., 2011) and the hippocampus (Lambrecq et al., 2017) of epileptic patients.
Seizures with different onset patterns were shown to be generated by different mechanisms.
The low voltage fast (LVF) activity was the most often detected pattern in the neocortex (Perucca et al., 2014) and was shown to begin with the increased activity of inhibitory interneurons in the medial temporal lobe (Elahian et al., 2018) and other neocortical areas (Dehghani et al., 2016) of humans as well as in animals (for review see Weiss et al., 2019). The hypersynchronous (HYP) seizure onset pattern was observed in patients with mesial temporal lobe epilepsy exclusively (Perucca et al., 2014) and was associated to enhanced excitatory processes both in human (Huberfeld et al., 2011) and experimental epilepsy (Kohling et al., 2016). Preceding the seizures of neocortical origin that spread to the medial temporal lobe, inhibitory but not excitatory neuronal discharge was decreased in the hippocampal formation (Misra et al., 2018). During the course of the seizures heterogeneous firing patterns were detected both in the human hippocampus (Babb et al., 1987) and the neocortex, together with a high ratio of cells increasing their firing rate (Truccolo et al., 2011). Furthermore, spontaneous seizure-like events appeared in neocortical slices derived from epileptic patients, by applying kainate plus carbachol (Florez et al., 2015) as well as in the Mg2+-free model (Avoli et al., 1987; Mattia et al., 1995), which seizures were reflected intracellularly as large depolarizing shift and burst firing (Avoli et al., 1997).
Intracortical microelectrodes recording neuronal activity are implanted only to epileptic patients, and – for obvious ethical reasons – such data cannot be obtained from healthy subjects.
Our in vitro model has a considerable advantage compared to in vivo recordings: it has a double
internal control. First, we can compare epileptic tissue to non-epileptic samples derived from tumour patients without clinical manifestations of preoperative epileptic activity. Second, we can compare synchronous activity spontaneously occurring in physiological solution (spontaneous population activity, SPA, Tóth et al., 2018) to epileptiform interictal-like discharges and seizures. SPA emerges in slices derived from patients both with and without epilepsy, shows several crucial differences compared to interictal spikes in vivo, and is considered to be associated to physiological processes (Tóth et al., 2018). However, limitations of the in vitro conditions are evident, i.e. the excised neocortical samples have partially cut internal, and do not possess external connections, and the bath solution is indisputably different from the cerebro-spinal fluid of the living subjects. Although the resulting modified synaptic connections might affect the spontaneous activity of neurons, the double internal control in our model system can help us to identify phenomena related to epileptic conditions.
The aim of this study was to investigate the firing properties of human neocortical neurons during physiological and epileptiform synchronies. Specifically, we wished to describe the role of excitatory and inhibitory cells and circuits in synchrony generation, by comparing the behaviour of neuronal networks and the discharge properties of single cells during SPA and disinhibition-induced interictal spikes and seizures in a human in vitro model of epilepsy.
Methods
Ethical Approval
The experiments included in this study were conducted on resected human brain tissue.
A written informed consent was obtained from all patients. Our studies conformed to the standards set by the latest revision of the Declaration of Helsinki, except for registration in a database. The procedures were approved by the Regional and Institutional Committee of the National Institute of Clinical Neuroscience, as well as by the Hungarian Ministry of Health and the Research Ethics of Scientific Council of Health (ethical licence number: ETT TUKEB 20680-4/2012/EKU). This study used a partly overlapping patient dataset with our previous work (Tóth et al., 2018).
Epileptic patients
Samples were resected from 30 epileptic patients (Table 1). We obtained epileptic neocortical tissue from frontal (n=6 patients), temporal (n=17 patients), parietal (n=4 patients) and occipital (n=3 patients) lobes. Most of the patients (n=20) suffered from pharmacoresistant epilepsy (ResEpi, resistant epilepsy) for 28.1±7.3 years on average. As in our previous study (Tóth et al., 2018), we categorized the remaining 10 patients as patients who were either seizure free with appropriate pharmacological treatment (TreatEpi, treatable epilepsy, n=5 patients), or had one (provoked) seizure without the need for medication (NoMed, no need for medication, n=5 patients), and were operated in order to resect their tumour. Ten epileptic patients were diagnosed with cortical dysplasia, 10 patients with tumour of glial origin, 3 patients with carcinoma metastasis. The remaining 7 patients had cavernoma (n=3), gliosis (n=2), haematoma (n=1) and hippocampal sclerosis (n=1, for details see Table 1). Histopathological changes (signs of dysgenesis or tumour infiltration) of the obtained tissue have been verified with Nissl staining, the neuronal marker NeuN-, the astroglial marker glial fibrillary acidic protein- and a specific interneuron marker parvalbumin-immunostaining (Table 1., methods described in (Tóth et al., 2018). Epileptic patients: 17 females, 13 males, age range: 18-68 years, mean±st.dev.: 35.1±13.8 years.
Non-epileptic patients
Nineteen patients diagnosed with brain tumour but without epilepsy (NoEpi, no epilepsy) were included in this study (Table 1). These patients – as it is stated in their anamnesis – did not show clinical manifestation of epileptic seizure before the date of their brain surgery.
Neocortical tissue was resected from tumour patients from frontal (n=7 patients), temporal (n=4 patients), parietal (n=6 patients) and occipital (n=2 patients) lobes. Thirteen patients were diagnosed with tumours of glial origin: glioblastoma (n=10) or anaplastic astrocytoma (n=3).
Four patients were operated to remove their carcinoma metastasis, one patient had cavernoma, and one neurocytoma (for details see Table 1). The distance of the obtained neocortical tissue from the tumour (see Table 1) had been assessed by the neurosurgeon, based on magnetic resonance (MR) images, intraoperative pictures and occasionally defined by a navigational system. Non-epileptic patients: 8 females, 11 males, age range: 31-79 years, mean±st.dev.:
58.5±14.6 years.
Tissue preparation
Tissue was transported from the operating room to the laboratory (located in the same building) in a cold, oxygenated solution containing (in mM) 248 D-sucrose, 26 NaHCO3, 1 KCl, 1 CaCl2, 10 MgCl2, 10 D-glucose and 1 phenol red, equilibrated with 5% CO2 in 95% O2. Neocortical slices of 500 µm thickness were cut with a Leica VT1000S vibratome (RRID:SCR_016495). They were transferred and maintained at 35–37°C in an interface chamber perfused with a standard physiological solution containing (in mM) 124 NaCl, 26 NaHCO3, 3.5 KCl, 1 MgCl2, 1 CaCl2, and 10 D-glucose, equilibrated with 5% CO2 in 95% O2.
Recordings
The extracellular local field potential gradient (LFPg) recording was obtained as described previously (Tóth et al., 2018). Briefly, we used a 24 contact (distance between contacts: 150 µm) laminar microelectrode (Ulbert et al., 2001; Ulbert et al., 2004a; Ulbert et al., 2004b; Fabó et al., 2008; Wittner et al., 2009), and a custom-made voltage gradient amplifier of pass-band 0.01 Hz to 10 kHz. Signals were digitized with a 32 channel, 16-bit resolution analogue-to-digital converter (National Instruments, Austin TX, USA) at 20 kHz sampling rate, recorded with a home written routine in LabView8.6 (National Instruments,
Austin TX, USA, RRID:SCR_014325). The linear 24 channel microelectrode was placed perpendicular to the pial surface, and slices were mapped from one end to the other at every 300-400 µm.
Drugs
A-type γ-aminobutyric acid (GABAA) receptor-mediated signalling was suppressed by bicuculline methiodide (BIC, 20 µM or 50 µM), obtained from Tocris Bioscience (Izinta Kft., Hungary). During most of the experiments, 100 ml of solution containing bicuculline was washed into the interface chamber, and 10-minute long epochs were recorded continuously during the whole experiment (control – BIC application – washout). The washout period endured until the reappearance of the spontaneous population activity (SPA). In the absence of a reappearing SPA, the washout persisted for an hour.
Data analysis
Analysis of SPAs and BIC-induced events
The presence or absence of BIC-induced activity was noted in case of every slice. In several cases, only one 10-minute epoch was recorded, but in most of the cases, 3 to 5 epochs were recorded while applying the BIC bath, and the one from the middle/end was chosen for detailed analysis when recurrent BIC-induced events occurred. In case of single events, the file containing the event was analysed.
Data were analysed with the Neuroscan Edit4.5 program (Compumedics Neuroscan, Charlotte, NC, USA), and home written routines for Matlab (The MathWorks, Natick, MA, USA, RRID:SCR_001622) and C++. The microelectrode covered all layers of the neocortex.
Usually, channels 1-12 were in the supragranular, channels 13-15 in the granular and channels 16-23 were in the infragranular layers. Channel positions were determined according to the thickness of the neocortex of the given patient and corrected if necessary.
Detection of both spontaneous and BIC-induced population activity was performed on LFPg records after a double Hamming window spatial smoothing and a band-pass filtering between 3 and 30 Hz (zero phase shift, 12 dB/octave). Events larger than two times the standard deviation of the basal activity were detected and included in the analysis. The largest amplitude LFPg peak of simple events was chosen as time zero for averaging and for peri-event time histogram analysis. Two types of synchronous events have been detected during the application
of bicuculline: interictal-like spikes (IISs) and seizure-like events. IISs were further divided into separate groups according to their spatial and temporal complexity. Temporally complex events consisted of multiple LFPg deflections spreading to the same cortical layers. Spatially complex events united waves developing from different locations. In case of complex events (such as complex IISs and seizures), the first LFPg peak on the channel where its amplitude was the largest was chosen as time zero. The location and frequency of the events (see below) were determined in each case. Current source density (CSD; an estimate of population trans- membrane currents), and multiple unit activity (MUA) were calculated from the LFPg using standard techniques (Tóth et al., 2018). The duration of the synchronous events was assessed by two different methods because of the differences in the waveform characteristics of spontaneous and induced synchronous events. The length of spontaneous population activity (SPA) events was measured on the channel displaying the largest LFPg amplitude, at 50% of that amplitude. To have an estimation for the total duration of the SPAs, the halfmax length was multiplied by two. This method could not be applied to bicuculline-induced events, since the length of the LFPg deflections were unequal on the different channels, furthermore, the peak of the deflection was at considerably different time point on the different channels. Therefore, the length of interictal-like spikes (IIS) was calculated using the mean global field power (MGFP) from the channels where the event was present. The MGFP corresponds to the spatial standard deviation of field potential amplitude values obtained with multiple channel recording (Lehmann & Skrandies, 1980; Skrandies, 1990). The average length was calculated at 5% of the maximal MGFP amplitude. In the case of temporally complex IISs, the length of the first component was calculated. The MGFP method could not be applied to SPAs because the LFPg amplitude of these events are low, and therefore the 5% height of the maximal values dropped below the noise level and provided imprecise measurement. The length of BIC-induced seizure- like activities was assessed by manual estimation using the butterfly plot of all channels. In the case of recurring seizures, the butterfly plot was generated from the averaged LFPg, to include all seizure events.
The recurrence frequency was determined in each recording with population events (SPA, IIS, seizure). Note that in case of single epileptiform events, we calculated the recurrence frequency from one, usually 10 minutes long epoch containing the event, although in most of these cases multiple epochs were recorded.
Time-frequency analysis
We analysed the ripple and fast ripple components of SPAs, IISs and seizures with the aid of routines written in Matlab, as follows. Original 20 kHz sampling rate records were low pass filtered at 700 Hz and then down-sampled to 2 kHz. Wavelet analysis was applied on epochs from -1 000 ms to 1 047.5 ms for SPAs and from -500 ms to 1 547.5 ms for IISs with the LFPg peak of the SPA/IIS at time zero (detected as described above). In case of seizures, the epoch(s) ranged from -500 ms to 15 883.5 ms. Time-frequency analysis was performed between 0 and 700 Hz on the electrode channels where the SPA/IIS/seizure was present, and baseline corrected to -300 to -100 ms. For each channel, the maximal power change (relative to the baseline) was determined within the range from 130 to 250 Hz (ripple frequency) and 300 to 700 Hz (fast ripple frequency) at time zero (Tóth et al., 2018). The frequencies where the power showed the maximum were also determined. Both the ripple and fast ripple power as well as the frequencies were averaged across the channels; thus, one ripple and one fast ripple power and frequency parameter were determined for each recording. This last step was necessary for the comparison of synchronous activities spreading to different numbers of channels.
Analysis of the initiation site and the spread of BIC-induced events
We determined the initiation site, as well as the spreading direction and speed of the BIC-induced events between the neocortical layers. Note, that in our analysis spreading direction refers to interlaminar spread, i. e. propagation across cortical layers. In most cases, the amplitude of the LFPg transient evoked by BIC was large on certain channels but close to baseline (and therefore not detectable) on others. Additionally, an increase in cell firing was associated with the events. To consider both the deflection on the field potential signal as well as the cellular activity, we applied the following method to detect the start of each event on each channel. After applying a 0.5 Hz high-pass filter, we calculated the power of the LFPg signal. The start of the event was defined via a two-step thresholding process. For each recording, we defined two different thresholds. Threshold 1 determined which peaks should be considered as part of the event, whereas threshold 2 determined where the first peak deviates from the baseline. In case threshold 1 was crossed multiple times during one event, the first crossing point was used. We chose threshold 1 manually for each file. We set the threshold to a level ensuring that the first main peak of the BIC-induced events was detected and matched to the previous detection (see above). The variation in MUA and LFPg amplitudes (during the baseline as well as during the BIC-induced event) did not allow a general threshold rule. Note that threshold 1 was not used to detect the BIC-induced events within the recording, as it was
made separately. It was only used within the algorithm to define the beginning of each recording. Starting from threshold 1 time point, the signal was followed to earlier and earlier time points, until it fell below threshold 2 (which was set as low as possible to find the deflection point from the baseline). This time point was used as the start of the event. This process was repeated for every channel and every event. No start was detected for a specific peak if it did not surpass threshold 1. In case of temporally and temporally+spatially complex events, we analysed only the first appearance of the event on a given channel.
The spreading speed of the events across the channels was calculated by dividing the delay between the starting points of the events by the distance between the two electrode contacts in question. This speed value was determined for every channel pair, up to 5 contacts apart. For each event, the speed was calculated by taking the median of these pairwise speed values.
Cell clustering
Single cells were clustered from records high-pass filtered at 80 Hz or at 500 Hz with the aid of a home-written program for Matlab (Wave Solution). Only neurons with a clear refractory period of at least 1.5 ms were included. Cell clustering during physiological conditions and during the BIC bath was performed separately. Although we made consecutive (usually 10 min long) recordings, the identification of the clusters separated by 30-40 min was very uncertain or even impossible, for the following reason. The cell activity observed in the physiological solution has been considerably changed during the application of BIC. The spontaneously active cells became silent during the application of the drug, while other neurons started to discharge (see more details in the Result section). Changes in the extracellularly recorded action potential (AP) waveform were observed in vivo, during population activity: the amplitude of the APs decreased by ~12% when the firing frequency of the cell was high (Stratton et al., 2012). We considered this phenomenon and clustered our cells accordingly.
Furthermore, as others (Merricks et al., 2015), we had difficulties in clustering single units during epileptic seizures because of the distorted action potentials. In these recordings, only cells with relatively high amplitude and recognizable action potential were clustered, whereas small (and noisy) clusters were excluded. During the high frequency oscillatory phases of the seizures cluster detection might be imprecise, therefore conclusions about cell firing during seizure were drawn carefully.
Action potential (AP) waveform analysis and separation of principal cells (PC) and interneurons (IN) was done with the aid of a home written routine in Matlab. Two independent
criteria were used to separate PCs and INs, unbiased by the tissue of origin. The duration of PC APs is significantly higher than that of INs (Wilson & McNaughton, 1993; Csicsvári et al., 1999b). We measured the AP width at the half of the largest LFPg amplitude (half width). The cell was considered to be PC if this value was larger than 0.4 ms, and IN if it was less than 0.2 ms. Cells with AP width between 0.2 and 0.4 ms were defined as unclassified cells (UC).
Discharge dynamics was also considered when separating cell types (Barthó et al., 2004;
Peyrache et al., 2012). A high peak at 3-10 ms followed by a fast, exponential decay on the autocorrelogram was characteristic to “intrinsically bursting” PCs. If the peak was lacking but there was a sustained firing, or the peak was >10 ms, the cell was considered to be “regular firing” PC. The remaining cells with half widths of >0.4 ms were categorized as PCs with
“unclear firing”. A slow rise together with a slow decay identified INs. In the hippocampus and neocortex of the living animal, the firing frequency of the cells gives additional information on their identity: PCs have a significantly lower firing rate than INs (Buzsáki & Eidelberg, 1983;
Csicsvári et al., 1999a). In vitro procedures considerably alter the living conditions of the cells.
Therefore, we did not consider this criterion for the identification of the cell type.
Extracellularly recorded very short duration and triphasic action potentials (APs) are indicative of axonally running action potentials, and might be categorized as INs (Robbins et al., 2013). We examined this question in our neuron database and found 6/772 cells (0.8%) with very short half width (<0.1 ms). These cells indeed showed a triphasic waveform, even after transforming the local field potential gradient recording into a “referential-like” recording by referencing all channels to channel 1 (the one at the pial surface).
Analysis of single cell firing was performed with a home written routine in Matlab. The average firing frequency, interevent interval (IEI, event = action potential, AP), and a measure for burstiness (percentage of APs within bursts) were calculated for each cell. Bursts were defined as a set of (at least) three APs within 20 ms. Bursts containing more than three APs could be longer than 20 ms, but each group of three consecutive APs had to be within a 20 ms period. Moreover, the first AP of the burst had to be preceded and the last AP had to be followed by a 20 ms silent period (modified from Staba et al., 2002).
Cell firing during SPA and BIC-induced events
We examined the discharge of neurons relative to the LFPg peak of the SPA, IIS and seizure events with two approaches. We made these analyses in each recording containing SPAs, IIS(s) and seizure(s) and single cell firing in slices from the ResEpi (n=15 SPA, n=14 IIS, n=6 seizures) and the NoEpi (n=14 SPA, n=13 IIS, n=3 seizures) groups. First, we aimed
to describe the proportion of single cells which participate in the generation of SPA and IIS events. To do this, we generated PETHs for every cell/SPA, cell/IIS or cell/seizure comparison, with a bin size of 5 ms, from -150 to +50 ms around the LFPg peak of the SPAs and from -400 to +200 ms around the LFPg peak of the IISs and in case of seizures. From these PETHS we calculated the average firing frequency of the neurons during the events as well as during the baseline period. In case of SPAs the time window of the events was from -50 to 50 ms, whereas the baseline ranged from -150 to -50 ms before the LFPg peak of the SPAs. In case of bicuculline-induced population activities the time window of the events was defined between - 100 to 200 ms, whereas the baseline ranged from -400 to -100 ms before the LFPg peak of the IISs or the seizures. The normalized firing change was calculated for each cell in the form of A/(A+B), where A is the average firing frequency during the time window of the events and B is the firing frequency during the time window of the baseline. Thus, all values fell between zero and one. A neuron was considered to have an increased firing if its firing change value exceeded 0.6 (which equals to an increase to 150% of its baseline firing rate).
With the second approach, we analysed how excitatory and inhibitory cell types participate in the initiation of SPA, IIS and seizure events. Therefore, we computed combined PETHs for all PC APs, for all IN APs and for all UC APs of the given recording, from -100 to +200 ms around the LFPg peak of the SPAs and -200 to +1000 ms around the LFPg peak of the IISs and seizures. First, we determined in each recording which cell type (PC, IN or UC) starts firing during the SPA/IIS/seizure. Furthermore, we estimated the contribution of the discharge of the different cell types in the initiation of the synchronous events as follows. We calculated the area under the curve of the PC/IN/UC firing of the PETH relative to the total firing during the interval of -50 to +50 ms around the LFPg peak of SPAs, and -100 to +200 ms around the LFPg peak of IISs and seizures.
Statistics
Statistical significances were determined using either the program Statistica 13 (Tibco Software Inc. Palo Alto, CA, USA, RRID:SCR_014213) or Matlab. In case of normal distributions (verified with the Kolmogorov-Smirnov & Lilliefors test), a t-test was performed to compare two groups or a One-way ANOVA (with Tukey honest different significance post- hoc test) was performed to compare multiple groups, respectively. If the normality test failed, we used Mann-Whitney U test or Kruskal-Wallis ANOVA for comparing two or multiple groups, respectively. In the main text we provide the mean±standard deviation for easier reading, whereas in the tables we present both the median [1st and 3rd quartiles] as well as the
mean±standard deviation. In order to test for unequal proportions in contingency tables we used http://vassarstats.net. In case of 2x3 contingency tables, the Fisher Exact Probability Test was applied if the total size of the data set was not greater than 300, and the Chi-square test was applied if it exceeded 300.
RESULTS
Patient groups
Patients were distributed into four groups by experienced neurologists (Table 1, (Tóth et al., 2018): 1) patients with pharmacoresistant epilepsy (resistant epilepsy, ResEpi), 2) patients with generalized or focal tonic-clonic seizures who were seizure free with appropriate medication (treatable epilepsy, TreatEpi), 3) patients with one generalized tonic- clonic seizure or with occasional (provoked) seizures, and with no need for medication (no medication, NoMed). These patients were operated in order to resect their tumour, and 4) patients without preoperative seizures (no epilepsy, NoEpi). Glial tumours are known to be highly epileptogenic. Therefore, the anamnesis of tumour patients was carefully checked, and they were asked about their possible epileptic episodes by expert neurologists. Patients with the smallest doubt of having preoperative paroxysmal event(s) were categorized as NoMed (or TreatEpi) patients. Furthermore, preoperative clinical EEG recordings on patients with glial tumours could not confirm the presence of any epileptic activity (Tóth et al., 2018). Patients belonging to the first three groups (ResEpi+TreatEpi+NoMed) were considered to be epileptic, whereas patients in the NoEpi group will be referred to as non-epileptic. To examine changes related to epilepsy, we compared results deriving from the ResEpi group to those from the NoEpi group.
Emergence of spontaneous activity in physiological bath
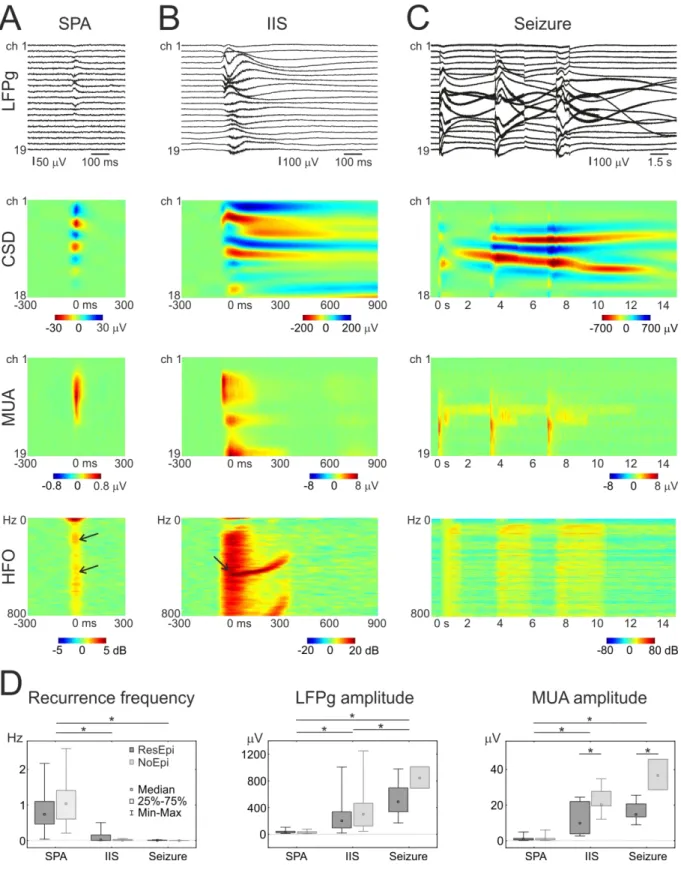
Spontaneous population activity (SPA) was generated in the human epileptic (Fig. 1, Table 2) and non-epileptic neocortex in vitro, in physiological bath solution (see also Köhling et al., 1998; Kerekes et al., 2014; Pallud et al., 2014). Please, note, that SPA designates the totality of recurring synchronous events in a given recording. The number of events per recording varied from 21 to 1229. Single population events will be referred to as ‘SPA event’.
The emergence rate of SPA was similar in slices derived from epileptic tissue affected vs. not affected by the cortical dysgenesis and it did not differ in samples derived from patients having tumours of glial origin vs. having carcinoma metastasis (Tóth et al., 2018). Occasionally, notably larger and more complex events also spontaneously emerged in tissue from epileptic patients, which were considered to be interictal-like discharges (not shown, n=2/43 slices, (Tóth et al., 2018). We examined n=26 slices with SPA and n=17 slices without SPA derived from 30 epileptic patients, and n=20 slices with SPA and n=6 slices without SPA in tissue
from patients in the NoEpi group (see Table 2). The GABAA receptor antagonist bicuculline (BIC) abolished the SPA in all cases. In 19 of 25 cases, SPA reappeared when BIC was washed out, whereas 4 slices from ResEpi and 2 slices from the NoEpi group did not generate SPA after the BIC washout. SPA appeared after the BIC washout in 1 slice from the NoMed group, which originally did not generate SPA. Interictal-like discharges spontaneously emerging in physiological bath solution also disappeared during the application of BIC but were not further analysed in this study.
Bicuculline-induced epileptiform activity
The application of a BIC bath resulted in the generation of spontaneous epileptiform activity in 27/43 and in 15/26 slices in tissue derived from epileptic and non-epileptic patients, respectively (Table 2, not different, Chi-square test, p=0.87), which disappeared when BIC was washed out. This contrasts with previous results (Schwartzkroin & Haglund, 1986; Hwa et al., 1991), where electrical stimulation was also needed to achieve the emergence of interictal-like spikes in human epileptic neocortical slices during BIC application. Bicuculline- induced activity appeared either as interictal spike (IIS) or as seizure-like activity (Fig. 1.).
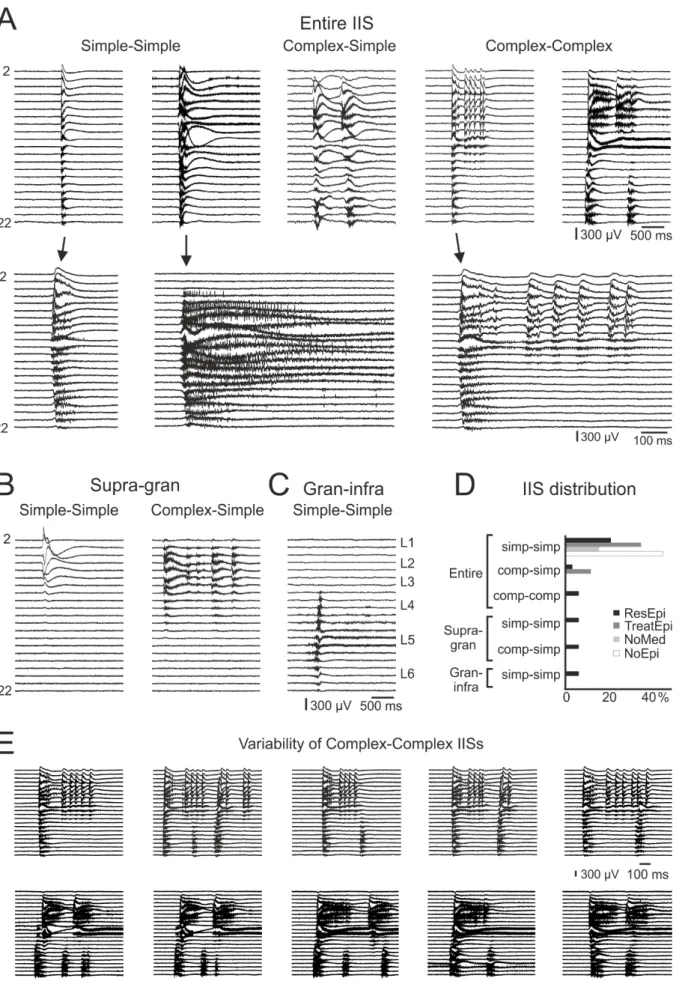
Note that the term ‘interictal-like discharge’ is used for spontaneously occurring epileptiform activity in vitro (see above), whereas ‘interictal-like spike’ (IIS) is used to designate BIC- induced interictal-like activity. Note, that when referring to IIS we mean the totality of interictal-like spike events in a given recording. In the ResEpi group, IISs invaded either the entire width of the neocortex, or were restricted to the supragranular+granular (supra-gran), or to the granular+infragranular (gran-infra) layers (Fig. 2). In all other patient groups, IISs always spread to the entire neocortex (Table 3, Fig. 2D). Based on temporal and spatial complexity, we further classified BIC-induced events as simple or complex events. In the ResEpi group, slices generated different types of IISs (temporally and spatially simple-simple, complex-simple, complex-complex, respectively), whereas in the NoEpi group only simple- simple IISs were detected (Fig. 2, Table 3). Temporally complex IISs consisted of more than one local field potential gradient (LFPg) deflections, with a total duration of up to 5 seconds.
Spatially complex IIS events (n=2 activities) were variable in their spatial pattern. In both cases, the first spike of the spatially complex events usually invaded the entire width of the cortex, while during the following spikes of the IISs the supragranular and infragranular layers were differently involved from event to event (Fig. 2E).
Seizures were 15 to 28 sec long, temporally complex epileptiform events, consisting of recurring interictal-like spikes, always invading the entire width of the neocortex (Fig. 3).
The occurrence of seizures was somewhat higher in the ResEpi group (n=7/31, 22.6% of all BIC-induced activities) than in the NoEpi group (n=3/27, 11.1%, significantly not different, Chi-square test, p=0.25). In six slices (five from ResEpi, one from NoEpi), we detected spatially complex seizures, i.e. parts of the seizure pattern were confined only to the supragranular+granular or to the granular+infragranular layers. The other four seizures (n=2 in ResEpi and n=2 in NoEpi slices) were spatially simple events.
Three slices consecutively generated two different activities (one slice in ResEpi:
first temporally complex, then simple IISs; one slice in TreatEpi: first IIS, then seizure; one slice in NoEpi: first seizure, then IIS). Furthermore, one slice from ResEpi simultaneously generated two independent and spatially distinct IISs (one supra-gran, and one gran-infra). In this case, the activity emerging in the supragranular layers was similar to SPAs generated in physiological solution. Considering these as distinct activities, we analysed 16 IISs and 7 seizure activities in slices derived from ResEpi, 4 IISs and 1 seizure from TreatEpi, 1 IIS and 1 seizure from NoMed and 13 IISs and 3 seizures from NoEpi.
In summary, we distinguished four types of synchronous activities in the human neocortex, in vitro. SPAs (1) were spontaneously generated in physiological solution in all patient groups, while spontaneous interictal-like discharges (2) appeared only in epileptic patients (not investigated in this study, for details see Tóth et al., 2018). In BIC bath, these two spontaneous activities disappeared, and two other types of synchronies emerged in tissue from both epileptic and non-epileptic patients: IISs (3) and seizures (4). IISs always had a spatially and temporally simple morphology in NoEpi slices, whereas they showed several combinations of spatially and temporally simple and complex manifestations in tissue of ResEpi patients.
Characterization of SPAs and BIC-induced activities
To shed light on characteristics related to epileptic mechanisms, in this analysis we compared slices derived from patients in the ResEpi group with those from the NoEpi group.
In 12/16 (75%) and 6/13 (46%) cases in the ResEpi and NoEpi groups, respectively, the slices generated recurrent IISs, while in the remaining 4 and 7 cases, respectively, one single IIS event was detected during the entire recording interval (see Methods). The recurrence frequency of SPAs was 0.81±0.54 Hz and 1.08±0.64 Hz in slices derived from ResEpi and NoEpi groups, respectively (Table 4, Fig. 1D, see also Tóth et al., 2018). The recurrence frequency of all IISs was significantly lower than that of SPAs (ANOVA, p<0.0001): in ResEpi slices it was 0.09±0.15 Hz (5.23±9.03 min-1), whereas it was 0.02±0.02 Hz (0.88±1.09
min-1) in NoEpi slices (ResEpi and NoEpi are significantly not different, t-test, p=0.16).
Recurrent seizures emerged only in tissue from epileptic patients (6/7 seizure activity in the ResEpi group, 1/1 in TreatEpi group), while all three seizures generated in slices from NoEpi group were single seizures. The frequency of seizures was very low: 0.007±0.007 Hz (0.42±0.42 min-1) in ResEpi slices, and 0.002±0.001 Hz (0.14±0.05 min-1) in NoEpi slices (significantly different from SPA, Kruskal-Wallis ANOVA, p<0.0001, but not different from IIS). For easier reading, we give mean±standard deviation (st. dev.) in the main text, but in the Tables both the median [1st and 3rd quartiles] and the mean±st. dev. are provided.
The duration of the different synchronous activity types (SPA, IIS, seizure) were calculated using different methods, thus, they cannot be compared. The average length of the SPAs was 68.8±36.6 ms in ResEpi slices, and 41.6±18.9 ms in NoEpi slices (ResEpi and NoEpi are significantly different, t-test, p<0.01). The average duration of the IISs was 0.36±0.23 s in the ResEpi group and 0.44±0.16 s in the NoEpi group. The average lengths of seizures were 21.75±4.44 s and 24.19±3.48 s in ResEpi and NoEpi groups, respectively (significantly not different between ResEpi and NoEpi, t-test, p=0.42 for IIS length, p=0.43 for seizure length). As the length of the different activity types were calculated with different methods, we do not compare them. However, note the considerable differences (see also Fig.
1).
The LFPg amplitude of SPAs was 38.76±23.67 µV and 26.97±19.03 µV in slices from ResEpi and NoEpi patients, respectively (Table 4). The LFPg amplitude of IISs was about one magnitude higher, than that of SPAs: it was 247.84±240.92 µV in ResEpi and 348.32±322.49 µV in NoEpi slices (IIS significantly different from SPA, ANOVA p<0.0001).
The LFPg amplitude of seizures was significantly higher than that of IISs and SPAs:
526.24±259.06 and 847.09±161.46 µV in ResEpi and NoEpi, respectively. Multiple unit activity (MUA) amplitudes during SPAs were 1.28±1.28 µV and 1.27±1.43 µV, while that of IISs was 12.05±8.52 and 22.38±7.49 µV in ResEpi and NoEpi (IIS MUA significantly different from SPA MUA, Kruskal-Wallis ANOVA, p<0.0001), respectively. MUA amplitude was also significantly higher during seizures than during SPA (Kruskal-Wallis ANOVA, p<0.0001): 16.35±5.47 and 37.01±8.59 µV in ResEpi and NoEpi, respectively (Fig. 1D).
Interestingly, MUA during both IIS and seizure was significantly higher in NoEpi than in ResEpi slices (Kruskal-Wallis ANOVA, IIS: p<0.05, seizure: p<0.01).
Current source density (CSD) analysis showed that sink-source pairs were restricted to the layers where the LFPg transients were observed (Fig. 1). The most frequent CSD pattern associated to SPA was a sink-source pair, or a source-sink-source triplet in the supragranular
layer, since most of the SPAs were detected in the supragranular layer (see also Köhling et al., 1999). In case of IISs/seizures, sinks and sources were found in all layers of the neocortex, since these activities usually invaded the entire width of the neocortex. As in an earlier study (Köhling et al., 1999), the number and exact location of CSD sinks and sources was variable during both SPAs and epileptiform activities. Sinks and sources usually appeared simultaneously during SPAs, whereas during epileptiform activity the initial sink or source was followed by other sinks and sources. Sink or source or sink-source pair were observed as initial CSD deflection during IISs and seizures. The initial CSD transient could appear in any layer of the neocortex, and we could not find any link between the CSD pattern and the simple or complex nature of the IISs.
The power of the LFPg signal was increased both in the ripple (130-250 Hz) and the fast ripple (300-700 Hz) bands during SPAs, as in our previous study (Tóth et al., 2018).
During BIC-induced IISs the power of the signal was elevated in all examined frequency ranges, including ripple and fast ripple bands (Fig. 1, Table 5.). In case of seizures, we could not detect peaks in the ripple and fast ripple bands, since the LFPg power was homogeneously increased in all frequencies. SPAs showed an increased power of high-frequency oscillations (HFOs, both ripple and fast ripple bands) in 17/19 cases in the ResEpi group, in 3/6 cases in the TreatEpi group, whereas ripple and fast ripple power was enhanced in 17/22 and 14/22 cases, respectively, in recordings from NoEpi cases. Ripple and fast ripple power increase during SPAs in the ResEpi group was 3.67±1.82 dB and 3.27±1.57 dB, respectively, and was similar in the NoEpi group: 3.09±1.59 dB and 3.07±1.60 dB in ripple and fast ripple bands, respectively. HFO power increased during all IIS activities in recordings from tissue derived from epileptic patients (ResEpi n=15 activities, TreatEpi n=4 and NoMed n=1), whereas it was increased in n=11/13 cases in recordings from the NoEpi group. The power increase of HFOs linked to IISs was significantly higher than during SPA, 12.53±5.00 dB and 11.75±4.67 dB for ripples and fast ripples, respectively in the ResEpi group, and in NoEpi: 16.05±3.32 dB and 15.77±3.30 dB for ripples and fast ripples, respectively (both ripple and fast ripple power were significantly different between SPAs and IISs, Mann-Whitney U test, p<0.0001, and NoEpi fast ripple power was significantly different from ResEpi and TreatEpi, One-way ANOVA and Tukey honest significant difference test, p<0.05). The peak frequency of both ripples and fast ripples linked to SPAs or to IISs was lower in the ResEpi than in the NoEpi group, although the differences were not significant (for values see Table 5).
In summary, remarkable differences were observed between the properties of SPAs, IISs and seizures. The recurrence frequency was lower, while the LFPg and MUA amplitudes
and the high frequency power were higher in case of IISs and seizures compared to SPAs.
When comparing patient groups, only several features of the synchronies were different. A tendency of generating higher percentage of recurring epileptiform activity was observed in slices from ResEpi compared to NoEpi patients. SPA length and IIS fast ripple power were higher, whereas IIS and seizure MUA were lower in ResEpi than in NoEpi tissue.
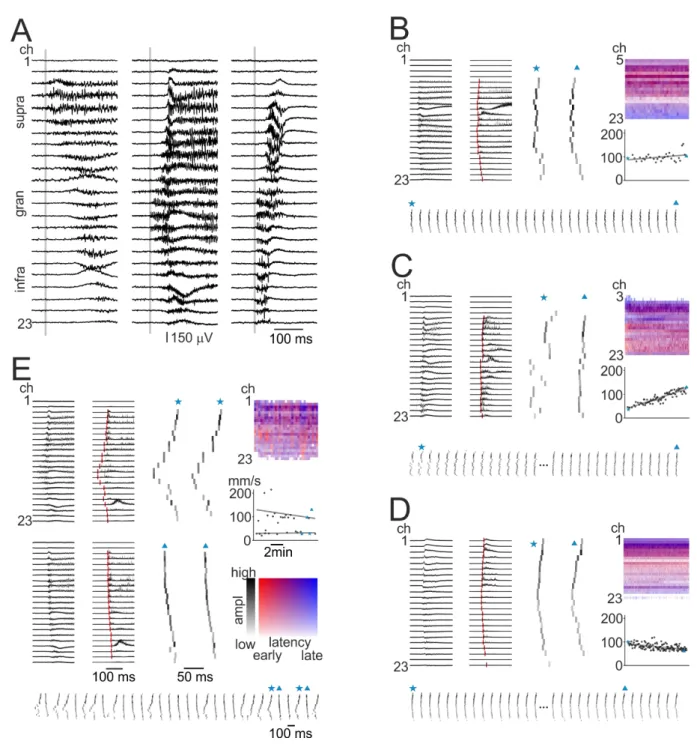
Initiation and propagation of BIC-induced activities across cortical layers
Most of the IISs (Fig. 2) and all seizures (Fig. 3) invaded the entire width of the neocortex. In cases of spatially complex events, supragranular and infragranular layers were separately activated (Figs. 2E and 3A-B). Supra- and infragranular layers presumably have different roles in interictal spike generation: in vivo spontaneous interictal spikes propagated from other brain areas usually showed an initial activation in the granular or the supragranular areas, whereas de novo generated spikes were initiated in the infragranular layers (Ulbert et al., 2004a). Although propagation from distant sites is excluded in slice preparations, the question arises whether certain layers are more likely to induce synchronous events while others follow, or whether BIC-induced events appear synchronously throughout the entire width of the neocortex. We aimed to explore this question, and therefore we determined the initiation site of the IISs and found several different interlaminar spreading patterns. The initiation site could be in any of the neocortical layers (Fig. 4A): in supragranular layers (n=12 IISs from ResEpi, n=9 from NoEpi), in granular layer (n=4 from ResEpi, n=2 from NoEpi), or in infragranular layers (n=6 from ResEpi, n=2 from TreatEpi). In two recordings (one from ResEpi, the other from NoEpi) we detected two different types of IISs: one was initiated in the supragranular layers and spread to the infragranular layers, and one was generated in the granular layers and spread to the two other layers (Fig. 4E). In all other cases, the initiation layer and spreading directions were stable within one recording. Spatially complex IISs were generated in the granular (n=1) or in infragranular layers (n=1), however, this was not constant during the recording (see Fig. 2E).
We performed a more detailed analysis on how IISs spread across the layers of the neocortex in 12 recordings with recurrent IISs (9 from ResEpi, 1 from TreatEpi, 2 from NoEpi) and in 3 with recurrent seizures (all from ResEpi). In this analysis we included recordings with at least 6 (but up to 166) IIS events, to determine of a precise propagation speed and exclude large bias coming from the eventuality of single epileptiform events. Since seizures occurred with a considerably lower frequency, therefore we analysed recordings with 3 to 5 seizures.
Please, note, that our analysis reveals the features of the propagation of epileptic events in the
depth (across the layers) of the neocortex, and not the horizontal spread over larger areas. We determined the initiation time point of every event on each channel, as well as examined its spreading direction and speed (Fig. 4B-E, for details see Methods). In most cases (10/12 recordings), we observed a jitter among the channels over time, i.e. the starting point of the IIS was on different channels in the course of the consecutive events. Furthermore, the activation sequence of the channels was similarly variable as the starting point, although the spreading direction remained constant.
The propagation speed of IISs was also examined within the neocortical column (for details see Methods). We determined a propagation speed for each event and examined how it changes with time. Usually, it was constant throughout the recording (Fig. 4B), however, we found intracortical propagation with increasing (n=3, Fig. 4C) and decreasing (n=1, Fig.
4D) speed as well. The increase/decrease in speed was due either to a faster/slower activation of neighbouring channels (n=1 increased, n=1 decreased) or to the decrease in the jitter observed at channel activation (n=2 increased, Fig. 4B). The average propagation speed of IISs was varying between 19.7 and 98.7 mm/s, with a mean of 51.8±23.7 mm/s in ResEpi and 74.3±39.0 mm/s in NoEpi slices. We observed IISs with low (<30 mm/s) and high (>75 mm/s) propagation speed in both ResEpi and NoEpi slices. In both cases with the two different IIS activation patterns (see above), one IIS had considerably higher propagation speed than the other. When the propagation speed increased over time, it could reach up to a threefold increase (from ~40 to ~120 mm/s). Seizures in ResEpi tissue propagated with a speed of 41.2±12.6 mm/s. The layer of initiation and the propagation speed were not related: high and low speed could be associated to IISs initiated in any layers. We could not find a correlation between the propagation speed of the IISs and the aetiology of the patients. High, medium and low speed IISs were observed in ResEpi slices derived from patients with dysplasia, tumour or hippocampal sclerosis. High speed IISs were detected in NoEpi slices derived from patients with carcinoma metastasis or with glial tumour.
Our observation is that bicuculline-induced population events can be generated in any cortical layer. Although the starting channel can change over time, the layer of initiation remains stable. The direction and the speed of the intracortical propagation were usually constant, with some exceptions when propagation speed increased or decreased throughout the recording.
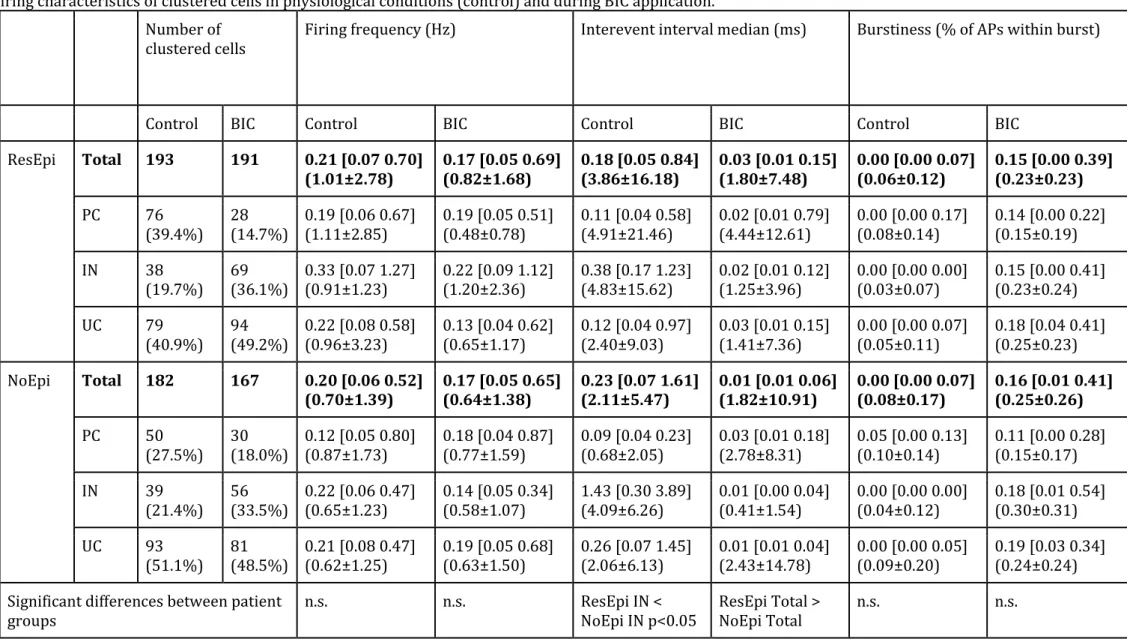
Firing characteristics of single cells
In this analysis we included all files with population activity (SPA/IIS/seizure) and
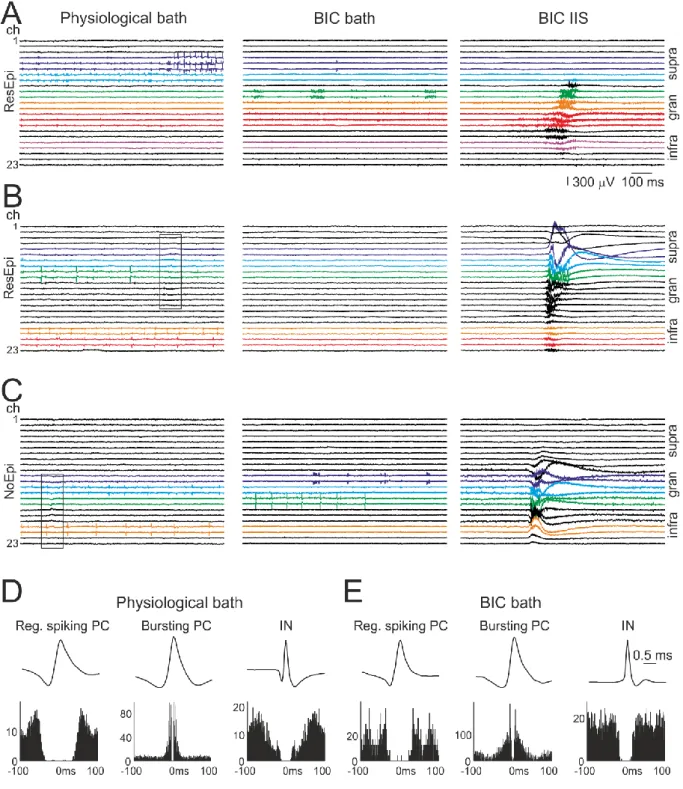
single cell activity from the ResEpi and NoEpi groups. Recordings lacking either synchronous event or single ells were excluded, and only ResEpi and NoEpi recordings were compared to focus on epilepsy-related characteristics. We clustered 384 and 349 single cells in recordings from ResEpi and NoEpi groups, respectively. In ResEpi 193 single units (from 16 slices derived from 13 patients, with an average±standard deviation of 10.9±6.7 neurons/slice and 13.4±7.9 neurons/patient) were clustered in control conditions and 191 (from 18 slices derived from 15 patients, with 11.1±5.4 neurons/slice and 14.0±11.2 neurons/patient) during application of BIC, whereas in NoEpi 182 cells (from 14 slices derived from 11 patients with 13.3±12.7 neurons/slice and 16.9±20.8 neurons/patient) in control and 167 (from 14 slices derived from 10 patients, with 11.6±7.6 neurons/slice and 16.3±14.7 neurons/patient) in a solution containing BIC (Table 6). In most cases we clustered cells from one slice per patient, but in samples derived from five patients (2 ResEpi and 3 NoEpi patients) we could analyse two or three slices per patients. To increase the number of cell/IIS comparison, we included two further recordings from the TreatEpi group with high numbers of neurons (n=39 single cells in 2 slices) and IIS events. When comparing cellular discharge in physiological conditions and in BIC-bath, we noticed several patterns of firing change. In physiological solution, spontaneously discharging cells were observed mainly in the supragranular and the infragranular layers. During BIC application, the majority of these cells became silent, while other – previously not detected – spontaneously discharging neurons appeared on other recording channels (Fig. 5). We noticed that cells located in the granular layer often showed a very characteristic bursting-like firing pattern (Fig. 5A, C), which was very rarely seen in control conditions. In several cases in BIC-bath, neurons discharged only during the BIC- induced events and were silent between the events (Fig. 5B, n=1/12 with seizures in ResEpi, and n=7/33 with IISs, 6 from ResEpi, 1 from NoEpi), even if spontaneous neuronal activity was observed in physiological solution before the application of the BIC.
We separated excitatory principal cells (PC) and inhibitory interneurons (IN) based on their action potential shape and firing patterns (for details see Methods, Fig 5D-E). For the analysis of the cellular properties in relation with epilepsy, cells in the TreatEpi group were excluded, and only ResEpi and NoEpi were compared. The ratio of detectable (i.e.
spontaneously firing) PCs was higher than that of INs during physiological conditions in tissue from both epileptic and non-epileptic patients: ResEpi: 39.4% PC, 19.7% IN and 40.9%
unclassified cells (UC), NoEpi: 27.5% PC, 21.4% IN and 51.1% UC. Interestingly, this ratio changed in BIC bath, i.e. spontaneously discharging INs were more abundant than PCs, both in ResEpi and NoEpi tissue (Table 6, ResEpi: 14.7% PC, 36.1% IN and 49.2% UC; NoEpi:
18.0% PC, 33.5% IN and 48.5% UC, cell proportions in BIC are significantly different from that in control, both in ResEpi and NoEpi, p<0.0001 and p<0.05, respectively, Chi-square test). The ratio of intrinsically bursting PCs was low in both patient groups: in ResEpi 1.6%
in control condition and 2.1% in BIC, in NoEpi 2.7% in physiological and 1.8% in BIC bath.
The firing frequency of neurons was somewhat higher in ResEpi tissue than in NoEpi tissue (Table 6). Furthermore, in physiological bath, INs showed a slightly higher average firing frequency than PCs, both in ResEpi and NoEpi slices. Differences in the firing frequency were not significantly different. In BIC bath, the overall firing frequency of the cells did not change, although the vast majority of the cells fired with a very high frequency during the BIC-induced events. This latter phenomenon was reflected in the significantly increased burstiness together with the decrease of the interevent interval of all neuron types during the application of BIC, compared to control conditions (for values and significances see Table 6).
In summary, other neurons were spontaneously active during physiological conditions than in BIC bath. Higher numbers of PCs than INs were spontaneously firing in physiological bath, while this ratio was reversed during the application of BIC. The average firing frequency remained unchanged in BIC bath, with a modified firing pattern: the neurons intensely discharged during the epileptiform events and tended to be more silent between the events.
Neuronal firing related to synchronous activity
We aimed to examine the mechanisms of synchrony initiation in the human neocortex, therefore we investigated the activity of single neurons during SPAs, IISs and seizures with several approaches.
First, we verified whether a combined discharge of single cells forms a build-up period before SPAs and BIC-induced events, as in the rodent hippocampus before interictal- like events (Menendez de la Prida et al., 2002; Cohen et al., 2006; Wittner & Miles, 2007).
Neuronal firing preceding the SPA events was only occasionally seen. Build-up discharge was observed in 7/21 SPAs in ResEpi and in 6/22 SPAs in NoEpi tissue. The existence of the neuronal discharge before the events was rare within one recording, we noted cellular firing before in 1.6±4.9% of the events in ResEpi and only in 0.1±0.1% of the events in NoEpi tissue.
In recordings with IISs, we observed neuronal firing before the events more often: in 7/17 IISs in the ResEpi and in 7/14 IISs in the NoEpi group (Fig. 4A). We detected cell firing before the events in 21.9±40.6% of the events in the ResEpi, and in 30.3±41.2% in the NoEpi group. Increased neuronal firing was observed up to several minutes before seizures in
epileptic patients both in the neocortex (Truccolo et al., 2011) and the hippocampus (Lambrecq et al., 2017). In contrast, during BIC-induced seizures in vitro, cells were always silent before the seizures (n=7 in ResEpi and n=3 in NoEpi), they started to fire abruptly with the first large LFPg component, and usually showed an intense firing at the late, decreasing component (Fig 3C).
Single cell firing during SPA
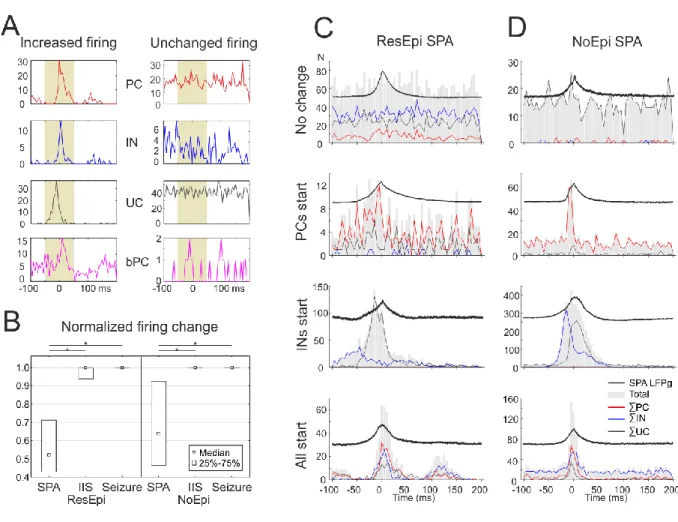
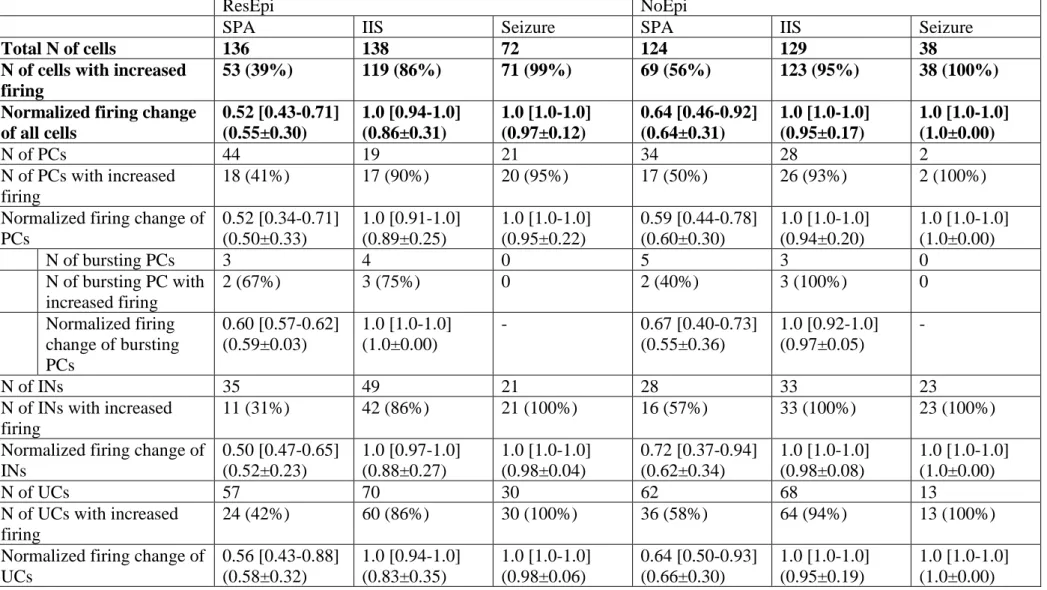
We examined how single cells behaved during SPAs emerging in physiological solution. To get insight into the synchronization mechanisms, we analysed how neurons change their firing during SPAs, by computing the firing change during the events compared to baseline periods (see Methods, Fig 6A). The normalized firing change of all cells was 0.55±0.30 in ResEpi, (n=136 cells in 15 files with SPA) and 0.64±0.31 in NoEpi tissue (n=124 cells in 14 files with SPA, Fig 6B). Single cells were considered to have an increased firing if their normalized firing increase was equal or more than 0.6 (an increase to at least 150%).
Slightly more cells increased their firing during SPA in NoEpi (56%) than in ResEpi (39%) slices (Table 7). We did not find significant differences between the cell types, similar percentages of PCs, INs and UCs showed increased discharge during both ResEpi and NoEpi SPA, with comparable normalized firing change. As the activity of burst firing PCs was related to epilepsy and to epileptiform discharges (Connors, 1984), we separately investigated the activity of this special neuron group. Out of the three bursting PCs detected in ResEpi tissue, the firing of two was increased during SPA, while one remained unchanged. In the NoEpi tissue 2/5 bursting PCs increased their firing during SPA (Table 7, Fig 6A).
Next, we examined how excitatory or inhibitory cells participate in the generation of SPAs. Therefore, we analysed the combined firing of all PCs, all INs and all UCs within each recording with SPA both in ResEpi and NoEpi tissue. In line with the above finding, i.e. about half of the cells showed increased firing during SPA, in several cases no clear population firing enhancement was visible during SPA (n=6/15 SPA in ResEpi and 5/14 SPA in NoEpi tissue, Fig 6C-D). Furthermore, we could not determine a constant sequence of cell type activation, as both excitatory or inhibitory neuronal population could start firing while the other followed (Fig 6C-D). In ResEpi INs started to discharge in n=2 cases while PCs started in n=4 cases, in NoEpi both INs and PCs started to fire in three and three cases. UCs or all cell types together were also observed to elevate their discharge at the beginning of the SPAs. To estimate the impact of the firing of PC and IN populations on SPA generation, we calculated the ratio of PC and IN action potentials relative to all single cell firing during SPAs (see Methods). We
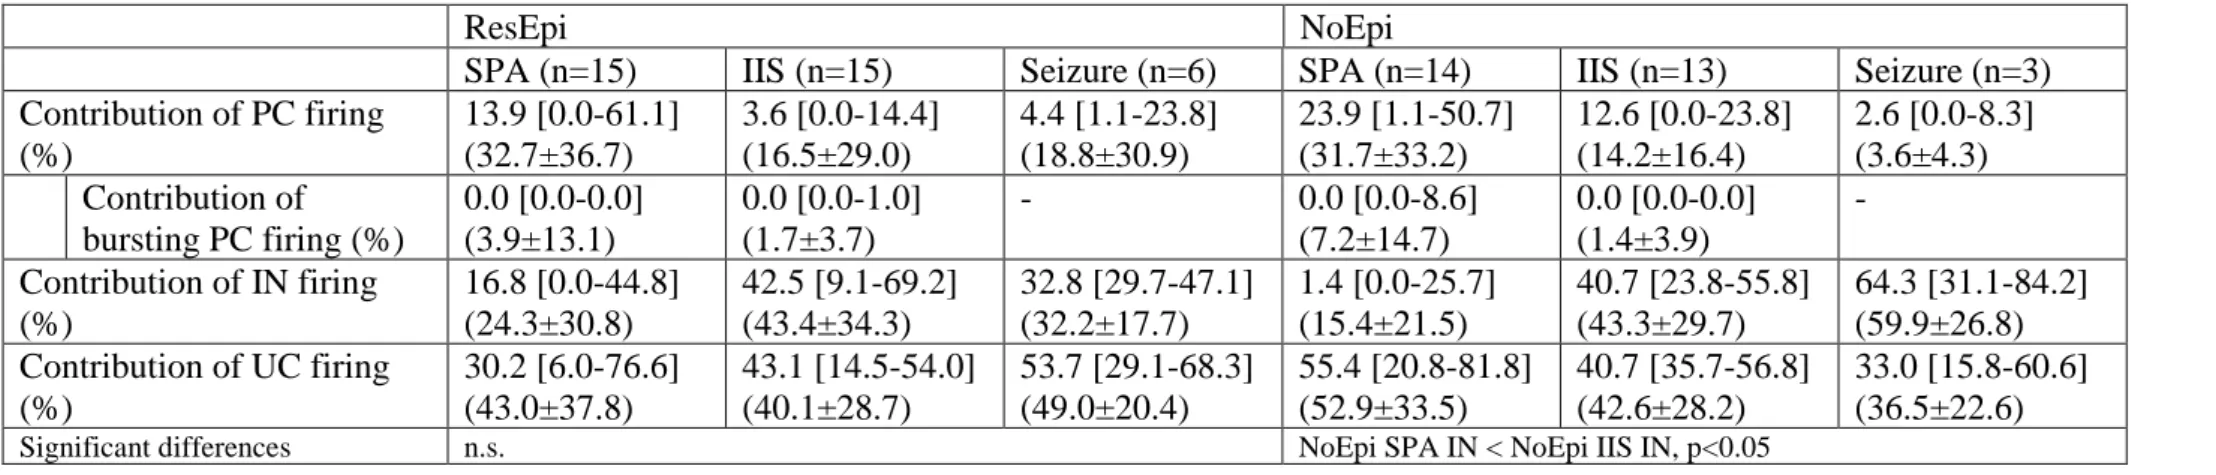
found that 32.7±36.7% of the APs derived from PCs, while 24.3±30.8% came from INs during ResEpi SPA, and 31.7±33.2% from PCs and 15.4±21.5% from INs during NoEpi SPA. The contribution of bursting PCs was 3.9±13.1% in ResEpi and 7.2±14.7% in NoEpi slices in the overall firing (Table 8, Figure 7E).
In summary, about half of the cells increased their firing rate during SPA, both in ResEpi and NoEpi tissue. No significant differences were found between patient groups or cell types. Either PCs or INs could start discharging at the beginning of the SPAs, while the other cell types followed. PCs contribute to the overall firing slightly more than INs.
Single cell firing during BIC-induced activity
Results focussing on the role of excitatory and inhibitory cell types in the initiation of synchronies related to epilepsy provided controversial data. When GABAA receptors were blocked by BIC in slice preparations, bursting pyramidal cells were shown to induce interictal- like events both in the hippocampus (Cohen et al., 2006; Wittner & Miles, 2007), and the neocortex (Connors, 1984) of rodents. On the other hand, interneurons discharged before pyramidal cells during spontaneously occurring interictal-like activity in the human subiculum, in vitro (Pallud et al., 2014). Furthermore, a heterogeneous cell population showed a complex interplay during interictal spikes in the human neocortex of epileptic patients (Keller et al., 2010). The beginning of seizures was also associated to glutamatergic (Huberfeld et al., 2011) or GABAergic (Elahian et al., 2018) processes, depending on the seizure morphology. To clarify the role of excitatory and inhibitory neuronal populations in the generation of epileptiform activity, we determined the normalized firing increase of neurons, as well as the contribution of PCs and INS during IISs and seizures and compared these data to those related to SPAs.
The normalized firing change during IISs was significantly higher than during SPA (Kruskal-Wallis ANOVA, p<0.001), and even higher during seizures (significantly different, p<0.001), both in ResEpi and NoEpi slices (ResEpi IIS: 0.86±0.31, seizure: 0.97±0.12; NoEpi IIS: 0.95±0.17, seizures: 1.0±0.0, see Table 7). During ResEpi IIS and seizures 86% and 99%
of the cells increased their firing rate, respectively (SPA-IIS-seizure significantly different, Chi square test, p<0.001), whereas during NoEpi IIS and seizures 95% and 100%, respectively (SPA-IIS-seizure significantly different, Fisher Exact Test, p<0.001). Similar to SPAs, no differences were seen between cell types: similar proportions of PCs, INs and UCs showed increased firing with similar values of normalized firing increase (for values and significances
see Table 7). Concerning intrinsically bursting PCs, 3/4 and 3/3 were found to increase their firing rate in ResEpi and NoEpi IIS, respectively. No bursting PCs were clustered in the recordings with seizures.
Next, we performed PETHs by computing the discharge of all PC, all IN and all UC cells separately, in each recording with IISs and seizures, as well as examined the timing of intrinsically bursting PCs, separately. To increase the number of IIS examined, beside the 14 recordings in ResEpi and the 13 in NoEpi group, we included two more recordings with high numbers of IIS events from the TreatEpi group. Contrary to our expectations, i.e. (bursting) PCs initiate IISs (Connors, 1984; Wittner & Miles, 2007), we found that in most cases INs fired earlier than PCs in our human neocortical disinhibition model of epilepsy. IN firing preceded the discharge of other cell types (PC and UC) during IISs in 7/14 recordings in the ResEpi group and in 5/13 recordings in the NoEpi group (Fig. 7). PCs began the discharge pattern in three and in two cases in ResEpi and NoEpi slices, respectively. In all the remaining recordings (n=4 in ResEpi, n=2/2 in TreatEpi and n=6 in NoEpi), UC cells started to fire during the IISs, while other cells followed (ResEpi and NoEpi significantly not different, Fisher Exact Test, p>0.6). Four intrinsically bursting PCs were discharging during IISs in ResEpi, three in TreatEpi and three in NoEpi slices. All ResEpi, all TreatEpi and one NoEpi bursting PCs fired later than the INs detected in the same recording (Fig. 7B, C), and the remaining two bursting PCs in the NoEpi tissue discharged later than all UCs (n=7) of the same recording (Fig. 7D).
Similar to IIS, INs tended to discharge before PCs during the initial phase of seizures.
In the ResEpi group, INs started to fire together with UCs in 3/6 cases, while PCs followed.
PCs and UCs initiated seizures in 2/6 and 1/6 cases, respectively. In the NoEpi group, in all cases (n=3) INs started to discharge (once together with UCs) while PC followed.
We analysed how a neuronal population of a given slice generates SPA and epileptiform activity. As we observed SPA in the majority of the slices before inducing IIS/seizure, we verified whether the same neuron type initiated SPA and IIS/seizure in the same slice. In samples from ResEpi patients we observed similar initiator neuron type in 2/14 slice, and in 2/13 in NoEpi slices. In the remaining slices different cell types initiated SPAs than IISs/seizures.
To see the contribution of excitatory and inhibitory discharge in epileptiform synchronies, we calculated the percentage of APs given by PCs and INs during the initial firing of IISs and seizures. As in the ratio of clustered PCs and INs, we found a switch in excitatory and inhibitory contribution in the firing compared to SPAs, only 16.5±29.0% and 12.2±15.4%
of the APs came from PCs in ResEpi and NoEpi IIS, whereas 43.4±34.3% and 46.4±29.1% of
the APs derived from INs, respectively (Table 8). Burst firing PCs contributed to the total firing in 1.7±3.7% in ResEpi and in 1.1±3.6% in NoEpi IIS. In case of seizures, the values for PCs and INs were not different from IISs: ResEpi seizures: 18.8±30.9% from PCs, 32.2±17.7% from INs, NoEpi seizures: 3.6±4.3% from PCs, 59.9±26.8% from INs.
Next, we analysed the correlation between the propagation speed of IISs (see above) and the cellular contribution. Unclassified cells discharged at the initial phase of the two NoEpi and one TreatEpi slice examined for propagation speed. In the ResEpi slices we could not find any relation between highly contributing cell type and propagation speed. High speed IISs were initiated by either INs or all cell types together, medium speed IISs were initiated by PCs, or IN+UCs or PC+UCs. Low speed IISs were initiated by PCs, INs or by IN+UCs.
We experienced that almost all neurons, independently from their type, increased their firing rate during IISs and seizures. In most of the cases, INs started to discharge at the onset of the epileptic synchronies, while other neurons followed, but PCs and UCs were also found to fire at the initial phase of the hypersynchronous events. During both IISs and seizures INs provided higher ratio of action potentials to the overall firing than PCs, which is in contrast to SPAs where PCs contributed more than INs.