THERMODYNAMIC FUNCTIONS ALONG THE ORTHOBARIC LIQUID LINE
P. / . Hunter* and J. S. Rowlinson
Department of Chemical Engineering and Chemical Technology Imperial College of Science and Technology , London, England
1. Introduction 1 2. The Thermodynamic Functions 2
3. Correlation of Experimental Results 3
3.1. Argon 4 3.2. Nitrogen 9 3.3. Oxygen 10 4. Singularities at the Critical Point 13
References 15
1* Introduction
When one speaks of a liquid one usually means the fluid state which is, at each temperature, in equilibrium with its saturated vapor. The succession of fluid states that satisfy this condition form the orthobaric, or saturation line, which runs from the triple point to the critical point.
It is the purpose of this chapter to define the change of thermodynamic functions along this line, to describe how the functions can best be obtained from sets of measurements that are often in conflict, and to tabulate such functions in detail for three simple liquids: argon, nitrogen, and oxygen.
There are singularities in all functions at the critical point and the most recent evidence on the nature of these is reviewed briefly in Section 4.
The notation and methods of correlation used here are those set out previously by one of us [Rowlinson, 1]. The tables are a revision of some of those in the same book and detailed references are given only
♦Present address: British Petroleum Ltd., British Petroleum Research Centre, Sunbury-on-Thames, Middlesex, England.
1
to work published since 1957. Work published up to January, 1966, has been included in these tables.
The units used are cgs units with a standard atmosphere of 1.01325 X 10⁶ dyn cm~2, an absolute zero of —273.15°C, and molecular masses on the "unified" scale of 12C = 1 2 .
2* The Thermodynamic Functions
Since the succession of orthobaric states form a line in PVT space, the orthobaric liquid is defined completely by specifying either the pressure or the temperature. The latter is chosen here. The pressure and volume along the line are denoted pa and Va , where the subscript σ denotes saturation. The following derivatives are defined:
The coefficient of thermal expansion at saturation ασ = — I 1 (1) The coefficient of isobaric thermal expansion ocv = — I I (2) The coefficient of isothermal compressibility βτ = —~ — I ——J (3) The coefficient of adiabatic compressibility ßs = — — \-~ψ-) (4) The slope of the vapor pressure curve γσ = I JL j (5) The thermal pressure coefficient yv = ( - ^ r ) (6) The three heat capacities used are
c. = r(-f^, c , - r ( ^ . c, = T(-§-)
r(7)
These derivatives are mutually related by the following equations [1, Chapter 2]:
a» = βτΥν (8)
<*„ = <*p — βτΥο = «»[I — (YOIYV)] = ßiiYv — Ya) (9)
ßrlßs = CJCy (10) ßT-ßs= TVaJlC, > 0, ß? - βτ1 = TVyflCy >0 (11)
Cv = Cy+ TV«pYv =Ca+ Τ¥αΡγσ (12)
THERMODYNAMIC FUNCTIONS 3 Here, ßs is related to the equilibrium speed of sound W by
W* = vjJtßs (13) where v denotes the molar volume, and Ji is the molar mass (or molecular
weight).
The rates of change of all other thermodynamic functions, energy, enthalpy, entropy, and the two free energies can be written in terms of these derivatives.
3. Correlation of Experimental Results
The properties most commonly measured are the vapor pressure pa
and the orthobaric volume Va as functions of T\ the equation of state, that is, p = f(V> T) of the homogeneous liquid phase; the heat capacity at saturation Ca ; and the speed of sound W. The measurements of pa
and Va yield ya and ασ on difFerentation, those of the equation of state yield ap , βτ , and yv , and those of W yield ßs .
There is no unique way of combining such measurements to produce the "best" thermodynamic functions. The scheme used previously [1]
and followed here is based on the fact that some of the properties can be measured with errors that are negligibly small compared with the errors in other properties. The most important of these primary properties are pa and Va, and it is assumed that these can be measured precisely.
They and their derivatives with respect to temperature are assigned values which remain unchanged throughout later correlations and smoothing. One thermal property is needed to complete the primary set and this is chosen to be Ca since this is the heat capacity that is most directly related to experiment [1, pp. 40-43].
The secondary properties are W> ßs (either from W or measured directly) and ocp , βτ , and yv from the slopes of isotherms and isochores.
Exceptionally, as for argon, there are direct measurements of Cv, and for higher boiling liquids there are sometimes measurements from a flow calorimeter that lead most directly to Cp . The key equation of this scheme is [1, p. 47].
ßsC„ + TVaJjot, + ßjy.)
ΡΤ Ca-TVya{oca+ßsya) W
This allows βτ to be obtained from ßs by using as additional parameters only the primary properties on the right-hand side.
The correlation and smoothing of the secondary properties cxp , ßs ,
and βτ is made by converting them all to yF. A rough value of yv
suffices to obtain a.p from ασ [Eq. (9)] at all except the highest tem- peratures, and these values can be used with βτ (from ßs) [Eqs. (8) and (14)] to give accurate values of γν appropriate to the known speed of sound W. The coefficient yv is chosen as the function on which to base all correlations since it has the important property of remaining finite at the critical point and, further, of becoming there equal to γσ which is known independently from the vapor pressure curve.
The application of these principles is illustrated in the examples below.
3.1. ARGON
Since 1957 the vapor pressure has been measured by Michels et al. [2]
from 16 atm to the critical point and by van Itterbeek et al. [3] from 1 atm to the critical point. Both agree well with each other and with the earlier work cited previously [1, p. 50], although the results of van Itterbeek show the greater scatter (1-2 parts per 1000) below 10 atm and are higher than those of Michels et al. by about the same amount at higher pressures. Michels et al. determined the critical point also and their results, 150.86°K, 48.34 atm, and 74.6 cm3 mole- 1 are adopted here. There are several new and very accurate measurements of the triple-point pressure
Pool et al. [4] 516.82 ± 0.04 mm Hg Flubacher et al. [5] 516.85 ± 0.02 mm Hg Thomaes and Steenwinkel [6] 516.85 ± 0.04 mm Hg Jones et al. [7] 516.83 ± 0.01 mm Hg The recommended value is 516.83 mm Hg or 0.68004 atm.
The molar volume νσ has been measured by Michels et al. [2] from 120°K to the critical point, by van Itterbeek and Verbeke [8] from 86° to 90°K, and by van Itterbeek et al. [9] from 90° to 150°K. Pool et al. [10] have remeasured the density at the triple point. At low temperatures these results agree with earlier work [1, p. 50] but the measurements at higher temperatures enable a greater accuracy to be achieved above 120°K.
There were three sets of measurements of the speed of sound before 1958, one by Liepmann [11] and one by Gait [12], which agreed well together, and one by van Itterbeek and Verhaegen [13], which was 2% higher. A mean was recommended previously. However, new measurements by van Itterbeek et al. [14] and measurements by Dobbs and Finegold [15] now make it certain that the earlier results of
THERMODYNAMIC FUNCTIONS 5 van Itterbeek are in error, probably because of the presence of dissolved oxygen [14]. The four consistent sets of measurements are shown in Fig. 1. Probably W is now known to about 1 part per 1000, which is
860
E 8 4 0
820
84 86 88 90 T°K
FIG. 1. The speed of sound in liquid argon : ( O ) van Itterbeek et al. [ 14], ( D ) Galt [12], (Δ) Liepmann [11], and ( v ) Dobbs and Finegold [15].
equivalent to 2 parts per 1000 in ßs, from the triple point to 90°K.
There are no new measurements of Ca and those cited previously are readopted. Bagatskii et al. [16] have measured Cv for both the one and two phase systems along the critical isochore. By approaching the critical point from above they show that Cv of the one phase system is probably infinite at the critical point. This is discussed below. Their results for the two phase system lead also to an infinity at the critical point, but at lower temperatures can be used to derive approximate values for Cv of the single liquid phase. From equations derived previously [1, p. 41]
cf = cvl + Tv\oialflßTl + T(v™ - vl){d*pjdT\ (15) where the superscript (2) indicates the two phase system, and where
v(2) was equal to vc in the measurements of Bagatskii et al. The three terms on the right-hand side are all of similar size and so this equation does not give good values of cvl
y since ασ , βτ, and (d2pldT2)a are not known accurately at high temperatures. Nevertheless, the equation is useful since the direct measurement of Cv is also difficult.
Van Itterbeek and Verbeke [8] have measured volume as a function of pressure along four isotherms between 80° and 91°K. They fit the density by a quadratic function in the pressure and so obtain ocp , βτ , and yv. The isotherms of van Itterbeek et al. [9] yield the same coefficients from 90° to 130°K. Michels et al. [2] obtained γν directly from the slopes of isochores above 120°K.
22 20 18 16
LU | 4
I
1 2>? io
8 6 4 2
0 80 100 120 140 160
T ° K
FIG. 2. The thermal pressure coefficient of liquid argon: ( o ) Michels et al. [2], (Δ) Walker [17], ( ν ) van Itterbeek et al. [8, 9], and (□) from the speed of sound, Fig. 1.
Figure 2 shows yv obtained these results, from the speed of sound, and from the isochores measured by Walker [17]. Other results obtained before 1958 are clearly of lower accuracy and can now be ignored.
The curve drawn in Fig. 2 gives greatest weight at low temperatures to the speed of sound and at high temperatures to the results of Michels et al. Walker's results agree with those of Michels et al. at high tem- peratures but disagree with the speed of sound at low. The two sets of measurements of van Itterbeek et al. lie one on each side of the recom- mended line. Once there is a smooth set of values of yv then the other secondary properties immediately follow. The complete set of values is given in Table I, and the three heat capacities are shown graphically in Fig. 3.
The calculation of the configurational part of the thermodynamic functions can be made from these results if the equation of state of the gas and the heat capacity at zero pressure are known [1, pp. 60-70].
Measurements of the equation of state made before 1956 were correlated into smooth self-consistent tables by Din [18]. The more recent results of Michels et al. [2, 19] agree well with Din's tables but enable greater precision to be achieved in the critical region. A new set of configurational
THERMODYNAMIC FUNCTIONS
Z O Ü os
<
S3
(-H U W PQ
ES
os <
o m M O
o os
OH
O
"o 7
Oi
O o
O i
<^ is
<N
VO 00 Tf
»o 00 VO m oo
_| <N oo
vo vo «r> ro © © O N O N O N O N O N O N O N O N
VO
ON
Q! Q! m^- ^- «o vo »^ ^ »o
5
m
<N
ON
o o
00
s
vo 00
o o o
s s
o o ON
CO
o
m r-
o
ON
O
VO
»o 1-H
m «o O
T-H
Tt
ON
O
(N r»
ON
O m O
NO VO
O
o 00
ON
O
VO
•O
O
^ H
00
'"^
00
^ H
CN «o ^H j>
^H fNj Tj" 1^
ΓΝ CN <N <N
VO
© (N VO OO Tt ON
ON ON O O
Ö Ö -î -î
<<t «fr rf O
00 t^ ~H ^
fS r^ ro io «o Γ-
VO VO 00 8
ON
vo
ON 00 co O co
«o co
en O (N co
«o co
O co CM
VO O
a a,
00 00 OO ON
m ,_;
O
ON
1-H
<N
' — I
<N
«n ON
CN m*
8
Γ^ VO Tf
O oo «o
VO
O
o <N
o
O Ö
CN
O
VO <N
y^i
co
?
<*
co oô
VO 00
6
»o
* ■ »
C0
■4-»
u o
C0
u a
e O
a ox) .G
"o
100 l·
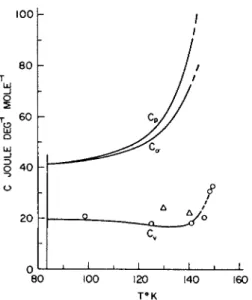
FIG. 3. The heat capacity of liquid argon. The smoothed curves for Cv , Ca , ad Cv are from Table I. The experimental values ( O) are those of Walker [17], and ( Δ) the indirectly obtained values of Bagatskii et al. [16].
properties (denoted by a prime) and of the latent heat of evaporation (Ah) is shown in Table II. This differs little from that previously recom- mended [1, p. 64], but it is now possible to give a value to that theore-
TABLE II
CONFIGURATIONAL PROPERTIES OF O R T H O B A R I C LIQUID ARGON
Ta
(°K) 83.81*
85 87.28*
90 95 100 105 110 120 130 140 150.86c
Ah
6610 6570 6517 6440 6290 6110 5900 5660 5100 4350 3350 0
K (joules mole-1)
-5940 -5910 -5840 -5760 -5590 -5420 -5230 -5030 -4630 -4170 -3610 -2030
u'
-5940 -5910 -5840 -5760 -5590 -5430 -5240 -5050 -4670 -4250 -3750 -2400
<V
(joules deg~
29.4 29.5 29.7 29.9 30.2 31.2 32 34 39 48 74
00
1 mole
cv
-1)7.1 7.1 7.0 6.8 6.5 6.5 6 5 4 5
— oo?
a Superscripts t = triple point, b = normal boiling point, and c = critical point.
THERMODYNAMIC FUNCTIOMS 9 tically important property, the configurational energy u at the critical point. The uncertainty in the figure given is probably about ± 5 0 joules mole-1.
3.2. NITROGEN
There is less new work on nitrogen than on argon. New measurements of the density as a function of pressure and temperature [8, 20] yield orthobaric volumes that are close to those recommended previously
[1, p, 51]. The speed of sound has been measured again by van Itterbeek and van Dael [21] with results that lie a little below those of Liepmann [11] and of the earlier work from Louvain [13]. The line chosen through these points is shown in Fig. 4. There are no new measurements of heat capacities.
1000
900 E
800
, w 60 70 80 90
T°K
FIG. 4. The speed of sound in liquid nitrogen: ( o ) van Itterbeek and van Dael [21], (D) van Itterbeek and Verhaegen [13], and (Δ) Liepmann [11].
Figure 5 shows the values of yv from the speed of sound and the apparently less precise values from the isotherms of van Itterbeek and Verbeke [8, 20]. The extrapolation from 90°K to the critical point is regrettably long but cannot be greatly in error. Table III shows the derived thermodynamic properties.
There is still little or no information on the equation of state of the gas at temperatures around the critical point [22], and so no new table of configurational properties can be prepared.
24 22 20 18
10 8 6 4 2 0
60 80 100 120 140 T°K
FIG. 5. The thermal pressure coefficient of liquid nitrogen: ( o ) van Itterbeek and Verbeke [8, 20] and (D) from the speed of sound, Fig. 4.
3.3. OXYGEN
The liquid range of oxygen is unusually long—from the triple point at 54°K to the critical point at 155°K. Almost all precise work has been confined to the thirty degrees below the normal boiling point at 90.18°K.
This is a fixed point of the international temperature scale.
The vapor pressure has been measured from 79°K to the critical point by Timrot and Borisoglebskii [23, 24], and the earlier measurements of Hoge [25] have been reanalyzed by Mullins et al. [26]. We fitted a polynomial in T with powers from —1 to + 6 to \npa by using the measurements of Hoge and of Timrot and Borisoglebskii. The latter showed some scatter but joined smoothly to the former.
The orthobaric volume has been measured recently by van Itterbeek and Verbeke [27] from 65° to 90°K and by Timrot and Borisoglebskii above 79°K. The former agree well with earlier work [1, p. 55], but the latter indicate larger volumes at 80° to 90°K. However, they conform again at higher temperatures and this discrepancy is ignored. The oxygen used in this work was only 99 % pure.
THERMODYNAMIC FUNCTIONS 11
1 I VO 1-H VO m VO vo r» vô n «o 00 00 00 »o 00 © VO < « ■ OS
N S
© 7
* · * OX)
X ^
© © vo n
*-* ON CO 00 O ON ON oo
00 ON VO -t
<o CN r^ CN
oo oo f- r^ I I I
VO *
m m m m ~ Ö Ö Ö
^Η Tt en *-t
^j N h;
*-4 en «n © VO VO VO t*-
°. *"3 ^
τί rn Ö N (S M
VO VO 00 t"*
r o o v o « r > v o v o » n m t s m « o o N ^ ^ l - i - H O ö ö ö d o ö ö ö
VO
5
ÖfO
d
1 — H
d o ON
VO
vo
d
00
00
d vo
q
1-H
«o
s
*-HVO
*-*
VO
^ H
t** ^ ON t - ON ^ Η T t ON
^ r i r i r i rô en
*—1
r^ «N ON es 00
m Q oo
^ O r-
*-H <N m
f*"> «O ^t O ON ON O ""» 00 00
fN r«· vo m ON eN Tf r^ oo ^H in vo ON ^ r f "<fr »o «o »n «o vô
S
I I I I I I
(S fN «o ^H ( s 0Ô 0 \ rt
^ ^· m «n «n «n
ON VO
H vo
«n <N (N m
m »o
c4 m
r* en
rn m
«/->
<N Tt m
O r-
rt rn
«N CN
»O m
O m
m vô m •o
t^ m O ON
m r*·
S
VO ri ^-*—2 <o
■<t
r·^ oô «N <r> «o
'-H ON d
O
s
0)«o CN
r-t-^ d rf
r—
ON 00
r- oo oo
8
«O © «O © VOO *H ^Η «Ν <N
*o G
a o
Οβ
.g
"3
a
G
o 10 t** o^t o* o* 00 00
[ l n n 2 2 * * S o k | I I I I I I I
O^ ^Jf ^J CSI ^f (TO CTO ·** ^ ( T O « r ô c > i ^ o a ^ f l ô a ô | 1 H 1 H H I ©
( T O c r o e r o c n c n c N i c s i c N i l fl y H H Π B o
e n w w w w i n i n ^ ^ F ^ « 11 11 |i || » |i 0
un> un> *n> *n> «n» un> un> un> un> un> || || || || |1 || || 0
3 w - w w - H f > l < T O ^ -yO < n O O e, TD ^ t '
«TO «*ï t*5 «*ï «TO" «** «*j> "^F "^F "^F » 11 11 |i || |i 11 o un> un> «*n> un> «n> *n> un> «n> *n> %n> || || || || || || || ©
^ C D * t N i « » V © ( T O « T O t N | H © e * U n >
n
m m m N N C H I N N N i H i i H i ^ « r o ^ Î a o y ô ^ r i f H i O < B Ô < i r î«Λ CHI «W CNI o
" » <uw c^n w m w i H i o o i t O O i i H© ^ 5 ^ 2 UTS 1H1 HO <9B *Π> ^ ΐ 1Π>
O ^ - H ^ - H w ^ c N I e T O i r T k e K s r i v o o
<^> <t^> C^ <^> <p> <^>> <^J d^> <^> <^b <^>
?i
«K « - S« 3e
II II
urn H© o «π» «"»
4Λ O CHI Λ W
an >m ιιφ O O (TO
i ^ ^ - ^ ^ W « w W V
c i « H i f N i « 4 1 ( T O * n i i ^ c M i 11
ιρ*· Η© , ^ urn r*· ©
© u m « H i e © v © v © r * - i P * ·
o o o o o O w - ï w - H II || 11 n 11 11 «
CTO "Ä <*& © Urn O ^ " ff,I> O ""* 1»-«
c r o < ^ ^v^ i t ^ o ^ o ^ v o ^ o ^ c T O a ^ o o
CTO WK WR «*η Wß «"ft ^flf" ^β" ^f" ^β" ^ Γ T > ·*Π> ί*» β*> V©
s 1
CTO T i ΟΒΡ £ 2 TA C$
CTO WI> ^Ρ HO IP*· β*Λ CTO Wï> Wîl Wï> WI) CTO
(Ni O© IP*· βΗ}
urn urn v© <a£> «ro II
τβ" ^ f ÖRs O <r« « D ( Λ « ϋ «ni Q CTO CED &*> ί ^ ^ ϊ ^© ^ Γ **"* ""*
^ ^ ^ Μ π > Μ Τ Λ ν » \ ^ ΐ Ρ * · ΐ ρ * · α β » α β > « Λ " - * ( ΐ τ » η Μ π > οί νί * - « ^
« i l f ^ « t ^ « * r « « ^ « ^ e ^ i N I » ^ « H I « ^ ( T O < T O < T O c T O ^ I P ^
um O B e « o ^ « A ΙΡ^» CTO ^ ^ (TO
8
© © ( ρ « ν ) © · * | · < £ & ν ν © β Η ><r^> <^> C J ^3> I*-H< (PU unt ^Rs w—H ^ J Um Of\ V© (3D <SB>
i ^ ( p S u r n © l P ^ I P ^ - ^ © *-« w^ r u ^ um
^Γ urn © urn O urn © urn © Ô urn O O O O O O ^t*
urn urn v© v© w*· B**· e n ae> iR\ iR\ €R\ O ^ * (PU w& ^ " *π> urn
THERMODYNAMIC FUNCTIONS 13 The speed of sound has been remeasured by van Itterbeek and van Dael [21] with good agreement with earlier work but probably with higher accuracy. The measurements are adopted.
There are no new measurements of Ca. The measurements of C(y] of Voronel' et al. [28] are too close to the critical point to yield reliable values of Cv for the liquid phase. They are discussed below.
The coefficient γν can be derived from the slopes of isotherms measured by van Itterbeek and Verbeke [27] and of the isochores of Timrot and Borisoglebskii [23, 24]. The latter results, although probably not very accurate, are valuable because they are direct measurements and because they are the only measurements above the normal boiling point. The smoothing of y v is made in Fig. 6 and the derived properties shown in Table IV.
40
30
Id O
*2 0
10
0 60 80 100 120 140 160
T°K
FIG. 6. The thermal pressure coefficient of liquid oxygen: ( o ) van Itterbeek and Verbeke [27], ( Δ ) , Timrot and Borisoglebskii [23, 24], and (D) from the speed of sound.
4* Singularities at the Critical Point
All thermodynamic functions have singularities at the critical point and many derivatives are either zero or infinite. The exact natures of the singularities have been the subject of much careful and difficult experiment but are still imperfectly known.
The limiting rate of change of a function X(V, T) with (T — Tc) is succintly described by introducing the index
ω± = lim {In X(V, T)ßn[±(T - Tc)]}v=v* (16) r->r±
c
where V* denotes a prescribed path to the critical point, e.g., Vc = V*
or V0 = V*. Thus a simple discontinuity in X at T = Tc or a logarithmic singularity is denoted by ω = 0, a variation as (T — Tc)n by ω = n, etc.
Let the following indices denote the singularities in the functions shown (compare Fisher [29]). Functions without a superscript are in the homo- geneous fluid.
^ y » α > ^ p- > αι j ^ y f a2
( ^ c - ^ ) , £ ( 1 7 )
(dpidV)T>Y+; (dpldV)T\Yl-
(dpl3V)T=Tc as a function of | V - Vc |, (8 - 1)
If the Helmholtz free energy is an analytic function of V and T and if its first nonvanishing derivative with respect to V is of the order 2n Sit Ve, Tcy where n is necessarily integral, then [1, p. 99]
a+ = 0, « r = (if - 2)l(n - 1) j8 = l/2(» - 1), y+ = y i- = 1, 8 = 2n - 1 The van der Waals gas is the case n = 2.
However, the indices are not free to take any values since the con- ditions of thermodynamic stability impose inequalities between them.
The two most important of these, due to Rushbrooke [30] and to Griffiths [31], are
oc2- + 2β + γχ~ > 2 (Rushbrooke)
<V~ + β(δ + 1) > 2 (Griffiths)
Griffiths [32] has also derived several other inequalities which are of less practical value for discriminating between experimental results.
Widom [33, 34] has suggested that the indices are related by the two equations
y + = 2 ( l -jS ) y r = 0 ( 8 - 0 (20) These equations are still conjectures and the experimental numbers
(see below) may not support the first. The second is probably true and makes identical the two inequalities (19).
THERMODYNAMIC FUNCTIONS 15 There is ample experimental evidence that true fluids do not follow the singularities of the van der Waals gas. In particular the orthobaric volumes listed above, and those for many other fluids [1, p. 92; 35]
show that
ß = 0.33 to 0.36 (21) and is not \ as is required by (18) with n = 2. An analysis of y [36]
shows that
y + ~ 1 . 2 and y r ^ 1.0 to 1.2 (22) (The latter is very uncertain.)
The best measurements of a come from the measurements of the heat capacities of argon by Walker [17] and Bagatskii et al. [16] and of oxygen by VoroneP et al. [28]. The results on argon agree well. For both substances there appears to be a singularity that is logarithmic or a little sharper, that is
a2- ~ 0.0 to 0.1, a+ ~ 0.2 (23)
(A van der Waals gas has α+ = α2~ = 0, but the singularity is a simple discontinuity.)
The best value of δ [37] is close to 4.2.
These values are based primarily on gases other than argon, nitrogen, and oxygen, except for the best work on a, but the above tables conform to these equations and there is no reason to suppose that the indices change from gas to gas, except possibly when quantal effects are large [38].
The uncertainty in γχ~ makes Rushbrooke's inequality of little practical value, but the figures above show that Griffith's is satisfied only with difficulty (e.g., a2~ = 0.06, β = 0.36, and δ = 4.4, which are near the edges but not outside the possible ranges for these parameters). Clearly, more experimental work is needed.
REFERENCES
1. J. S. Rowlinson, "Liquids and Liquid Mixtures." Butterworths, London and Washington, D.C., 1959.
2. A. Michels, J. M. Levelt, and W. De Graaff, Physica 24, 659 (1958).
3. A. van Itterbeek, J. De Boelpaep, O. Verbeke, F. Theeuwes, and K. Staes, Physica 30, 2119 (1964).
4. R. A. H. Pool, B. D. C. Shields, and L. A. K. Staveley, Nature 181, 831 (1958).
5. P. Flubacher, A. J. Leadbetter, and J. A. Morrison, Proc. Phys. Soc. (London) 78, 1449(1961).
6. G. Thomaes and R. Steenwinkel, Mol. Phys. 5, 301 (1962).
7. I. W. Jones, J. S. Rowlinson, G. Saville, and R. D. Weir. Unpublished.
8. A. van Itterbeek and O. Verbeke, Physica 26, 931 (1960).
9. A. van Itterbeek, O. Verbeke, and K. Staes, Physica 29, 742 (1963).
10. R. A. H. Pool, G. Saville, T. M. Herrington, B. D. C. Shields, and L. A. K. Staveley, Trans. Faraday Soc. 58, 1692 (1962).
11. H. W. Liepmann, Helv. Phys. Ada 12, 421 (1939).
12. J. K. Gait, J. Chem. Phys. 16, 505 (1948).
13. A. van Itterbeek and L. Verhaegen, Proc. Phys. Soc. (London) B62, 800 (1949).
14. A. van Itterbeek, W. Grevendonk, W. van Dael, and G. Forrez, Physica 25, 1255 (1959).
15. E. R. Dobbs and L. Finegold, J. Acoust. Soc. Am. 32, 1215 (1960),
16. M. I. Bagatskii, A. V. Voronel', and V. G. Gusak, Soviet Phys. JETP (English Transi.) 16, 517 (1963).
17. P. A. Walker, Thesis, London University, 1956.
18. F. Din, "Thermodynamic Functions of Gases," Vol. 2. Butterworths, London and Washington, D.C., 1956.
19. A. Michels, J. M. Levelt, and G. J. Wolker, Physica 24, 769 (1958).
20. A. van Itterbeek and O. Verbeke, Cryogenics 2, 79 (1961-1962).
21. A. Van Itterbeek and W. van Dael, Physica 28, 861 (1962).
22. F. Din, "Thermodynamic Functions of Gases," Vol. 3, p. 133-134. Butterworths, London and Washington, D.C., 1961.
23. D. L. Timrot and V. P. Borisoglebskii, Soviet Phys. JETP (English Transi.) 11, 1248 (1960).
24. D. L. Timrot and V. P. Borisoglebskii, Inzh. Fiz. Zh. Akad. Nauk Belorussk. SSR 4, 3 (1961).
25. H. J. Hoge, J. Res. Nat. Bur. Std. 44, 321 (1950).
26. J. C. Mullins, W. T . Ziegler, and B. S. Kirk, Advan. Cryog. Eng. 8, 126 (1963).
27. A. van Itterbeek and O. Verbeke, Cryogenics 1, 77 (1960-1961).
28. A. V. Voroner, Yu. R. Chaskin, V. A. Popov, and V. G. Simkin, Soviet Phys. JETP (English Transi.) 18, 568 (1964).
29. M. E. Fisher, Phys. Rev. 136, A1599 (1964).
30. G. S. Rushbrooke, J. Chem. Phys. 39, 842 (1963); 43, 3439 (1965).
31. R. B. Griffiths, Phys. Rev. Letters 14, 623 (1965).
32. R. B. Griffiths, J. Chem. Phys. 43, 1958 (1965).
33. B. Widom, J. Chem. Phys. 37, 2703 (1962).
34. B. Widom, J. Chem. Phys. 41, 1633 (1964).
35. M. E. Fisher, J. Math. Phys. 5, 944 (1964).
36. J. S. Rowlinson, in "Critical Phenomena" (M. S. Green and J. V. Sengers, eds.).
Nat. Bur. Std. Monograph, No. 273 (1966), Washington, D.C.
37. B. Widom and O. K. Rice, J. Chem. Phys. 23, 1250 (1955).
38. M. E. Fisher, Phys. Rev. Letters 16, 11 (1966).
![FIG. 1. The speed of sound in liquid argon : ( O ) van Itterbeek et al. [ 14], ( D ) Galt [12], (Δ) Liepmann [11], and ( v ) Dobbs and Finegold [15]](https://thumb-eu.123doks.com/thumbv2/9dokorg/1180160.86593/5.664.212.455.185.389/speed-sound-liquid-argon-itterbeek-liepmann-dobbs-finegold.webp)
![FIG. 2. The thermal pressure coefficient of liquid argon: ( o ) Michels et al. [2], (Δ) Walker [17], ( ν ) van Itterbeek et al](https://thumb-eu.123doks.com/thumbv2/9dokorg/1180160.86593/6.664.217.467.124.459/thermal-pressure-coefficient-liquid-argon-michels-walker-itterbeek.webp)
![FIG. 4. The speed of sound in liquid nitrogen: ( o ) van Itterbeek and van Dael [21], (D) van Itterbeek and Verhaegen [13], and (Δ) Liepmann [11]](https://thumb-eu.123doks.com/thumbv2/9dokorg/1180160.86593/9.664.208.479.394.652/speed-sound-liquid-nitrogen-itterbeek-itterbeek-verhaegen-liepmann.webp)
![FIG. 5. The thermal pressure coefficient of liquid nitrogen: ( o ) van Itterbeek and Verbeke [8, 20] and (D) from the speed of sound, Fig](https://thumb-eu.123doks.com/thumbv2/9dokorg/1180160.86593/10.664.213.474.109.487/thermal-pressure-coefficient-liquid-nitrogen-itterbeek-verbeke-speed.webp)
![FIG. 6. The thermal pressure coefficient of liquid oxygen: ( o ) van Itterbeek and Verbeke [27], ( Δ ) , Timrot and Borisoglebskii [23, 24], and (D) from the speed of sound](https://thumb-eu.123doks.com/thumbv2/9dokorg/1180160.86593/13.664.183.491.365.677/thermal-pressure-coefficient-liquid-itterbeek-verbeke-timrot-borisoglebskii.webp)
