FUNDAMENTAL INTERSTRAIN DIFFERENCES IN CORTICAL ACTIVITY BETWEEN WISTAR AND SPRAGUE–DAWLEY RATS DURING
GLOBAL ISCHEMIA
J. FUZIK,a1L. GELLE´RT,a1G. OLA´H,aJ. HERE´DI,a K. KOCSIS,aL. KNAPP,aD. NAGY,aZ. T. KINCSES,b2 Z. KIS,aT. FARKASa*AND J. TOLDIa
aUniversity of Szeged, Department of Physiology, Anatomy and Neuroscience, Ko¨ze´p fasor 52, H-6726 Szeged, Hungary
bUniversity of Szeged, Department of Neurology, Semmelweis Str. 6, H-6725 Szeged, Hungary
Abstract—Four-vessel occlusion (4VO), a frequently used model of global cerebral ischemia in rats, results in a dys- function in wide brain areas, including the cerebral cortex and hippocampus. However, there are pronounced differ- ences in response to global ischemia between the labora- tory rat strains used in these studies. In the present work, the immediate acute effects of 4VO-induced global ischemia on the spontaneous electrocorticogram (ECoG) signals were analyzed in Wistar and Sprague–Dawley rats. The ECoG was isoelectric during the 10 min of global cerebral ischemia in Wistar rats and the first burst (FB) was seen 10–13 min after the start of reperfusion. In Sprague–Dawley rats, the FB was detected immediately after the start of 4VO or a few seconds later. The burst suppression ratio (BSR) in Wistar rats decreased to 45% in 5 min after FB, and after 25 min it was approximately 40%. In Sprague–Dawley rats, the BSR was 55% immediately after the FB and it decreased steeply to reach 0% by 10 min. There was also a significant difference between the two strains in the frequency compo- sition of the ECoG pattern. The power spectral densities of the two strains differed virtually throughout the post- ischemic state. The histological results (Evans Blue, Cresyl Violet and Fluoro Jade C stainings) supplemented the elec- trophysiological data: the neuronal damage in the CA1 pyr- amids in Wistar rats was severe, whereas in the Sprague–
Dawley animals it was only partial. These observations clearly demonstrate that the use of different rat strains (e.g. Wistar vs. Sprague–Dawley) can be a source of consid- erable variability in the results of acute experiments on global ischemia and it is important that the laboratory rats used in such experiments should be carefully chosen.
Ó2012 IBRO. Published by Elsevier Ltd. All rights reserved.
Key words: four-vessel occlusion, electrocorticogram, burst suppression ratio, global ischemia, Wistar strain, Sprague–
Dawley strain.
INTRODUCTION
A physiological, uninterrupted blood supply is essential for the appropriate functioning of the central nervous system (Heiss et al., 1977). Depending on the variety and severity of a circulatory failure which leads to brain ischemia, damage may occur in several ways (Hossmann, 2008).
Accordingly, different experimental models of ischemia are required which correspond to the various clinical pathophysiological situations (Perel et al., 2007).
Application of an appropriate model is essential in the investigations of ischemic pathophysiological conditions and for the evaluation of treatment strategies for patients with cerebrovascular diseases (Khaja and Grotta, 2007; Sacco et al., 2007).
Many independent research groups have reported significant discrepancies between the data recorded in human pathophysiological states and the data obtained from animal experiments. It is clear that the most important step in designing an animal experiment is the selection of a suitable model and the method for the induction of ischemia. In this respect, it should be borne in mind that there is a considerable diversity in cerebral vascular architecture in the different species, and there are also interstrain and even intrastrain anatomical differences in the vasculature of mice (Barone et al., 1993) and rats (Oliff et al., 1995a,b, 1996). As merely one example, there are six different variations in the anatomy of the arterial circle of rats (Brown, 1966). In consequence of such anatomical differences, it has been found that the specific features of the different rat and mouse strains (Ginsberg and Busto, 1989; Barone et al., 1992) supplied by the different vendors (Marosi et al., 2006) are the determining factors most strongly influencing the outcome of global or focal cerebral ischemia (Barone et al., 1993). To the best of our knowledge, there are no published comparative morphological and electrophysiological data dealing with the ischemic interstrain differences between Wistar and Sprague–Dawley rats.
The primary aim of the present study was to investigate whether any difference in cerebral cortical activity and the consequent histological changes can be
0306-4522/12 $36.00Ó2012 IBRO. Published by Elsevier Ltd. All rights reserved.
http://dx.doi.org/10.1016/j.neuroscience.2012.10.042
*Corresponding author. Tel: +36-62-544381; fax: +36-62-544291.
E-mail address:tfarkas@bio.u-szeged.hu(T. Farkas).
1Equal contribution.
2Present address: International Clinical Research Center, St. Anne’s University Hospital, Pekarska 53, 656 91 Brno, Czech Republic.
Abbreviations: 4VO, four-vessel occlusion; BSR, burst suppression ratio; CBF, cerebral blood flow; CCAs, common carotid arteries; EEG, electroencephalogram; FB, first burst; PBS, phosphate-buffered saline;
ECoG, electrocorticogram.
371
observed following global cerebral ischemia in Wistar and Sprague–Dawley rats supplied by the same vendor (Charles River Laboratories). A further goal was to emphasize that such differences can greatly influence the results of experiments and even the clinical application of neuroprotective strategies.
MATERIALS AND METHODS Animals and housing conditions
Male Wistar and Sprague–Dawley rats (250–300 g) supplied by the same vendor (Charles River Laboratories, N= 28) were housed individually in standard plastic cages, with free access to food and water. The animal house was light-controlled in 12 h cycles and the animals were kept under conditions of constant room temperature (22 ± 1°C) and humidity. Every effort was made to minimize the number of animals used and their suffering.
The principles of animal care (NIH Publication No. 85-23) and the protocol for animal care approved by both the Hungarian Health Committee (1998) and the European Communities Council Directive (86/609/EEC) were strictly followed.
Preparation of the transient global cerebral ischemia model (4VO)
From the total of 28 animals, the data on 14 (out of 17) Wistar and 11 (out of 12) Sprague–Dawley rats could be used in this study. The four-vessel occlusion (4VO) procedure was based on the method of Pulsinelli and Brierley (1979)as adopted by our laboratory (Sas et al., 2008; Gellert et al., 2011). Under sodium pentobarbital anesthesia (60 mg/kg, i.p.), the atlas bone was exposed and both vertebral arteries were electrocauterized through the alar foramina located on the lateral surface of the atlas by alternate cooling and drilling, in order to protect the brainstem from heat damage, which can lead to a respiratory malfunction. The exposure and cauterization of the vertebral arteries was judged to be successful if both the proximal and the distal stump emerged. Twenty four hours later, under sodium pentobarbital anesthesia (60 mg/kg, i.p.), the common carotid arteries (CCAs) were blunt-dissected free and the animal was fixed stereotaxically. After preparation of the skull for the extradural spontaneous electrocorticogram (ECoG) baseline recording, the CCAs were clamped with non-traumatic aneurysm clips (Aesculap, B. Braun Medical Ltd., Hungary) for 10 min.
Twelve Wistar rats destined for histology did not receive pentobarbital, but slight ether anesthesia during the 4VO (as is common for this strain in 4VO ischemia;Sas et al., 2008). In order to rule out the putative neuroprotective effects of pentobarbital anesthesia in our 4VO model, 3 Wistar rats underwent pentobarbital anesthesia during 4VO, too. The carotid artery blood flow was recommenced by releasing the clips following 10 min of global cerebral ischemia. Body temperature was monitored and maintained at 37°C by means of an automatic heat controller placed in the stereotaxic stand (Supertech TMP-5a, Hungary). In order to reduce the
number of experimental animals and their suffering in this study, the sham-operated group was omitted and a control group was used for comparison, as in our previous study (Sas et al., 2008), when a 4VO-induced hippocampal injury was studied with Fluoro Jade C and anti-neuronal nuclei (NeuN) labeling; it was found that sham surgery caused no tissue damage, as assessed by Fluoro Jade C staining on hippocampal slices (data not shown).
Electrophysiology
Burst suppression ratio analysis. For electrophysio- logical recordings, 4 Wistar and 4 Sprague–Dawley rats were used. The intermittent cortical activity which could be observed after ischemic insults was quantified by estimating the burst suppression ratio (BSR), defined as the percentage of time spent in suppression (Rampil and Laster, 1992). We applied the method of Vijn and Sneyd (1998) for burst identification. The resolution in the BSR estimation was 10 s. In order to increase the sensitivity of BSR extraction, the threshold amplitude was adjusted on every channel used individually so as to exclude differences originating from the experimental conditions. The absolute value of a 5-min baseline period for each channel was used to determine BSR repeatedly with a decreasing voltage threshold and 200 ms for the minimum allowed BS duration. The threshold with a BSR value of <5% (20–25lV) was used to monitor the changes in BSR after the first burst (FB) following the 10-min global cerebral ischemia.
Analysis was carried out with custom-written routines in MATLAB (MathWorks, Natick, USA).
Threshold-crossing event detection. The post- ischemic burst period is characterized by a higher rate of firing. The threshold for the quantification of threshold-crossing events was defined with the BSR- analyzing algorithm. The resolution of the BSR estimation was 10 s. Raw data were filtered to 1.5–
50 Hz. The absolute value of ECoG 30–35 min after the FB was used to determine BSR repeatedly with an increasing voltage threshold, and one with a BSR
>98% was set for spike detection. The numbers of threshold-crossing spikes were determined in every 5-min period during 30 min after the FB and divided by the number of spikes counted between 30 and 35 min after the FB. Analysis was carried out with the event detection function of Stimfit 0.10 (http://www.stimfit.org/;
courtesy of C. Schmidt-Hieber, University College London, London, UK; and P. Jonas, Physiological Institute, University of Freiburg, Freiburg, Germany).
Spectral density estimation. For the conversion of ECoG data from time domain to frequency domain and for computation of thediscrete Fourier transform and its squared magnitude, Welch’s method was used to calculate periodograms to estimate the power of ECoG at different frequencies (Alkan and Kiymik, 2006).
Measurements of ECoG were made in every first 30-s period of every 5 min after the FB. The segment length
was 300 data points with 50% overlap. Analysis was carried out with custom-written routines in MATLAB (MathWorks, Natick, USA).
Statistical analysis. The normal distribution of the BSR data could not be confirmed by using the Shapiro–Wilk normality test, and the Levene test did not demonstrate an equality of variances. The Mann–WhitneyU-test, as a non-parametric test on two independent samples, was therefore chosen for the statistical analysis of the BSR data. The Shapiro–Wilk normality test indicated the normal distribution of the threshold-crosssing event count data. The one-sample T-test was used to determine the significance of the difference between the two groups. Analysis was carried out with SPSS 18 (SPSS Inc, USA).
Histology
Coronal sections (20lm) were obtained from the brains with a vibratome (Leica VT1000 S). Stereotaxic coordinates were defined according to the stereotaxic brain atlas ofPaxinos and Watson (1986). Fluorescence and bright-field photomicrographs were obtained with an Olympus BX51 microscope fitted with a DP70 digital imaging system.
Cresyl Violet and Fluoro Jade C staining. After a 8-day survival period, the animals (5 Wistar and 5 Sprague–
Dawley rats) received an overdose of chloral hydrate, and were perfused transcardially with 0.1 M ice-cold phosphate-buffered saline (PBS, pH 7.4), followed by 4% buffered paraformaldehyde. The brains were removed, and postfixed overnight in paraformaldehyde at 4°C. Coronal sections (20lm) were obtained arbitrarily at the level bregma 2.3 to 4.3, and were mounted on slides coated with 2% gelatin. The
morphological properties of the CA1 pyramids were assessed by means of conventional Cresyl Violet nuclear staining. To reveal neuronal degeneration, staining with Fluoro Jade C was applied, this material having a high affinity for the entire degenerating neuron, including the cell body, dendrites, axon and axon terminals (Schmued and Hopkins, 2000). The slides were cover-slipped with Fluoromount and subsequently protected from direct light.
Evans Blue staining. For Evans Blue staining (Rakos et al., 2007), 2 Wistar and 2 Sprague–Dawley rats were stained (1 animal as a control and 1 per strain during permanent 4VO), as described earlier with some minor modifications (see surgical procedures in Section 2.2).
Promptly after cauterizing of the vertebral arteries, both CAAs were exposed and two ligatures were placed upon each. The arteries between the two ligatures were severed to ensure total interruption of the carotid flow.
For detection of the cerebral blood flow (CBF) during 4VO, animals were perfused transcardially with 0.1 M ice-cold PBS (pH 7.4), followed by 50 ml of 2% buffered Evans Blue dye. The brains were removed, and postfixed overnight in 4% paraformaldehyde at 4°C.
Coronal sections (20lm) were obtained at the level corresponding to the ECoG recording electrodes and were mounted on slides coated with 2% gelatin. The slides were cover-slipped with Fluoromount and subsequently protected from direct light.
RESULTS Electrophysiological results
In general, no systematic difference was detected in the ECoG pattern originating from the two strains. During the 10 min of global cerebral ischemia, the ECoG was
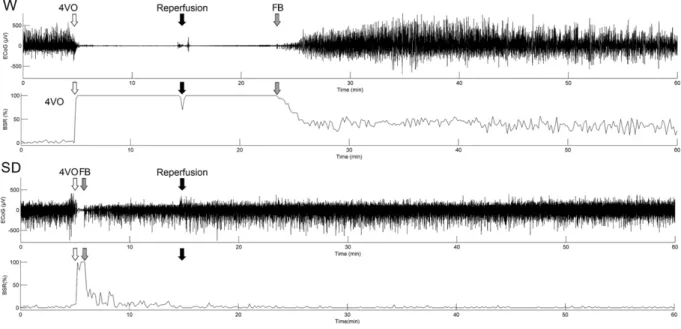
Fig. 1. 60-min ECoG and BSR of Wistar (W) and Sprague–Dawley (SD) rats during and after 4VO, recorded from the primary somatosensory cortex. BSR% is the percentage of time spent in suppression in every 10-s period. 4VO (empty arrow) denotes where the CCA occlusion starts after 5 min of baseline. Reperfusion (black arrow) denotes where the clips are removed from the CCAs and reperfusion of the cerebral area starts. The striped arrow indicates the first burst (FB) after the isoelectric pause.
isoelectric on all four channels (SS1L, SS1R, M1L and M1R) in the Wistar rats and persisted for at least another 10 min after the start of reperfusion. The FB occurred 10–13 min after the start of reperfusion. In the Sprague–Dawley rats, the FB was detected immediately after the start of 4VO or after a few seconds long isoelectric pause, and firing continued during the global cerebral ischemic period, but with smaller amplitudes (Fig. 1). BSR analysis was carried out on the epidural ECoG data of the Wistar and the Sprague–Dawley rats (Fig. 2).
The ECoG data were used to compare the BSRs of the two strains (Fig. 2). The BSR of the Wistar rats
decreased to 45% in 5 min after the FB, and after 25 min it was approximately 40%. In the Sprague–
Dawley rats, the BSR was 55% immediately after the FB and it decreased rapidly and reached 0% by 10 min.
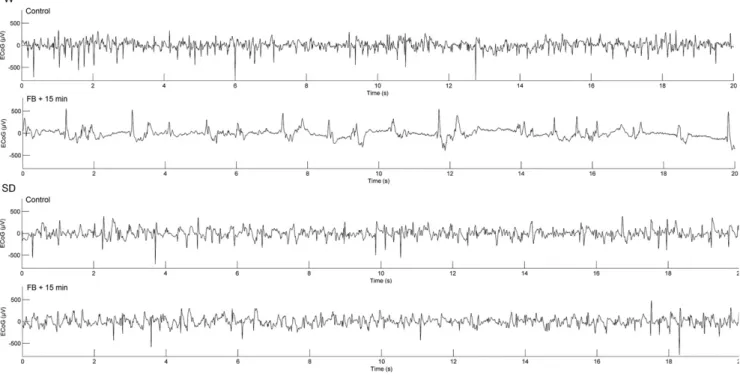
The difference was statistically significant. In the ECoG of the Wistar rats 15 min after the FB, brief suppressed and brief burst periods alternated. The baseline ECoG architecture and the ECoG pattern 15 min after the FB were similar to those of the control in the Sprague–
Dawley strain (Fig. 3).
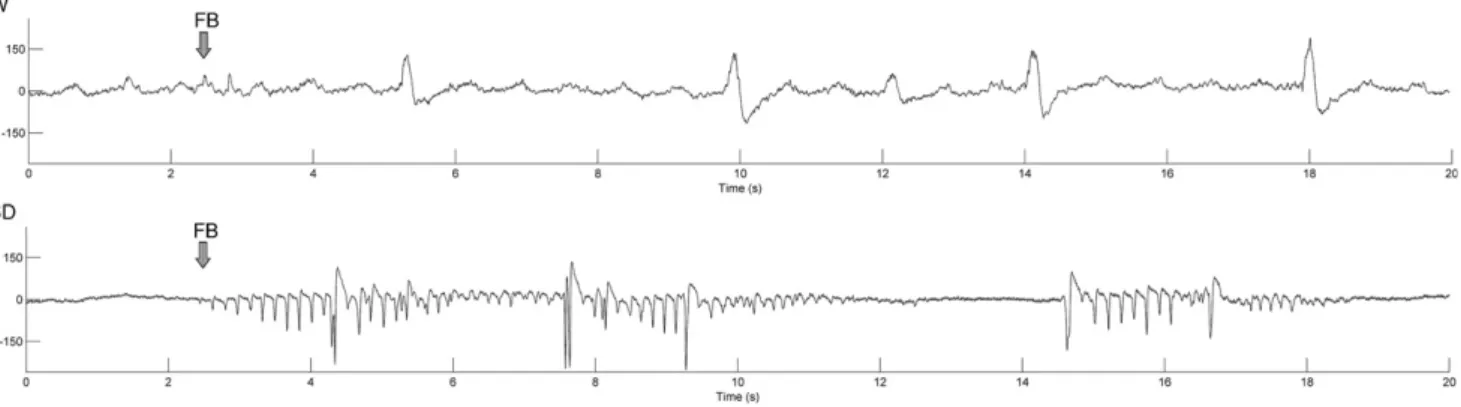
The ECoG pattern of the initial period of firing after the FB differed in the two investigated strains (Fig. 4). In the Wistar rats, the ECoG immediately after the FB consisted of long stretches of suppressed ECoG interrupted by brief occasional periods of bursts. The ECoG during the first 2 min after the FB displayed a completely different pattern in the Sprague–Dawley rats.
It consisted of a mixture of 3–10-s long continuous bursts separated by 2–3-s long isoelectric pauses.
There was a considerable difference in the frequency composition of the ECoG pattern between the two strains as a consequence of 4VO. Typical power spectral densities of selected bursts of the first 5-min ECoG after the FB of the Wistar and the Sprague–Dawley rats were compared (Fig. 5). Lower frequency components such as those below 5 Hz had much smaller spectral power in the bursts of the Sprague–Dawley animals. There were marked differences in power density between 5 and 11 Hz and between 11 and 16 Hz, where the Sprague–Dawley rats exhibited slightly smaller spectral powers. In comparison with the power spectral density of the Wistar rats, there were well-defined peaks at 5.5 Hz and 10.5 Hz for the Sprague–Dawley rats, and they also gave a similar 16-Hz peak.
Fig. 2.BSR data on Wistar and Sprague–Dawley rats in the 25-min period after the FB. For every animal, the BSR data are the averages of the BSR data computed from four recorded channels. Significance level:⁄⁄⁄p60.001.
Fig. 3. 20-s samples of typical ECoG waveforms of Wistar (W) and Sprague–Dawley (SD) rats in the baseline period and 15 min after the FB.
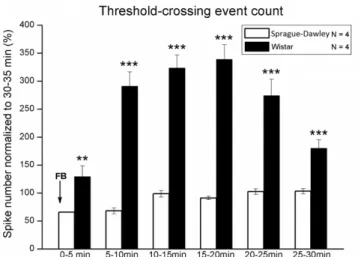
The power spectral density differed between the two strains not only in the selected bursts, but also in almost every period of the post-ischemic state. The ECoG power spectra of each 5-min period in the 30-min period after the FB in the two strains were compared. For both strains, the spectrum of the baseline was different from the spectrum of the first 5-min period after the FB. In the 25–30-min period after the FB, the power spectrum for the Sprague–Dawley rats was similar to the baseline spectrum. For the Wistar rats in the same period, the power spectrum was much more similar to the spectrum of the 5–10-min period after the FB (Fig. 6). Threshold- crossing event detection was used to compare the amplitudes of the cortical activity after the FB in the two strains. The spike count of the 30–35-min period after FB was determined, and the spike count of every 5-min period after FB was divided by this value (Fig. 7).
Histological results
The macroscopic observations on the transcardially perfused brains demonstrated the homogenous distribution of the fluorescent dye in the cerebrum, cerebellum and olfactory bulb in the control Wistar and Sprague–Dawley rats (Fig. 8). In the Wistar rats, the permanent 4VO procedure resulted in complete exclusion of the dye from the cortex and olfactory bulb.
The light reddish-brown color of the cortex in the Wistar animals resulted from unwashed capillary blood.
Washing solution (0.1% PBS) did not eliminate the blood from the cortical capillaries. A slight infiltration of Evans Blue occurred in the cerebellar area (Fig. 8). However, the olfactory bulb and cerebellum of the Sprague–
Dawley rats were strongly stained. The rather colorless appearance of the cortex in the Sprague–Dawley Fig. 4.Typical ECoG waveforms of the first 20 s after the FB in Wistar (W) and Sprague–Dawley (SD) rats.
Fig. 5. Typical power spectral density of selected bursts of the first 5-min ECoG after the FB in Wistar (W) and Sprague–Dawley (SD) rats. Welch periodograms (A and C) of the selected bursts (B and D).
Fig. 6.Power spectral comparison of Wistar (W) and Sprague–Dawley (SD) ECoG in the post-ischemic period after the FB. Data on 1 min of baseline, and on the first min of the 0–5-, 5–10- and 25–30-min periods following the FB were analyzed. Representative ECoGs from the primary somatosensory cortex of Wistar rats and Sprague–Dawley rats and the Welch periodograms of the analyzed data. Power spectral density is given in dB/Hz. In the periodogram of the 25–30-min period following FB the solid line is the spectrum of the given period, while the dashed line is the spectrum of the baseline.
Fig. 7.Comparison of spike numbers of every 5-min period after the FB of Wistar and Sprague–Dawley rats, normalized to the spike number in the 30–35 min following the FB.⁄⁄p60.01;⁄⁄⁄p60.001.
animals resulted from the complete elimination of blood from the cortical capillaries (Fig. 8).
Fluorescent photomicrographs of 4VO Sprague–
Dawley rats revealed clearly-outlined strongly Evans Blue-positive cells on a bright-red fluorescent homogenous parenchymal background. In contrast, Evans Blue -positive cells appeared only solely on a similar parenchymal background in the Wistar rats.
Neurons remained unstained with round shape (Fig. 9, panel A). The failure of Evans Blue staining in the Wistar 4VO animals was due to the insufficient flow of the dye.
Global forebrain ischemia for 10 min in the Wistar rats resulted in intense Fluoro Jade C staining throughout the CA1 hippocampal subfield. Severe neuronal damage developed. The region of basal dendrites in the stratum oriens and the region of apical dendrites in the stratum radiatum and lacunosum moleculare were also homogenously Fluoro Jade C-positive. In the hippocampal CA1 region of Wistar rats anesthetized
with pentobarbital, the Fluoro Jade C labeling revealed the same level of injury in all animals as seen in Wistar rats which received only slight ether anesthesia (data not shown). In comparison, the neuronal damage in the Sprague–Dawley rats was only partial: Fluoro Jade C-positive pyramidal cells either appeared sporadically, or no labeling was detected. Fluoro Jade C staining of the apical dendrites followed the staining pattern of the injured neurons. The dentate gyrus remained intact in both strains (Fig. 9, panel B).
On staining with Cresyl Violet, the CA1 pyramidal cells of the ischemic Sprague–Dawley rats appeared in a normal cell shape. Neither shrinkage of the cell bodies nor condensation of the nuclei was observed. In comparison, the CA1 pyramidal cells in the Wistar rats were pycnotic and degenerated. Cresyl Violet staining also revealed reactive astrogliosis and the infiltration of macrophages in the stratum radiatum and lacunosum moleculare as a consequence of the neurodegeneration (Fig. 9, panel C).
Fig. 8.Differences in staining observed macroscopically in Wistar and Sprague–Dawley 4VO animals. The macroscopic observation of transcardially perfused brains also demonstrated homogenous distribution of the fluorescent dye in the cerebrum, cerebellum and olfactory bulb in the control Wistar and Sprague–Dawley rats (panels A and C). The 4VO procedure on the Wistar rats resulted in complete exclusion of the dye from the cortex and olfactory bulb. The light reddish-brown color of the cortex in the Wistar animals resulted from unwashed capillary blood. Washing solution (0.1% PBS) did not eliminate the blood from the cortical capillaries. A slight infiltration of Evans Blue was seen in the cerebellar area.
However, the olfactory bulb and cerebellum of the Sprague–Dawley rats were strongly stained. The colorless appearance of the cortex in the Sprague–Dawley animals resulted from the total elimination of the blood from the cortical capillaries.
DISCUSSION
The first mammalian species that was primarily domesticated for scientific purposes was the Norway rat.
Among the 220 inbred rat strains, most of them existing as outbred strains too, Wistar and Sprague–Dawley rats became the strains most intensively used in scientific research (Hedrich, 2000). The Wistar strain from the Charles River Laboratories originated from the Wistar Institute. In 1947 it was transferred to the Scientific Products Farm, and the strain was introduced into the Charles River Laboratories in 1975. The Sprague–
Dawley strain was initiated by R. Dawley in 1925; in 1979, it was taken to SASCO from ARS/Sprague–Dawley.
Since 1996, it has been maintained by the Charles River Laboratories. There are striking differences in the physiological functions of the two rat strains at many levels, e.g. behavior (Rex et al., 2004; Walker et al., 2009; Valdez et al., 2011), learning and memory (Meneses et al., 2011; Ricart et al., 2011), responses to intoxication (Riley et al., 2009), general anesthesia (Siller- Matula and Jilma, 2008), enzymatic activity (Saito et al., 2004; Imamura and Shimada, 2005), gene expression (Hill et al., 1996) and focal ischemic injury (Markgraf et al., 1993; Walberer et al., 2006). Both Wistar (Pulsinelli and Brierley, 1979; Sas et al., 2008; de la Tremblaye and Plamondon, 2011) and Sprague–Dawley rats (Phillis et al., 1994; Vered et al., 1994; Caragine et al., 1998; He Fig. 9.Representative photomicrographs of coronal sections of a rat cortex and dorsal hippocampus. (A) Transcardial perfusion of Evans Blue during 4VO in Wistar rats resulted in a homogenous light-red background staining of the brain parenchyma. EB+ neurons in cortical layers II–IV can be observed sporadically (A, left and insert at higher magnification). Mostly unstained, EB neurons can be observed. Transcardial perfusion of Evans Blue during 4VO in Sprague–Dawley rats resulted in intensive Evans Blue staining throughout the cortical layers II–IV. Solely EB+ neurons can be observed (B, right and insert at higher magnification). (B) Severe damage to the CA1 pyramidal cells is apparent in the sections obtained from the Wistar 4VO group. The Fluoro Jade C signal (yellowish-green) of the injured cell bodies and processes is prominent along the CA1 subregion and dorsal subiculum. The Sprague–Dawley 4VO group exhibited a lower density of Fluoro Jade C-labeled neurons, and the neuronal damage was partial. (C) Cresyl Violet nuclear staining revealed massive degeneration throughout the CA1 subfield in the Wistar rats. Shrinkage of the cell bodies and nuclear condensation can be observed. In the stratum radiatum and lacunosum moleculare, reactive astrogliosis and the infiltration of macrophages are to be seen as a consequence of neurodegeneration. In the Sprague–Dawley rats, the Cresyl Violet staining reveals normal round-shaped neurons in the CA1 subregion. Neuronal degeneration can not be observed.
et al., 2004; Zhou et al., 2004) are widely used in experiments involvingglobalischemia, such as 4VO. To the best of our knowledge, no comparative data have been published that deal with the different ischemic responses of the two strains. We therefore studied Wistar and Sprague–Dawley rats to determine whether there were interstrain differences in the responses to global ischemia elicited by 4VO in terms of the acute spontaneous electrical activity of the cerebral cortex and the consequent neurodegeneration.
During 4VO-induced global ischemia in Sprague–
Dawley rats, the CBF is slowly reduced to 14% (slow flow), which causes an approximately 60-fold increase in the extracellular glutamate concentration (Caragine et al., 1998). Surprisingly, when 11VO was applied, the CBF fell more quickly to 5%, but the extracellular glutamate peak was much less elevated (Caragine et al., 1998).
Prolonged glutamate-evoked NMDA receptor activation causes acute excitotoxicity and an intracellular Ca2+
concentration overload (Dirnagl et al., 2003). Previous studies have demonstrated that sustained elevations of cytosolic Ca2+levels contribute to functional loss and cell death (Lipton, 1999; Hou and MacManus, 2002; Brostrom and Brostrom, 2003). Reperfusion after an ischemic event leads to a secondary Ca2+ rise, which is responsible for delayed apoptotic injuries (Siesjo et al., 1999). These data highlight the importance of the residual blood flow for the outcome of ischemic states during occlusion and early reperfusion. During the ‘slow flow’
state, there is a reduced oxygen supply and the generation of free radicals may occur. Experimental data have shown that there is a mutual interconnection between excitatory amino acid release and free radical formation (Pellegrini-Giampietro et al., 1990). If there is an interstrain difference in the residual blood flow of Wistar and Sprague–Dawley rats during 4VO, this could explain our experimental data.
Evans Blue binds to serum albumin with high affinity (Wolman et al., 1981). On injury of the blood–brain barrier, as happens during brain ischemia (Dobbin et al., 1989), the serum proteins such as albumin are extravasated and this is followed by the uptake by neurons, which results in fluorescent signals (Sasaki and Schneider, 1976; Rakos et al., 2007). It may be speculated that the macroscopic colorless appearance of the cortex in Sprague–Dawley rats during permanent 4VO, and the presence of Evans Blue-positive cells in the cortical areas of the same strain, may be consequences of a higher residual blood flow in Sprague–Dawley rats relative to Wistar rats during 4VO (an interstrain difference), a situation called ‘slow flow’
by Caragine et al. (1998). The finding of Evans Blue- positive cells in Sprague–Dawley rats also suggests a failure in the blood–brain barrier integrity.
The electroencephalogram (EEG) is a functional measure widely used to assess the efficacy of experimental techniques applied to induce ischemia in rodents (Giaquinto et al., 1994). The EEG data may be utilized in power spectrum analysis via fast Fourier transform (Henninger et al., 2007) or linear auto- regressive modeling (Tseng et al., 1995). In laboratory
practice, however, for practical reasons the EEG flattening is the simplest parameter for estimating whether ischemia has indeed been induced or not (Fortuna et al., 1997). The EEG is also closely connected to CBF changes (Sharbrough et al., 1973).
Cortical pyramidal cells in layers III, V and VI are extremely vulnerable to ischemic conditions, which can lead to many pathological changes in the EEG patterns (Jordan, 2004). When the normal CBF decreases, the oscillations first lose their high frequencies. A further decline in CBF causes a gradual increase in lower frequencies, which indicates a specific ischemic threshold at which neurons begin to lose their ionic homeostasis (Foreman and Claassen, 2012). If the CBF continues to decrease toward a crucial ischemic threshold (10–12 ml/100 g/min and below), the EEG becomes isoelectric and the neuronal damage becomes irreversible (Sharbrough et al., 1973; Jordan, 2004).
Following transient global cerebral ischemia, the EEG activity returns from the isoelectric line to a post-ischemic burst-suppression pattern through a sequence of bursts of activity alternating with periods of electrical suppression (Pulsinelli and Brierley, 1979; Geocadin et al., 2002; Moldovan et al., 2004; Koenig et al., 2006).
The main strength of our study is the pronounced interstrain difference in ECoG activity (BSR, FB and spectral density) during and after ischemia, the analysis of which on the one hand is rather sophisticated and needs a knowledge of specific software, but on the other hand the acquisition of its ‘raw’ data (e.g. the ECoG waves themselves) is very easy, quick and cheap. Our results have revealed that global ischemia induced by 10 min of 4VO causes acute changes in the electrical activity of the cortical neurons with associated EEG changes. Besides BSR increase, changes can be observed in the frequency spectrum and in the number of spikes crossing through a post-ischemic activity normalized threshold in both Wistar and Sprague–
Dawley rats, but not at the same level. When the 4VO procedure was carried out on Sprague–Dawley rats, we observed that the animals did not become fully unconscious after carotid ligation. Neither loss of the righting reflex nor dilation of the pupils was noted. This latter interstrain difference is in complete agreement with the observations of Kim et al. (2008). Carotid occlusion for 10 min could be achieved only under deep Nembutal anesthesia, rather than under ether anesthesia as previously performed on Wistar rats.
Indeed, under simple ether anesthesia, the Sprague–
Dawley animals were fully awake within 5–6 min.
Histological experiments have demonstrated pronounced neuronal injuries 8 days after 4VO in the cortical and hippocampal areas. Fluoro Jade C and Cresyl Violet stainings were used on the hippocampus because the pyramidal neurons in the CA1 region in Wistar rats are particularly vulnerable to ischemic conditions (Schmidt-Kastner and Freund, 1991; Sas et al., 2008; Gellert et al., 2011). Following global ischemia, the glutamate transporter function is impaired in the hippocampal astrocytes, and the excess and toxic glutamate therefore cannot be removed from the
extracellular space (Yeh et al., 2005). At the same time, it should also be emphasized that fundamental interstrain differences were found between the Wistar and Sprague–Dawley rats (both supplied by the Charles- River vendor) as concerns the acute and delayed responses to 4VO-induced global ischemia. Cresyl Violet, which stains nuclear structures non-specifically, revealed an increase in cell number specifically in the CA1 region, which can be ascribed to reactive astrogliosis and macrophage proliferation after global ischemia (Sugawara et al., 2002). In our experiments, an increased cell number was observed in the same area in the Wistar rats due to reactive microglia and astrocytes, as revealed by CD11b and s100 immunostainings (L. Gelle´rt, unpublished observations), but not in the Sprague–Dawley rats.
Many previous studies have revealed significant interstrain and intrastrain differences in rat collateral anastomoses (Oliff et al., 1997), the infarct volumes caused by focal cerebral ischemia (Oliff et al., 1995a,b), the responses evoked in the hippocampal CA1 subfield after 2VO (Marosi et al., 2006) and variable neuroprotective effects of MK-801 (Oliff et al., 1996), but the main reason for this variability is still unclear.
Although there are considerable discrepancies in cerebral vascular anatomy (Brown, 1966), the collateral anastomoses display nearly equal luminal widths for all the strains/lines (Brown, 1966; Oliff et al., 1997). Oliff et al. (1997) therefore suggest that the differences in lesion size may be caused by the responses of the tissue to ischemia besides the microvascular variations.
We conclude that the striking interstrain differences between Wistar and Sprague–Dawley rats can be a source of considerable variability in acute ischemic responses, and it is extremely important to devote attention to this in the planning of experiments (e.g. on global ischemia), or when the results of similar experiments or data to be found in the literature are evaluated.
Acknowledgments—This work was supported by OTKA grant K105077. The publication is supported by the European Union and co-funded by the European Social Fund. Project title:
‘‘Broadening the knowledge base and supporting the long term professional sustainability of the Research University Centre of Excellence at the University of Szeged by ensuring the rising generation of excellent scientists.’’ Project number: TA´MOP- 4.2.2/B-10/1-2010-0012. F.T. was a Bolyai Fellow of the Hungar- ian Academy of Sciences. We gratefully acknowledge the help of Prof. Magdolna Szente at the University of Szeged for assistance with the ECoG recordings.
REFERENCES
Alkan A, Kiymik MK (2006) Comparison of AR and Welch methods in epileptic seizure detection. J Med Syst 30:413–419.
Barone FC, Knudsen DJ, Nelson AH, Feuerstein GZ, Willette RN (1993) Mouse strain differences in susceptibility to cerebral ischemia are related to cerebral vascular anatomy. J Cereb Blood Flow Metab 13:683–692.
Barone FC, Price WJ, White RF, Willette RN, Feuerstein GZ (1992) Genetic hypertension and increased susceptibility to cerebral ischemia. Neurosci Biobehav Rev 16:219–233.
Brostrom MA, Brostrom CO (2003) Calcium dynamics and endoplasmic reticular function in the regulation of protein synthesis: implications for cell growth and adaptability. Cell Calcium 34:345–363.
Brown JO (1966) The morphology of circulus arteriosus cerebri in rats. Anat Rec 156:99–106.
Caragine LP, Park HK, Diaz FG, Phillis JW (1998) Real-time measurement of ischemia-evoked glutamate release in the cerebral cortex of four and eleven vessel rat occlusion models.
Brain Res 793:255–264.
de la Tremblaye PB, Plamondon H (2011) Impaired conditioned emotional response and object recognition are concomitant to neuronal damage in the amygdala and perirhinal cortex in middle- aged ischemic rats. Behav Brain Res 219:227–233.
Dirnagl U, Simon RP, Hallenbeck JM (2003) Ischemic tolerance and endogenous neuroprotection. Trends Neurosci 26:248–254.
Dobbin J, Crockard HA, Ross-Russell R (1989) Transient blood–brain barrier permeability following profound temporary global ischaemia: an experimental study using 14C-AIB. J Cereb Blood Flow Metab 9:71–78.
Foreman B, Claassen J (2012) Quantitative EEG for the detection of brain ischemia. Crit Care 16:216.
Fortuna S, Pestalozza S, Lorenzini P, Bisso GM, Morelli L, Michalek H (1997) Transient global brain hypoxia-ischemia in adult rats:
neuronal damage, glial proliferation, and alterations in inositol phospholipid hydrolysis. Neurochem Int 31:563–569.
Gellert L, Fuzik J, Goblos A, Sarkozi K, Marosi M, Kis Z, Farkas T, Szatmari I, Fulop F, Vecsei L, Toldi J (2011) Neuroprotection with a new kynurenic acid analog in the four-vessel occlusion model of ischemia. Eur J Pharmacol 667:182–187.
Geocadin RG, Sherman DL, Christian Hansen H, Kimura T, Niedermeyer E, Thakor NV, Hanley DF (2002) Neurological recovery by EEG bursting after resuscitation from cardiac arrest in rats. Resuscitation 55:193–200.
Giaquinto S, Cobianchi A, Macera F, Nolfe G (1994) EEG recordings in the course of recovery from stroke. Stroke 25:2204–2209.
Ginsberg MD, Busto R (1989) Rodent models of cerebral ischemia.
Stroke 20:1627–1642.
He Z, Cui L, Wu SS, Li XY, Simpkins JW, McKinney M, Day AL (2004) Increased severity of acute cerebral ischemic injury correlates with enhanced stem cell induction as well as with predictive behavioral profiling. Curr Neurovasc Res 1:399–409.
Hedrich HJ (2000) History, strains and models. The laboratory rat. London: Academic Press. pp. 3–8.
Heiss WD, Zeiler K, Havelec L, Reisner T, Bruck J (1977) Long-term prognosis in stroke related to cerebral blood flow. Arch Neurol 34:671–676.
Henninger N, Heimann A, Kempski O (2007) Electrophysiology and neuronal integrity following systemic arterial hypotension in a rat model of unilateral carotid artery occlusion. Brain Res 1163:119–129.
Hill BA, Brown PC, Preisegger KH, Silverman JA (1996) Regulation of mdr1b gene expression in Fischer, Wistar and Sprague–Dawley rats in vivo and in vitro. Carcinogenesis 17:451–457.
Hossmann KA (2008) Cerebral ischemia: models, methods and outcomes. Neuropharmacology 55:257–270.
Hou ST, MacManus JP (2002) Molecular mechanisms of cerebral ischemia-induced neuronal death. Int Rev Cytol 221:93–148.
Imamura Y, Shimada H (2005) Differential pharmacokinetics of acetohexamide in male Wistar–Imamichi and Sprague–Dawley rats: role of microsomal carbonyl reductase. Biol Pharm Bull 28:185–187.
Jordan KG (2004) Emergency EEG and continuous EEG monitoring in acute ischemic stroke. J Clin Neurophysiol 21:341–352.
Khaja AM, Grotta JC (2007) Established treatments for acute ischaemic stroke. Lancet 369:319–330.
Kim SK, Cho KO, Kim SY (2008) White matter damage and hippocampal neurodegeneration induced by permanent bilateral occlusion of common carotid artery in the rat: comparison between Wistar and Sprague–Dawley strain. Korean J Physiol Pharmacol 12:89–94.
Koenig MA, Kaplan PW, Thakor NV (2006) Clinical neurophysiologic monitoring and brain injury from cardiac arrest. Neurol Clin 24:89–106.
Lipton P (1999) Ischemic cell death in brain neurons. Physiol Rev 79:1431–1568.
Markgraf CG, Kraydieh S, Prado R, Watson BD, Dietrich WD, Ginsberg MD (1993) Comparative histopathologic consequences of photothrombotic occlusion of the distal middle cerebral artery in Sprague–Dawley and Wistar rats. Stroke 24:286–292 (discussion: 292–283).
Marosi M, Rakos G, Robotka H, Nemeth H, Sas K, Kis Z, Farkas T, Lur G, Vecsei L, Toldi J (2006) Hippocampal (CA1) activities in Wistar rats from different vendors. Fundamental differences in acute ischemia. J Neurosci Methods 156:231–235.
Meneses A, Ponce-Lopez T, Tellez R, Gonzalez R, Castillo C, Gasbarri A (2011) Effects of d-amphetamine on short- and long- term memory in spontaneously hypertensive, Wistar–Kyoto and Sprague–Dawley rats. Behav Brain Res 216:472–476.
Moldovan M, Zagrean AM, Avramescu S, Savaran V, Zagrean L (2004) Electro-cortical signs of early neuronal damage following transient global cerebral ischemia in rat. J Cell Mol Med 8:135–140.
Oliff HS, Coyle P, Weber E (1997) Rat strain and vendor differences in collateral anastomoses. J Cereb Blood Flow Metab 17:571–576.
Oliff HS, Marek P, Miyazaki B, Weber E (1996) The neuroprotective efficacy of MK-801 in focal cerebral ischemia varies with rat strain and vendor. Brain Res 731:208–212.
Oliff HS, Weber E, Eilon G, Marek P (1995a) The role of strain/vendor differences on the outcome of focal ischemia induced by intraluminal middle cerebral artery occlusion in the rat. Brain Res 675:20–26.
Oliff HS, Weber E, Miyazaki B, Marek P (1995b) Infarct volume varies with rat strain and vendor in focal cerebral ischemia induced by transcranial middle cerebral artery occlusion. Brain Res 699:329–331.
Paxinos G, Watson C (1986) The rat brain in stereotaxic coordinates. London: Academic Press.
Pellegrini-Giampietro DE, Cherici G, Alesiani M, Carla V, Moroni F (1990) Excitatory amino acid release and free radical formation may cooperate in the genesis of ischemia-induced neuronal damage. J Neurosci 10:1035–1041.
Perel P, Roberts I, Sena E, Wheble P, Briscoe C, Sandercock P, Macleod M, Mignini LE, Jayaram P, Khan KS (2007) Comparison of treatment effects between animal experiments and clinical trials: systematic review. BMJ 334:197.
Phillis JW, Perkins LM, Smith-Barbour M, O’Regan MH (1994) Transmitter amino acid release from rat neocortex: complete versus incomplete ischemia models. Neurochem Res 19:1387–1392.
Pulsinelli WA, Brierley JB (1979) A new model of bilateral hemispheric ischemia in the unanesthetized rat. Stroke 10:267–272.
Rakos G, Kis Z, Nagy D, Lur G, Farkas T, Hortobagyi T, Vecsei L, Toldi J (2007) Evans Blue fluorescence permits the rapid visualization of non-intact cells in the perilesional rim of cold- injured rat brain. Acta Neurobiol Exp (Wars) 67:149–154.
Rampil IJ, Laster MJ (1992) No correlation between quantitative electroencephalographic measurements and movement response to noxious stimuli during isoflurane anesthesia in rats.
Anesthesiology 77:920–925.
Rex A, Voigt JP, Gustedt C, Beckett S, Fink H (2004) Anxiolytic-like profile in Wistar, but not Sprague–Dawley rats in the social interaction test. Psychopharmacology (Berl) 177:23–34.
Ricart TM, Jiao X, Pang KC, Beck KD, Servatius RJ (2011) Classical and instrumental conditioning of eyeblink responses in Wistar–
Kyoto and Sprague–Dawley rats. Behav Brain Res 216:414–418.
Riley MG, Castelli MC, Paehler EA (2009) Subchronic oral toxicity of salcaprozate sodium (SNAC) in Sprague–Dawley and Wistar rats.
Int J Toxicol 28:278–293.
Sacco RL, Chong JY, Prabhakaran S, Elkind MS (2007) Experimental treatments for acute ischaemic stroke. Lancet 369:331–341.
Saito K, Sakai N, Kim HS, Ishizuka M, Kazusaka A, Fujita S (2004) Strain differences in diazepam metabolism at its three metabolic sites in Sprague–Dawley, brown Norway, dark agouti, and Wistar strain rats. Drug Metab Dispos 32:959–965.
Sas K, Robotka H, Rozsa E, Agoston M, Szenasi G, Gigler G, Marosi M, Kis Z, Farkas T, Vecsei L, Toldi J (2008) Kynurenine diminishes the ischemia-induced histological and electrophysio- logical deficits in the rat hippocampus. Neurobiol Dis 32:302–308.
Sasaki S, Schneider H (1976) Supravital diffusion of fluorescent Evans blue in brain and spinal cord tissue. Acta Neuropathol 36:363–368.
Schmidt-Kastner R, Freund TF (1991) Selective vulnerability of the hippocampus in brain ischemia. Neuroscience 40:599–636.
Schmued LC, Hopkins KJ (2000) Fluoro-Jade B: a high affinity fluorescent marker for the localization of neuronal degeneration.
Brain Res 874:123–130.
Sharbrough FW, Messick Jr JM, Sundt Jr TM (1973) Correlation of continuous electroencephalograms with cerebral blood flow measurements during carotid endarterectomy. Stroke 4:674–683.
Siesjo BK, Hu B, Kristian T (1999) Is the cell death pathway triggered by the mitochondrion or the endoplasmic reticulum? J Cereb Blood Flow Metab 19:19–26.
Siller-Matula JM, Jilma B (2008) Strain differences in toxic effects of long-lasting isoflurane anaesthesia between Wistar rats and Sprague Dawley rats. Food Chem Toxicol 46:3550–3552.
Sugawara T, Lewen A, Noshita N, Gasche Y, Chan PH (2002) Effects of global ischemia duration on neuronal, astroglial, oligodendroglial, and microglial reactions in the vulnerable hippocampal CA1 subregion in rats. J Neurotrauma 19:85–98.
Tseng SY, Chen RC, Chong FC, Kuo TS (1995) Evaluation of parametric methods in EEG signal analysis. Med Eng Phys 17:71–78.
Valdez SR, Bonafede MM, Carreno NB, Deis RP, Jahn GA (2011) Lactation deficit in OFA hr/hr rats may be caused by differential sensitivity to stress compared with Wistar and Sprague Dawley rats. Stress.
Vered M, Bar-Joseph A, Belayev L, Berkovich Y, Biegon A (1994) Anti-ischemia activity of HU-211, a non-psychotropic synthetic cannabinoid. Acta Neurochir Suppl (Wien) 60:335–337.
Vijn PC, Sneyd JR (1998) I.v. anaesthesia and EEG burst suppression in rats: bolus injections and closed-loop infusions.
Br J Anaesth 81:415–421.
Walberer M, Stolz E, Muller C, Friedrich C, Rottger C, Blaes F, Kaps M, Fisher M, Bachmann G, Gerriets T (2006) Experimental stroke:
ischaemic lesion volume and oedema formation differ among rat strains (a comparison between Wistar and Sprague–Dawley rats using MRI). Lab Anim 40:1–8.
Walker FR, Naicker S, Hinwood M, Dunn N, Day TA (2009) Strain differences in coping behaviour, novelty seeking behaviour, and susceptibility to socially conditioned fear: a comparison between Wistar and Sprague Dawley rats. Stress 12:507–516.
Wolman M, Klatzo I, Chui E, Wilmes F, Nishimoto K, Fujiwara K, Spatz M (1981) Evaluation of the dye–protein tracers in pathophysiology of the blood–brain barrier. Acta Neuropathol 54:55–61.
Yeh TH, Hwang HM, Chen JJ, Wu T, Li AH, Wang HL (2005) Glutamate transporter function of rat hippocampal astrocytes is impaired following the global ischemia. Neurobiol Dis 18:476–483.
Zhou AM, Li WB, Li QJ, Liu HQ, Feng RF, Zhao HG (2004) A short cerebral ischemic preconditioning up-regulates adenosine receptors in the hippocampal CA1 region of rats. Neurosci Res 48:397–404.
(Accepted 19 October 2012) (Available online 26 October 2012)