Structural bioinformatics
A comprehensive assessment of long intrinsic protein disorder from the DisProt database
Marco Necci
1, Damiano Piovesan
1, Zsuzsanna Doszta´nyi
4, Peter Tompa
5,6and Silvio C. E. Tosatto
1,7,*
1
Department of Biomedical Sciences, University of Padua, 35131 Padova, Italy,
2Agricoltural Sciences, University of Udine, 33100 Udine, Italy,
3Fondazione Edmund Mach, 38010 S. Michele all’Adige, Italy,
4MTA-ELTE Lendu¨let Bioinformatics Research Group, Department of Biochemistry, Eo¨tvo¨s Lora´nd University, Budapest, Hungary,
5
Institute of Enzymology, Research Centre for Natural Sciences, Hungarian Academy of Sciences, H-1518 Budapest, Hungary,
6Structural Biology Brussels, Vrije Universiteit Brussel (VUB), and Center for Structural Biology (CSB), Flanders Institute for Biotechnology (VIB), Brussels 1050, Belgium and
7CNR Institute of Neuroscience, 35131 Padova, Italy
*To whom correspondence should be addressed.
Associate Editor: Alfonso Valencia
Received on May 11, 2017; revised on August 9, 2017; editorial decision on September 13, 2017; accepted on September 15, 2017
Abstract
Motivation:
Intrinsic disorder (ID), i.e. the lack of a unique folded conformation at physiological conditions, is a common feature for many proteins, which requires specialized biochemical experi- ments that are not high-throughput. Missing X-ray residues from the PDB have been widely used as a proxy for ID when developing computational methods. This may lead to a systematic bias, where predictors deviate from biologically relevant ID. Large benchmarking sets on experimentally validated ID are scarce. Recently, the DisProt database has been renewed and expanded to include manually curated ID annotations for several hundred new proteins. This provides a large bench- mark set which has not yet been used for training ID predictors.
Results:
Here, we describe the first systematic benchmarking of ID predictors on the new DisProt data- set. In contrast to previous assessments based on missing X-ray data, this dataset contains mostly long ID regions and a significant amount of fully ID proteins. The benchmarking shows that ID predictors work quite well on the new dataset, especially for long ID segments. However, a large fraction of ID still goes virtually undetected and the ranking of methods is different than for PDB data. In particular, many pre- dictors appear to confound ID and regions outside X-ray structures. This suggests that the ID prediction methods capture different flavors of disorder and can benefit from highly accurate curated examples.
Availability and implementation:
The raw data used for the evaluation are available from URL:
http://www.disprot.org/assessment/.
Contact:
silvio.tosatto@unipd.it
Supplementary information:Supplementary data
are available at
Bioinformaticsonline.
1 Introduction
For almost a century, our view on protein function has been domi- nated by the structure-function paradigm, which assumed that for functioning, a protein needs to fold into a stable three-dimensional (3D) structure. Due to its exquisite explanatory power, this
paradigm became practically exclusive, fueling efforts to solve struc- tures of proteins and other macromolecules on an almost industrial scale. As a result, more than 100 000 high-resolution structures have been deposited into the Protein Data Bank (PDB) (Velankaret al., 2016). Recently, however, it has been recognized that many
VCThe Author 2017. Published by Oxford University Press. All rights reserved. For Permissions, please e-mail: journals.permissions@oup.com 445 doi: 10.1093/bioinformatics/btx590
Advance Access Publication Date: 18 September 2017 Original Paper
Downloaded from https://academic.oup.com/bioinformatics/article-abstract/34/3/445/4160678 by Semmelweis University user on 06 March 2019
proteins, or regions of proteins, lack such stable 3D structures under apparently native conditions, which challenged the structure- function paradigm. These intrinsically disordered (ID) proteins or regions are prevalent in most organisms (Penget al., 2015; Xue et al., 2012). They fulfil important functions in the cell, mostly related to cellular signaling and molecular recognition (Habchi et al., 2014;van der Leeet al., 2014;Oldfield and Dunker, 2014), when they often undergo induced folding in the presence of their partner (Tompaet al., 2015). The phenomenon of structural dis- order is also under intense scrutiny because, due to their regulatory importance, disordered proteins are often implicated in diseases (Uverskyet al., 2008) and represent important drug targets (Hu et al., 2016;Joshi and Vendruscolo, 2015;Metallo, 2010).
Whereas contrasting ID proteins or regions with folded proteins might seem to provide a clear definition, there is actually no consen- sus in the field with regards of what should be considered as struc- tural disorder. As a rudimentary definition, the lack of a stable 3D fold might work, but it does not unequivocally translate to experi- mental or computational approaches to identify disorder. In accord, a variety of experiment techniques, which may be considered pri- mary (X-ray crystallography and NMR) or secondary (CD spectros- copy, limited proteolysis and many more) (Habchi et al., 2014;
Uversky and Dunker, 2012) provide different types of information on the lack of structure. It has been previously argued that ID should only be accepted when they all agree (Habchiet al., 2014). Due to technical difficulties, this consensus is not usually pursued, and thus the entries in the recently updated version of the database of protein disorder, DisProt (Piovesanet al., 2017), come in different subtypes, depending on the type of the experimental evidence that supports their annotation. In other words, structural disorder appears to come as different ‘flavors’, the relationship of which is difficult to assess at the moment. We may distinguish flavors of disorder by dis- tinct amino acid composition (Vuceticet al., 2003), backbone flexi- bility (Cilia et al., 2013; Martin et al., 2010), evolutionary conservation (Bellay et al., 2011), function (Peng et al., 2015;
Tompa, 2005;Xueet al., 2012) and length. The separation of ID re- gions into short and long disorder usually involves a threshold of 20 or 30 continuous disordered residues. By this definition, short dis- order is often present in the PDB in the form of short linkers or loops in folded proteins, whereas long disorder is underrepresented in the PDB because it poses major obstacles in structure determination.
In accord, as many entries in the previous version of DisProt (Sickmeieret al., 2007) have been identified as regions with missing coordinates in PDB X-ray structures, DisProt v 6.0 was dominated by short IDRs. The recent update (DisProt v 7.0) relies much more on NMR and secondary techniques, thus the length distribution is sig- nificantly shifted towards longer ID regions (Piovesanet al., 2017).
This notable heterogeneity has bearings on the prediction of structural disorder from sequence. Today, dozens of bioinformatics predictors are available for assigning to amino acids in a sequence the status of order or disorder (Atkinset al., 2015;Heet al., 2009).
As predictors rely on different principles, they are sensitive to the se- quence environment, biased not only by the actual protein, but also the experimental methodology used for describing its disorder. In brief, available disorder prediction methods assess structural dis- order based on: i) (amino acid) propensities, ii) pseudo-energy func- tions of inter-residue contacts, iii) machine learning approaches and iv) consensus based approaches (Atkins et al., 2015; He et al., 2009). Propensity-based predictors apply some simple statistics on the physical/chemical features of amino acids, such as amino acid composition (Priluskyet al., 2005), secondary structure propensity (Lindinget al., 2003a), or regions with high structural temperature
factors (Lindinget al., 2003b). Predictors based on pseudo-energy functions (contact potentials) rely on statistics of residue contacts in folded proteins to recognize sequence regions that are in a high- energy (and thus disordered) state (Doszta´nyi et al., 2005;
Galzitskayaet al., 2006). Machine learning algorithms (neural net- works and support-vector machines) are trained to recognize fea- tures that distinguish a collection of positive (disordered) sequences from negative (ordered) proteins (Ishida and Kinoshita, 2007;Jones and Cozzetto, 2015;Vulloet al., 2006; Wanget al., 2012,2016;
Walshet al., 2012;Zhanget al., 2017). The results of distinct algo- rithms may also be combined into meta-predictors. Such consensus- seeking algorithms (Ishida and Kinoshita, 2008; Miziantyet al., 2010;Necciet al., 2017;Walshet al., 2011;Xueet al., 2010) are more accurate than individual predictors, but they offer no indica- tion of the cause of disorder and may combine individual predictions that vary in disorder output and parameter setting.
In all, predictors in the first two categories approach structural disorder by physical principles, conveying an element of understand- ing of the reasons of structural disorder of a region. Predictors in the other two categories, on the other hand, are trained to recognize se- quences that look like other disordered sequences, propagating the uncertainty of the experimental identification of structural disorder (ascertainment bias), and do not convey a physical sense of disorder.
It should also be appreciated that distinct predictors have different sensitivity in capturing different flavors of disorder, and thus per- form differently on different ID collections, as demonstrated in the Critical Assessment of techniques for protein Structure Prediction (CASP) experiment (Monastyrskyyet al., 2014). An additional facet of applying distinct predictors is their applicability in the in-depth analysis of a single, or a very small number of, proteins, in which the maximum accuracy with a resolution down to single residues is demanded, or the high-throughput analysis of disorder in entire gen- omes for comparative and evolutionary studies (Pancsa and Tompa, 2012; Schlessinger et al., 2011). With a significant shift in our knowledgebase of structural disorder in DisProt (Piovesanet al., 2017) that underlies predictor development, these and other features of their performance should be re-assessed. To this end, we have car- ried out a comprehensive comparative analysis of novel DisProt data and the performance of disorder predictors trained on prior data.
We have previously reported a large-scale analysis of ID regions in X-ray PDB structures based on over 27 000 different proteins ex- tracted from the MobiDB database (Walshet al., 2015). In that paper, several performance measures were explored and a ranking established for a dozen fast ID predictors. Unsurprisingly, the results highlighted how methods trained on missing X-ray data generally perform better on the PDB dataset. Here, we provide a similar analysis on a dataset derived from the novel DisProt 7.0 release (Piovesanet al., 2017). The analysis was carried out in the same way as before (Walshet al., 2015) and the results can be compared directly. This will help to better char- acterize the differences between missing X-ray residues and experi- mentally determined long ID regions curated from the literature.
2 Materials and methods 2.1 Datasets and classifications
The DisProt 7.0 (Piovesanet al., 2017) sequences were downloaded and compared to the previous 6.02 release (Sickmeieret al., 2007), providing the following seven different subsets (seeTable 1). As ver- sion 7.0 is a complete re-annotation of DisProt, a ‘core’ of 488 pro- teins is also present in the previous release and these may have been used to train some of the predictors. It should be noted that the
Downloaded from https://academic.oup.com/bioinformatics/article-abstract/34/3/445/4160678 by Semmelweis University user on 06 March 2019
disorder annotation has also changed for some of these entries. The DisProt 7.0 ‘complement’ is composed of proteins not annotated in the previous release and therefore represents, in the strictest defin- ition, data ‘unseen’ for predictors. While DisProt 7.0 always maps to a single UniProt (The UniProt Consortium, 2012) sequence, this was not necessarily the case for release 6.02, reducing the number of sequences from 694 to 667. DisProt 7.0 annotations can have a dif- ferent level of confidence, ‘confident’ and ‘ambiguous’, describing confident and problematic cases respectively (Piovesanet al., 2017).
In order to be conservative, ID residues are taken directly from the DisProt ‘confident’ annotations. All residues not annotated as dis- ordered are considered ordered to limit overprediction and focus the assessment on biologically meaningful ID regions (Habchiet al., 2014). An alternative definition excluding undefined residues not annotated in DisProt and not present in the PDB is also used (see Supplementary Fig. S1 and Table S1). Multiple annotations for the same residue are consolidated into a single state (order or ID). The rationale for this conservative setup is to concentrate the prediction on bona fide ID residues in order to limit overprediction, concentrat- ing on biologically meaningful ID regions (Habchiet al., 2014).
2.2 Predictors
Predictors were initially selected to include those of the previous as- sessment on the entire PDB (Walshet al., 2015). These are (disorder definition used in parenthesis): DisEMBL (hot loops and remark 465) (Linding et al., 2003b), ESpritz (X-ray, NMR and DisProt) (Walshet al., 2012), GlobPlot (globularity) (Lindinget al., 2003a), IUPred (short and long) (Doszta´nyiet al., 2005), RONN (X-ray) (Yanget al., 2005) and VSL2b (combination of X-ray and Disprot) (Penget al., 2006). This resulted in a total of ten fast predictors with different disorder flavors. Given the relatively smaller dataset size for DisProt, several recent slower predictors requiring multiple- sequence alignments were also included. These are: AUCpred (Wang et al., 2016), Disopred3 (Jones and Cozzetto, 2015), ESpritz ‘slow’
(X-ray, NMR and DisProt) (Walshet al., 2012), Spine-D (Zhang et al., 2017), S2D (Sormanniet al., 2015) MFDp (Miziantyet al., 2010), MFDp2 (Mizianty et al., 2013) and MetaDisorder (Kozlowski and Bujnicki, 2012) in all of its flavors. Finally, MobiDB-lite (Necciet al., 2017) is included to benchmark the ef- fects of using a consensus approach of several fast predictors.
2.3 Performance assessment
The standard binary classification measures accuracy, sensitivity and specificity were calculated bothper residueand as average on a per protein basis. The Matthews Correlation Coefficient (MCC) and AUC are used in addition for a per residueassessment. For the per protein evaluation, two disorder content measures are included, Root Mean Square Error (RMSE) and Pearson Correlation Coefficient (PCC), with predicted and observed disorder content normalized by the number of annotated residues. All performance measures are calculated as detailed in(Walshet al., 2015). Finally, all measures are combined into a single overall ranking on which statistical significance is measured with the Welcht-test to deter- mine the best methods.
3 Results
3.1 DisProt disorder is different from the PDB
Partially due to the relatively limited number of entries in previous DisProt releases, ID predictors have been usually assessed on missing X-ray residues from the PDB (Monastyrskyyet al., 2014; Walsh et al., 2015). Here, we present the first full assessment of DisProt data thanks to the newly released version 7.0 (Piovesanet al., 2017).
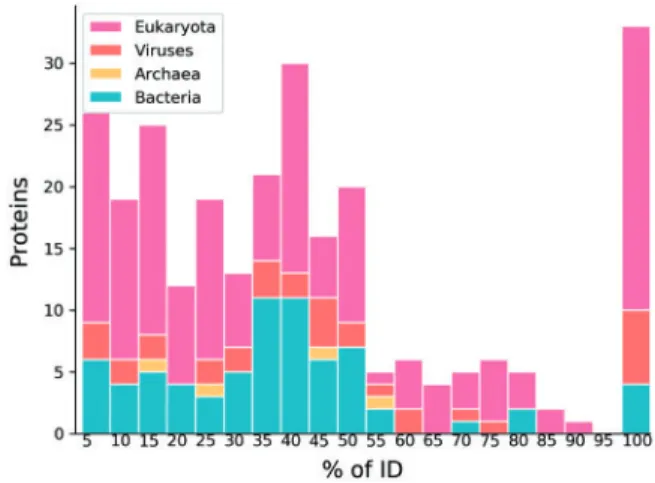
Before starting to look at predictor performance, it is interesting to see how DisProt differs from PDB missing X-ray data. Figure 1 shows the distribution of ID in the DisProt complement divided by taxonomic kingdom. Unsurprisingly, Eukaryotic sequences are most abundant, with viruses providing an additional source of ID.
The actual ID length distribution is very different from missing X-ray coordinates in the PDB. Where PDB missing X-ray data is strongly dominated by ID regions of less than 20 residues (Walsh et al., 2015), DisProt has many proteins with a large ID fraction (Piovesanet al., 2017). In DisProt, 33 out of 284 sequences are fully disordered, which is obviously not possible in the PDB. The average ID fraction per protein in the PDB is 5.2% compared to 22.7% in DisProt and the fraction of long ID regions is 13.8% in PDB and 71.8% in DisProt. Overall, the DisProt dataset appears more repre- sentative of the natural disorder distribution in proteins.Figure 2 shows the pairwise distribution of sequence identity between DisProt sequences, peaking at ca. 10% with an average of 21%, which demonstrates the highly non-redundant nature of data in DisProt. Using a 90% cutoff, the number of DisProt 7.0 entries is just slightly reduced from 803 to 752. For comparison, the reduction in PDB entries was fourfold, from 101 338 to 24 669 (Walshet al., Table 1.Dataset composition
DisProt Proteins Residues ID regions Fully ID Disorder Ordered Short Long
v 6.02 667 90 495 221 724 759 747 131
v 7.0 756 87 494 305 020 594 1408 102
Core 488 57 874 219 560 470 979 70
Complement 268 29 620 85 460 124 429 32
v 7.0 virus 70 6631 41 195 49 202 9
v 7.0 primary 581 48 996 348 518 539 637 39 v 7.0 secondary 341 59 477 333 037 55 771 84 Note: The different DisProt subsets are listed with the number of proteins, residues (disorder, order), ID regions and fully ID proteins. Short ID regions have at least five and long ID regions at least 20 consecutive residues. The DisProt v 7.0 dataset can be separated into proteins already present in DisProt v 6.02 and re-annotated (core) and new entries (complement). The last three subsets are only viral proteins (virus), proteins annotated from X-ray and NMR (primary) and indirect biochemical experiments (secondary) methods.
Fig. 1.Protein ID percentage distribution of the 284 new DisProt entries. The x-axis labels represent the rightmost boundaries of the bins
Downloaded from https://academic.oup.com/bioinformatics/article-abstract/34/3/445/4160678 by Semmelweis University user on 06 March 2019
2015). In other words, the DisProt dataset is much more diverse than PDB and sufficient to ensure an unbiased evaluation of the predictors.
3.2 Predictor performance
A large number of different ID predictors, both very fast and slower ones requiring a multiple-sequence alignment, have been bench- marked against the DisProt dataset. Results are shown (seeTable 2) per protein and per residue for the complement dataset, i.e. entries
that are not present in DisProt 6.02. This is the fairest possible benchmark, as no method was trained on the more recent DisProt entries. Results for the other three DisProt sets are similar, and not shown.
The results are coherent with the dataset differences highlighted before, i.e. long ID predictors are better on the DisProt dataset com- pared to the PDB. For example IUPred long is better than IUPred short and ESpritz-DisProt is better than the other ESpritz versions, in the PDB dataset the ranking is the opposite (Walshet al., 2015).
Notably, while the accuracy is somehow comparable with the PDB assessment, there is a significant change in the sensitivity and specifi- city. In general, for DisProt specificity decreases and sensitivity in- creases compared to the PDB. The AUC decrease from the PDB to DisProt is generally 5-10% (compare Table 2 with Walshet al., 2015). This could be explained by the fact that the DisProt dataset is more balanced than PDB. It may fit better the predictor training fea- tures, with some exceptions such as methods trained on X-ray data like ESpritz X-ray. For the same reasons the PCC has improved.
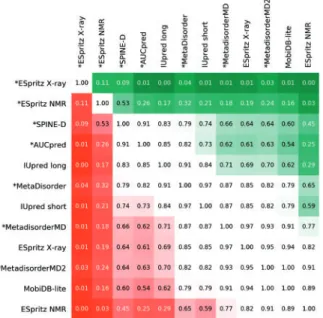
In order to establish an overall ranking, the ranking for each measure has been combined.Figure 3shows a statistical perform- ance of the top 12 ranking representing the average of the 10 differ- ent distributions calculated on the complement dataset (see also Supplementary Fig. S2). The row methods have a worse ranking than column methods when the cell is red andvice versawhen green.
Darker colors correspond to a lowerP-value (the number in the cells) and indicate a significant ranking difference. Interestingly, pre- dictors using multiple sequence alignments are not significantly bet- ter than fast methods (with the exception of ESpritz-X-ray). An even stronger difference can be seen for DisEMBL 465, which was ranked first for PDB and is in the lowest quarter for DisProt.
Fig. 2.DisProt pairwise identity distribution. Pairwise identity distribution for the core and complement datasets of Disprot 7.0. Identity percentage is the maximum symmetrical identity of each entry Blast results against Disprot 7.0 (see Materials and methods). The x-axis labels represent the rightmost boundary of each bin
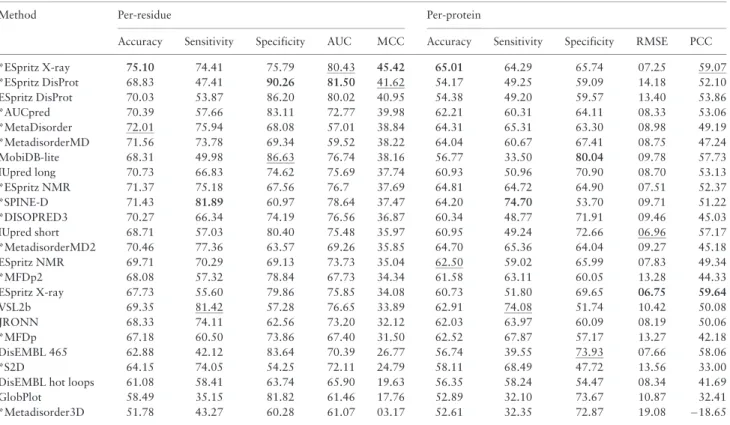
Table 2.DisProt complement performance sorted by descending MCC
Method Per-residue Per-protein
Accuracy Sensitivity Specificity AUC MCC Accuracy Sensitivity Specificity RMSE PCC
*ESpritz X-ray 75.10 74.41 75.79 80.43 45.42 65.01 64.29 65.74 07.25 59.07
*ESpritz DisProt 68.83 47.41 90.26 81.50 41.62 54.17 49.25 59.09 14.18 52.10
ESpritz DisProt 70.03 53.87 86.20 80.02 40.95 54.38 49.20 59.57 13.40 53.86
*AUCpred 70.39 57.66 83.11 72.77 39.98 62.21 60.31 64.11 08.33 53.06
*MetaDisorder 72.01 75.94 68.08 57.01 38.84 64.31 65.31 63.30 08.98 49.19
*MetadisorderMD 71.56 73.78 69.34 59.52 38.22 64.04 60.67 67.41 08.75 47.24
MobiDB-lite 68.31 49.98 86.63 76.74 38.16 56.77 33.50 80.04 09.78 57.73
IUpred long 70.73 66.83 74.62 75.69 37.74 60.93 50.96 70.90 08.70 53.13
*ESpritz NMR 71.37 75.18 67.56 76.7 37.69 64.81 64.72 64.90 07.51 52.37
*SPINE-D 71.43 81.89 60.97 78.64 37.47 64.20 74.70 53.70 09.71 51.22
*DISOPRED3 70.27 66.34 74.19 76.56 36.87 60.34 48.77 71.91 09.46 45.03
IUpred short 68.71 57.03 80.40 75.48 35.97 60.95 49.24 72.66 06.96 57.17
*MetadisorderMD2 70.46 77.36 63.57 69.26 35.85 64.70 65.36 64.04 09.27 45.18
ESpritz NMR 69.71 70.29 69.13 73.73 35.04 62.50 59.02 65.99 07.83 49.34
*MFDp2 68.08 57.32 78.84 67.73 34.34 61.58 63.11 60.05 13.28 44.33
ESpritz X-ray 67.73 55.60 79.86 75.85 34.08 60.73 51.80 69.65 06.75 59.64
VSL2b 69.35 81.42 57.28 76.65 33.89 62.91 74.08 51.74 10.42 50.08
JRONN 68.33 74.11 62.56 73.20 32.12 62.03 63.97 60.09 08.19 50.06
*MFDp 67.18 60.50 73.86 67.40 31.50 62.52 67.87 57.17 13.27 42.18
DisEMBL 465 62.88 42.12 83.64 70.39 26.77 56.74 39.55 73.93 07.66 58.06
*S2D 64.15 74.05 54.25 72.11 24.79 58.11 68.49 47.72 13.56 33.00
DisEMBL hot loops 61.08 58.41 63.74 65.90 19.63 56.35 58.24 54.47 08.34 41.69
GlobPlot 58.49 35.15 81.82 61.46 17.76 52.89 32.10 73.67 10.87 32.41
*Metadisorder3D 51.78 43.27 60.28 61.07 03.17 52.61 32.35 72.87 19.08 18.65
Note: All values are shown as percentages. The top performing method in each category is shown in bold and the second best underlined. Methods marked ‘*’, rely on multiple sequence alignments. Accuracy, sensitivity and specificity are calculated per residue (left) and per protein (right). AUC and MCC are per residue.
RMSE and PCC are calculated per protein and based on disorder content.
Downloaded from https://academic.oup.com/bioinformatics/article-abstract/34/3/445/4160678 by Semmelweis University user on 06 March 2019
3.3 Performance on different subsets
One of the most interesting features of the DisProt dataset is the availability of different annotations beyond the well-known missing X-ray data from the PDB. These include NMR and especially indir- ect biochemical methods (termed ‘secondary’ in DisProt). Especially the longer ID regions in DisProt are dominated by secondary meth- ods, which include a wide array of biochemical techniques providing indirect evidence for ID (Piovesanet al., 2017). Albeit susceptible to some experimental errors, these provide a complementary view of ID where structural methods fail due to the intrinsic difficulty in determining ID regions. It is therefore interesting to see how the dif- ferent predictors fare on these peculiar subsequences with a set of predominantly long ID regions.Figure 4shows the performance dif- ference between primary and secondary methods on the full DisProt 7.0 dataset sorted by decreasing MCC. Almost all predictors im- prove considerably, in particular those detecting long regions such as IUpred long, ESpritz-DisProt and MobiDB-lite. The ranking is also changed to the benefit of faster methods (seeFig. 4). In this case, the overall improvement can not be explained by a better bal- ancing between positive and negative examples (as for PDB), since disorder content for secondary methods is 15.2% compared to 22.3% of the full DisProt. Conversely, the number of long regions increases from 71.8 to 94.0%. Short regions are more difficult to predict and a higher number of regions increase the probability of making errors.
Figure 5shows the same analysis performed on the subset of viral proteins. Viral proteins are known to have extensive disorder, due to the evolutionary pressure on having a compact genome with high functional density, combined with an ability to evade the im- mune system (Daveyet al., 2011). Similarly to secondary methods this dataset is enriched in long regions (81.2%). In this case the
improvement is less relevant and there is not a clear distinction be- tween long and short predictors. Instead, a contribution to the im- provement, even if weak, can be related to evolutionary information since all the three different ESpritz flavors improve when exploiting conservation. These observations probably releate to the higher rate of evolutionary variation of viral proteins, which attests to how structural disorder can combine functionality with relaxed evolu- tionary selection pressure (Xueet al., 2014).
3.4 Consensus of disorder predictions
Given the similar performance of several ID predictors, it is worth investigating how much these agree on the actual regions of dis- order. To this end, we evaluated the consensus among ten fast ID predictors (three ESpritz, two DisEMBL and two IUPred flavors, plus GlobPlot, VSL2b and RONN) in terms of their agreement on defining ID regions. To be more statistically significant, the evalu- ation was carried out on the entire DisProt 7.0 dataset.Figure 6 shows how only a strong majority of at least 8 out of 10 methods labeling a region ID has a probability of over 50% of being correct.
Perhaps more troubling, only about a third of the total ID residues are covered by this consensus approach. A similar proportion of ID residues has an intermediate number (i.e. 4–7) of predictors agreeing and the rest goes virtually undetected. In other words, while the pre- dictors have similar overall performances, the actual ID residues being predicted are quite divergent and a large fraction of ID re- mains undetected. These results are still encouraging, as more ID was left undetected in the PDB (Walshet al., 2015). It would appear that the predictors have gathered a basic understanding of the se- quence signal for ID, but are rather fuzzy on cases closer to the clas- sification boundary. This is probably due to the lack of good training data which will improve as more high-quality ID an- notation becomes available. Overall, this situation suggests that Fig. 3.Top 12 average ranking of prediction methods on the complement data-
set. Methods marked ‘*’ rely on multiple sequence alignments. Methods are ranked on the basis of scores inTable 2, resulting in 10 rankings per method (ranking distribution). The Welcht-testP-value is shown inside each box as computed over all ranking distributions. Dark green background color is used if the method on thex-axis is significantly better than the one on they-axis. Red background color is the opposite, i.e.x-axis method is significantly worse. Due to space constraints, only the top 12 methods are shown. The full figure is shown asSupplementary Figure S2(Color version of this figure is available at Bioinformaticsonline.)
Fig. 4.Difference in performance between secondary and primary methods on the full DisProt 7.0. Methods are ordered by decreasing MCC on the DisProt 7.0 secondary dataset, shown left. On the right panel, thex-axis repre- sents the improvement of secondary over primary methods. Accuracy is scaled in the [0–1] range. The delta RMSE is negative to follow thex-axis dir- ection. Methods marked ‘*’ rely on multiple sequence alignments
Downloaded from https://academic.oup.com/bioinformatics/article-abstract/34/3/445/4160678 by Semmelweis University user on 06 March 2019
combining several fast ID predictors using a stronger majority threshold can provide good results and explains the performance of MobiDB-lite (Necciet al., 2017).
3.5 ID versus non-structure prediction
The ID definition used in DisProt prediction focuses on regions where disorder is thought to be functionally relevant (Piovesan et al., 2017). Many disorder predictors instead are trained to recog- nize missing residues in X-ray PDB structures as a proxy for ID. In- between may exist undefined residues, which are neither bona fide ID (in DisProt) nor structured (in the PDB; seeSupplementary Fig.
S1). Indeed, 53.2% of residues in the DisProt 7.0 dataset fall in the undefined category (see Supplementary Fig. S3). Repeating the assessment excluding undefined residues yields overall consistent results, with two points standing out. The specificity of several pre- dictors trained on X-ray data and using multiple sequence align- ments is increased by up to 20% with consequent increases in AUC and MCC (seeSupplementary Table S2). As the specificity increase is uneven between predictors, the ranking also fluctuates (see Supplementary Figs S4–S6).
This may suggest either that the assessment is biased or that the predictors are not specifically trained to recognize ID. To help elu- cidate the difference, we plot the amino acid composition of the different residue types inFigure 7. The composition for disorder and structure follow well-established opposite trends, with lack of hydrophobic and increase in charged residues denoting ID.
Undefined residues however are generally close to the dataset aver- age and resemble structure more than ID. This suggests that func- tional ID regions are a separate phenomenon, which stand out with a different amino acid composition as opposed to being just the con- trary of structure. This may also help explain differences in ranking between the assessment with or without undefined residues. The
upshot from this subtle difference is that many ID predictors, trained on X-ray structure data with limited ID, are likely predicting the ab- sence of structure instead. This is understandable given the previous lack of bona fide ID regions in large enough numbers but highlights an opportunity for future improvement.
4 Discussion
We have presented the first evaluation of a large number of ID pre- dictors on a large curated set of proteins experimentally determined to be intrinsically disordered. This was possible due to the recent up- grade of the DisProt database (Piovesanet al., 2017). Previous crit- ical assessments for ID prediction were based on missing X-ray data Fig. 5.Difference in performance between viral and non-viral proteins on the
full DisProt 7.0 dataset. Methods are ordered by decreasing MCC on the viral DisProt 7.0 dataset, shown left. On the right panel, thex-axis represents the improvement on viral over non-viral proteins. Accuracy is scaled in the [0–1]
range. The delta RMSE is negative to followx-axis direction. Methods marked
‘*’ rely on multiple sequence alignments
Fig. 6.Proportion of disordered and structured residues in DisProt 7.0 annota- tion as a function of ten methods predicting disorder. Each pie chart shows the fraction of disorder and structure at a given number of methods predict- ing a certain residue as disordered, ranging from 0 (i.e. none) to 10. The bar plots one the left aggregate data for each row showing the dataset coverage.
This is the sum of structured and disordered residues of the row divided by the total number of structured or disordered residues in the dataset
Fig. 7.Distribution of the twenty amino acids in different fractions of the DisProt complement dataset. Amino acids are shown in increasing Kyte- Doolittle hydrophobicity from left to right. The percentage of enrichment is calculated using the entire dataset as reference. Notice how disorder and structure are complementary. Undefined residues are broadly comparable to structure but generally closer to average, with the exceptions of serine and threonine
Downloaded from https://academic.oup.com/bioinformatics/article-abstract/34/3/445/4160678 by Semmelweis University user on 06 March 2019
from PDB structures (Monastyrskyy et al., 2014; Walsh et al., 2015). In CASP, this situation has been acknowledged as being not optimal (Monastyrskyyet al., 2014) and ultimately led to the dis- continuing of the disorder prediction category. In contrast, the DisProt 7.0 dataset provides just the type of long disorder important for protein function. This difference is exemplified by the signifi- cantly higher fraction of long ID regions in DisProt (71.8%) com- pared to the PDB (13.8%). Hence, the benchmarking results we obtained were far from obvious.
In order to allow a fair comparison to previous results based on the PDB, the analysis and performance measures were chosen to be identical to our previous work (Walshet al., 2015). The results have been overall consistent, as ID predictors are clearly able to recognize the longer disordered regions from the DisProt dataset. In terms of several performance measures, results are comparable to those ob- tained in the PDB. However, a few trends emerge.
First of all, the actual ranking is different depending on whether predictors are benchmarked on DisProt or PDB data. E.g. DisEMBL 465 was performing well on PDB data (Walshet al., 2015), but is now in the lowest quarter of the ranking. Other methods trained on longer ID regions (e.g. IUpred-long) perform better than on the PDB. This is compounded when looking at specific subsets of the DisProt 7.0 data, such as secondary methods or viral proteins. Here, the ranking is further changed compared to the PDB dataset. It ap- pears that the ID predictors are able to capture a strong signal for disorder in the sequence, but are not well trained on subtler cases such as non-ID residues outside X-ray structures. In fact, a lot of ID in the dataset still goes undetected (seeFig. 6). This may also help explain the previously noted decrease in ID predictor performance when predicting entire UniProt sequences (Walshet al., 2015).
As second interesting observation is the difference between ‘fast’
(i.e. single-sequence) methods able to predict ID for a typical protein sequence in less than a second compared to those requiring multiple sequence alignments (typically from Blast) as input. The latter have proven quite popular in the literature, e.g. Jones and Cozzetto (2015),Sormanniet al.(2015),Wanget al.(2016) andZhanget al.
(2017), but are generally three orders of magnitude slower than
‘fast’ methods (Walshet al., 2012). Our benchmarking on DisProt shows that the difference in performance is probably not sufficient to justify the severe reduction in speed for most applications.
Indeed, training on more high quality data is likely to provide a larger performance gain.
In conclusion, the benchmarking of ID predictors on DisProt 7.0 has provided interesting results which we anticipate will give food for thought to methods developers. Acknowledging the subtle differ- ence between ID and other regions outside X-ray structures is a first step. The observed significant differences in changes of predictor performance upon updating DisProt data warrants that structural disorder does come in different flavors, and a continuous improve- ment of both data quality/consistency, and disorder predictors is ne- cessary for improving consistency of our concepts of structural disorder. To assist in these efforts, as the analysis pipeline is straight- forward to execute on future DisProt updates, we plan to run similar assessments periodically to help the user community understand the strengths and limits of predictors for intrinsic disorder. We encour- age interested developers to contact us if they would like their method to be included in the future.
Acknowledgements
The authors are grateful to the DisProt consortium for providing invaluable expert curation on intrinsic disorder in proteins.
Funding
This work has been supported by COST Action BM1405 (NGP-net). D.P. is an FIRC research fellow [16621]. Z.D. acknowledges the support of the Hungarian Academy of Sciences ‘Lendu¨let’ Grant [LP201418/2016] and the Hungarian Scientific Research Fund [OTKA K 108798 to ZD]. P.T. was sup- ported by the Odysseus grant G.0029.12 from Research Foundation Flanders (FWO). Part of the work was supported by AIRC IG grant 17753 to S.T.
Conflict of Interest: none declared.
References
Atkins,J.D.et al. (2015) Disorder prediction methods, their applicability to different protein targets and their usefulness for guiding experimental stud- ies.Int. J. Mol. Sci.,16, 19040–19054.
Bellay,J.et al. (2011) Bringing order to protein disorder through comparative genomics and genetic interactions.Genome Biol.,12, R14.
Cilia,E.et al. (2013) From protein sequence to dynamics and disorder with DynaMine.Nat Commun.,4, 2741.
Davey,N.E.et al. (2011) How viruses hijack cell regulation.Trends Biochem.
Sci.,36, 159–169.
Doszta´nyi,Z.et al. (2005) The pairwise energy content estimated from amino acid composition discriminates between folded and intrinsically unstruc- tured proteins.J. Mol. Biol.,347, 827–839.
Galzitskaya,O.V.et al. (2006) Prediction of amyloidogenic and disordered re- gions in protein chains.PLoS Comput. Biol.,2, e177.
Habchi,J.et al. (2014) Introducing protein intrinsic disorder.Chem. Rev., 114, 6561–6588.
He,B.et al. (2009) Predicting intrinsic disorder in proteins: an overview.Cell Res.,19, 929–949.
Hu,G.et al. (2016) Untapped Potential of Disordered Proteins in Current Druggable Human Proteome.Curr. Drug Targets,17, 1198–1205.
Ishida,T. and Kinoshita,K. (2007) PrDOS: prediction of disordered protein re- gions from amino acid sequence.Nucleic Acids Res.,35, W460–W464.
Ishida,T. and Kinoshita,K. (2008) Prediction of disordered regions in proteins based on the meta approach.Bioinformatics,24, 1344–1348.
Jones,D.T. and Cozzetto,D. (2015) DISOPRED3: precise disordered region predictions with annotated protein-binding activity. Bioinformatics,31, 857–863.
Joshi,P. and Vendruscolo,M. (2015) Druggability of intrinsically disordered proteins.Adv. Exp. Med. Biol.,870, 383–400.
Kozlowski,L.P. and Bujnicki,J.M. (2012) MetaDisorder: a meta-server for the prediction of intrinsic disorder in proteins.BMC Bioinformatics,13, 111.
van der Lee,R.et al. (2014) Classification of intrinsically disordered regions and proteins.Chem. Rev.,114, 6589–6631.
Linding,R.et al. (2003a) GlobPlot: Exploring protein sequences for globular- ity and disorder.Nucleic Acids Res.,31, 3701–3708.
Linding,R.et al. (2003b) Protein disorder prediction: implications for struc- tural proteomics.Structure,11, 1453–1459.
Martin,A.J.M.et al. (2010) MOBI: a web server to define and visualize struc- tural mobility in NMR protein ensembles.Bioinformatics,26, 2916–2917.
Metallo,S.J. (2010) Intrinsically disordered proteins are potential drug targets.
Curr. Opin. Chem. Biol.,14, 481–488.
Mizianty,M.J.et al. (2010) Improved sequence-based prediction of disordered re- gions with multilayer fusion of multiple information sources.Bioinformatics, 26, i489–i496.
Mizianty,M.J.et al. (2013) MFDp2.Intrinsically Disordered Proteins,1, e24428.
Monastyrskyy,B.et al. (2014) Assessment of protein disorder region predic- tions in CASP10.Proteins,82, 127–137.
Necci,M.et al. (2017) MobiDB-lite: Fast and highly specific consensus predic- tion of intrinsic disorder in proteins.Bioinformatics,33, 1402–1404.
Oldfield,C.J. and Dunker,A.K. (2014) Intrinsically disordered proteins and in- trinsically disordered protein regions.Annu. Rev. Biochem.,83, 553–584.
Pancsa,R. and Tompa,P. (2012) Structural disorder in eukaryotes.PLoS One, 7, e34687.
Peng,K.et al. (2006) Length-dependent prediction of protein intrinsic dis- order.BMC Bioinformatics,7, 208.
Downloaded from https://academic.oup.com/bioinformatics/article-abstract/34/3/445/4160678 by Semmelweis University user on 06 March 2019
Peng,Z.et al. (2015) Exceptionally abundant exceptions: comprehensive char- acterization of intrinsic disorder in all domains of life.Cell. Mol. Life Sci., 72, 137–151.
Piovesan,D.et al. (2017) DisProt 7.0: a major update of the database of dis- ordered proteins.Nucleic Acids Res.,45, D1123–D1124.
Prilusky,J.et al. (2005) FoldIndex: a simple tool to predict whether a given protein sequence is intrinsically unfolded.Bioinformatics,21, 3435–3438.
Schlessinger,A.et al. (2011) Protein disorder—a breakthrough invention of evolution?Curr. Opin. Struct. Biol.,21, 412–418.
Sickmeier,M.et al. (2007) DisProt: the Database of Disordered Proteins.
Nucleic Acids Res.,35, D786–D793.
Sormanni,P.et al. (2015) The s2D method: simultaneous sequence-based pre- diction of the statistical populations of ordered and disordered regions in proteins.J. Mol. Biol.,427, 982–996.
The UniProt Consortium (2012) Reorganizing the protein space at the Universal Protein Resource (UniProt).Nucleic Acids Res.,40, D71–D75.
Tompa,P.et al. (2015) Intrinsically disordered proteins: emerging interaction specialists.Curr. Opin. Struct. Biol.,35, 49–59.
Tompa,P. (2005) The interplay between structure and function in intrinsically unstructured proteins.FEBS Lett.,579, 3346–3354.
Uversky,V.N.et al. (2008) Intrinsically disordered proteins in human diseases:
introducing the D2 concept.Annu. Rev. Biophys.,37, 215–246.
Uversky,V.N. and Dunker,A.K. (2012) Multiparametric analysis of intrinsic- ally disordered proteins: looking at intrinsic disorder through compound eyes.Anal. Chem.,84, 2096–2104.
Velankar,S.et al. (2016) PDBe: improved accessibility of macromolecular structure data from PDB and EMDB.Nucleic Acids Res.,44, D385–D395.
Vucetic,S. et al. (2003) Flavors of protein disorder. Proteins, 52, 573–584.
Vullo,A.et al. (2006) Spritz: a server for the prediction of intrinsically dis- ordered regions in protein sequences using kernel machines.Nucleic Acids Res.,34, W164–W168.
Walsh,I.et al. (2015) Comprehensive large-scale assessment of intrinsic pro- tein disorder.Bioinformatics,31, 201–208.
Walsh,I.et al. (2011) CSpritz: accurate prediction of protein disorder segments with annotation for homology, secondary structure and linear motifs.
Nucleic Acids Res.,39, W190–W196.
Walsh,I.et al. (2012) ESpritz: accurate and fast prediction of protein disorder.
Bioinformatics,28, 503–509.
Wang,S.et al. (2016) AUCpreD: proteome-level protein disorder prediction by AUC-maximized deep convolutional neural fields.Bioinformatics,32, i672–i679.
Xue,B.et al. (2012) Orderly order in protein intrinsic disorder distribution:
disorder in 3500 proteomes from viruses and the three domains of life.
J. Biomol. Struct. Dyn.,30, 137–149.
Xue,B.et al. (2010) PONDR-FIT: a meta-predictor of intrinsically disordered amino acids.Biochim. Biophys. Acta,1804, 996–1010.
Xue,B.et al. (2014) Structural disorder in viral proteins.Chem. Rev.,114, 6880–6911.
Yang,Z.R.et al. (2005) RONN: the bio-basis function neural network tech- nique applied to the detection of natively disordered regions in proteins.
Bioinformatics,21, 3369–3376.
Zhang,T.et al. (2017) Intrinsic Disorder and Semi-disorder Prediction by SPINE-D.Methods Mol. Biol.,1484, 159–174.
Downloaded from https://academic.oup.com/bioinformatics/article-abstract/34/3/445/4160678 by Semmelweis University user on 06 March 2019