Diversity of dynamical phenomena in type II Cepheids of the OGLE collection
R. Smolec,
1?P. Moskalik,
1E. Plachy,
2,3I. Soszyński,
4A. Udalski
41Nicolaus Copernicus Astronomical Center of the Polish Academy of Sciences, ul. Bartycka 18, PL-00-716 Warszawa, Poland
2Konkoly Observatory, MTA CSFK, Konkoly Thege Miklós út 15-17, H-1121 Budapest, Hungary
3MTA CSFK Lendület Near-Field Cosmology Research Group
4Warsaw University Observatory, Al. Ujazdowskie 4, PL-00-478 Warszawa, Poland
Accepted XXX. Received YYY; in original form ZZZ
ABSTRACT
We have analysed the photometry of 924 type II Cepheids from the Galactic bulge ob- served by the Optical Gravitational Lensing Experiment. Our goal was to detect and analyse various dynamical phenomena, including, e.g. multi-mode pulsation, period- doubled pulsation, period-kpulsation, or quasi-periodic modulation of pulsation. First examples of double-mode BL Her-type stars, pulsating simultaneously in the funda- mental and first overtone modes are reported. Two double-mode pulsators are not iso- lated cases however, but form an extension of recently identified class of long-period RRd stars. Period doubling effect was detected in three BL Her-type stars: two were identified previously and one is a new discovery. Through identification of numerous period-doubled W Vir stars we show that the appearance of the period doubling effect, and hence the transition towards RV Tau class, is a smooth process that starts at pul- sation periods slightly above 15 d. Interchange of the deep and shallow pulsation cycles is identified in tens of RV Tau variables. One RV Tau star is a strong candidate for period-4 pulsation. Quasi-periodic modulation of pulsation in all sub-classes of type II Cepheids is reported for the first time. Modulation was detected in 16 BL Her, 9 W Vir and in 7 RV Tau stars. In the last case, modulation is the most likely scenario, but two other scenarios, excitation of non-radial modes, or period-4 pulsation, can also account for the observed pulsation pattern. Irregular changes of pulsation amplitude and period on various time-scales are common in all subgroups of type II Cepheids.
Key words: stars: variables: Cepheids – stars: oscillations – stars: Population II – Galaxy: bulge
1 INTRODUCTION
Type II Cepheids are low-mass, population II stars, pulsat- ing in the radial fundamental mode. They are divided into three groups based on their pulsation period: BL Her stars, with pulsation periods between1and5d, W Vir stars, with pulsation periods between 5 and 20d, and RV Tau stars with pulsation periods above 20d. The distinctive feature of the latter group, is a period doubling (PD) phenomenon.
The light curve shows alternating deep and shallow bright- ness minima/maxima. The borderlines between the three groups are conventional and a bit arbitrary; different values can be found in the literature (for a summary, seeCatelan
& Smith 2015). In the Magellanic Clouds,Soszyński et al.
(2008, 2010) put the borderline between the BL Her and
? E-mail: smolec@camk.edu.pl
W Vir classes at a shorter period of4d. The three classes are believed to correspond to different phases of the post- horizontal branch evolution (Gingold 1985;Catelan & Smith 2015), we note however, that evolutionary status of type II Cepheids and their sub-groups is still a poorly studied sub- ject. Within the W Vir class, a subgroup of peculiar W Vir (pW Vir) stars, which are brighter and bluer, and show a characteristic asymmetry in the light curve, was identified bySoszyński et al. (2008). RV Tau stars are also divided into two sub-classes: RVa stars, with roughly constant mean brightness, and RVb stars, which exhibit additional long- period variation of the mean brightness.
Type II Cepheids obey a period-luminosity relation.
Since they are fainter than classical Cepheids, and their P−L relation has a much higher dispersion, their use as distance indicators is not that common. On the other hand, type II Cepheids are extremely interesting in their own right,
arXiv:1809.02842v1 [astro-ph.SR] 8 Sep 2018
as complex dynamical systems. Pulsation of these low-mass giants is strongly non-adiabatic and non-linear. Their pulsa- tion is rarely as regular as clockwork. The longer the pulsa- tion period the more irregular their pulsation is. In addition, at periods above20d, the period doubling phenomenon be- comes common.
The complex dynamical behaviour of type II Cepheids was a subject of several theoretical investigations. Large- amplitude radial pulsation can be modelled with non-linear pulsation codes. The early calculations were purely radia- tive. Kovács & Buchler(1988) conducted a large survey of radiative, non-linear models of type II Cepheids. In a typ- ical model sequence, three types of dynamical behaviour were detected as pulsation period was increasing. The short- est period models displayed a regular limit-cycle pulsa- tion. For longer periods, period doubled pulsation was ob- served; first with two, then with four, eight etc., brightness minima/maxima per repetition period (hereafter period-2, period-4, period-8, etc., pulsation). Such PD cascade ulti- mately led to a third type of dynamical behaviour, the de- terministic chaos. In the more luminous models, the transi- tion to chaos was occurring through a tangent bifurcation.
Using the amplitude equation formalism,Moskalik & Buch- ler (1990) showed, that period doubling may be triggered by the half-integer resonances between the radial pulsation modes.
It is extremely challenging to detect chaotic dynamics in the variability of long-period pulsators, as long, uninter- rupted and precise observations are necessary. Still, the ev- idence for chaotic dynamics was reported in three type II Cepheids of RV Tau type (R Sct, AC Her and DF Cyg;Buch- ler, Kolláth & Serre 1996;Kolláth et al. 1998;Plachy, Bódi
& Kolláth 2018, respectively) as well as in several more lu- minous semi-regular variables (Buchler, Kolláth & Cadmus 2004), and in Mira-type variable (Kiss & Szatmáry 2003).
Period doubling on the other hand, is relatively easy to detect and is a well known, distinct feature of RV Tau vari- ables. However, in the radiative models ofKovács & Buchler (1988), the PD behaviour appears at a much shorter pulsa- tion periods than observed (above∼7−10d). PD was found in even shorter period, BL Her-type models by Buchler &
Moskalik(1992). They found a robust PD behaviour in the period range between 2.0 and 2.6 d, caused by the 3:2 reso- nance between the radial fundamental and radial first over- tone modes. They concluded that PD effect should also be present in real stars. It took 20 years however, till their pre- diction was confirmed, when the first period-doubled BL Her star was identified in the OGLE data (Soszyński et al. 2011;
Smolec et al. 2012).
The discovery of period doubled BL Her star shows a great predictive power of non-linear pulsation models. The period doubled pulsation and chaotic dynamics are not the only predictions of non-linear models. The recent convective models of type II Cepheids show, that we may expect quasi- periodic modulation of pulsation (Smolec & Moskalik 2012;
Smolec 2016), or the full wealth of dynamical behaviours characteristic for deterministic chaos, including, e.g. type- I and type-III intermittency, or period-(2k+ 1) pulsation (Smolec & Moskalik 2014).
The aim of this paper is to search for various dynam- ical phenomena in the pulsation of type II Cepheids using the OGLE Galactic bulge data (Soszyński et al. 2017). The
Table 1.Approximate dates and Julian Date ranges for the first seven observing seasons of OGLE-IV in the Galactic bulge.
season start – end date approximate JD range (dd-mm-yyyy) (JD−2 450 000) s1 05-03-2010 – 07-11-2010 5261 – 5508 s2 03-02-2011 – 22-11-2011 5596 – 5888 s3 30-01-2012 – 11-11-2012 5957 – 6243 s4 03-02-2013 – 04-11-2013 6327 – 6601 s5 29-01-2014 – 01-11-2014 6687 – 6963 s6 06-02-2015 – 08-11-2015 7088 – 7335 s7 25-01-2016 – 30-10-2016 7413 – 7692
OGLE collection is the largest in existence, and consists of the longest series of homogeneous photometric data for type II Cepheids. The OGLE data and adopted methods of data analysis are presented in Sect. 2, results are presented in Sect. 3 and discussed in Sect. 4. Summary concludes the paper.
2 DATA ANALYSIS
The OGLE collection of variable stars consists of 924 type II Cepheids (Soszyński et al. 2017), of which 350 were in- cluded in the OGLE-III Catalog of Variable Stars (Soszyński et al. 2011). During OGLE-IV, which has started in March, 2010 (Udalski, Szymański & Szymański 2015), brightness of 873 type II Cepheids is monitored. Of these, 372 are of BL Her type, 366 are of W Vir type, and 135 are of RV Tau type. The data sampling is typically much better than dur- ing OGLE-III. Hence, OGLE-IV I-band data are our pri- mary data source.V-band data are also available for most of the stars but they are scarce. The data that we analyse cover seven observing seasons (more than2400d), hereafter abbreviated as s1,. . . , s7. The corresponding, approximate Julian Date ranges are given in Tab.1. The number of the data points strongly vary from field to field, from about100 points in the least observed fields, up to more than13 000 points in the most observed fields.
For 299 stars of the OGLE-IV sample, data from the earlier phase of the OGLE project are available (Soszyński et al. 2011). We merge the data only exceptionally, however.
This is because data are often of different quality, with typ- ically much worse sampling during OGLE-III. In addition, the variability of type II Cepheids is often irregular, result- ing in strong, broad, non-stationary signals in the frequency spectrum, that increase the noise level, and complicate the analysis. In many cases, increasing the time base only wors- ens the problem. We also note that there might be system- atic differences between the OGLE-III and OGLE-IV pho- tometry: the zero points and the pulsation amplitudes may slightly differ. The latter effect (amplitude change) is most likely due to the filter change and indeed in some stars we observe tiny amplitude differences between OGLE-III and OGLE-IV data (see, e.g. Fig.20).
The initial analysis follows a standard consecutive prewhitening technique. Periodicities present in the data are identified with the help of the discrete Fourier transform (DFT). Next, the data are fitted with a Fourier series of the
MNRAS000,1–28(2018)
following form:
m(t) =m0+X
i
Aisin(2πfit+φi), (1)
in whichfiare independent frequencies detected in the data and Ai and φi are respective amplitudes and phases. All quantities are adjusted using non-linear least square pro- cedure. In all cases, the solution includes frequency of the fundamental mode, f0, and its harmonics, kf0. Residuals from the fit are searched for additional periodicities with the DFT. In the equation above we include only resolved fre- quencies. The formal frequency resolution of the transform is1/∆T (∆T – data length), but we adopt a more conserva- tive criterion and regard two frequencies as resolved, if their separation is larger than2/∆T.
During the procedure, we remove the obvious outliers and model the slow trends with polynomial function. A care and constant inspection of the data is needed however, as quite often the data deviate from the fit due to, e.g. strong phase changes, while trends may in fact be connected to a star itself or its direct neighbourhood. This is the case for RVb variables, in which periodic large amplitude varia- tion of the mean brightness is most likely due to obscura- tion by a surrounding disc (Kiss & Bódi 2017). Other two examples of interesting variability detected in the residu- als are illustrated in Fig. 1. In the top panel we show a section of residuals for OGLE-BLG-T2CEP-1991 (BL Her;
P0 = 1.021186d) with a clear symmetric brightening that is most likely due to microlensing event (see Soszyński et al. 2013,2014; Wyrzykowski et al. 2006, for similar exam- ples). Admittedly, due to large crowding within 1 arcsec, we cannot rule out that, in fact, other nearby source experi- enced a gravitational microlensing episode. In the residuals of T2CEP-222 (BL Her; P0 = 1.147797d) variability with a period ofPorb= 27.13d is present. Data folded with this period are plotted in the bottom panel of Fig.1. The light curve resembles ellipsoidal variability in systems with eccen- tric orbits (see, e.g.Soszyński et al. 2004). In the frequency spectrum we detect two combination frequencies,f0−forb
andf0+ 2forb, which indicate that additional variability is intrinsic to T2CEP-222 and not due to contamination.
Since we analyse ground-based and seasonal data, both daily and 1-yr aliases are prominent in the window function and sometimes may become a source of confusion during the analysis. A few such cases are explicitly discussed in the text.
The very common complication in the analysis of type II Cepheids is non-stationary nature of the dominant vari- ability. The amplitude and phase of the fundamental mode slowly vary in an irregular way. As a result, after the prewhitening with the fundamental mode and its harmon- ics, strong residual power remains in the frequency spec- trum. The shorter the time-scale of irregular variations, the broader the power excess observed atf0. The highest peak within the power excess is typically placed at a location un- resolved withf0. Similar structures are observed at the har- monic frequencies. Such signals strongly increase the noise level in the Fourier transform and may easily hide other low-amplitude signals present in the data.
1 From now on, we drop the first part of the star’s ID.
Figure 1. Two examples of additional variability detected in the residual data: microlensing event in the residuals of BL Her- type variable T2CEP-199 (top panel) and ellipsoidal variability in T2CEP-222 (bottom panel).
Figure 2.Period distribution for all type II Cepheids for which data are available for seven observing seasons (solid line) and for stars in which unresolved remnant power is detected atf0 after the prewhitening (dashed line). Incidence rates of such stars for the three sub-classes of type II Cepheids, separated with thin vertical lines, are given in the plot.
To quantify the problem, in Fig.2 we plot the period distribution for type II Cepheids (solid line) and, separately, for those stars in which unresolved remnant power is de- tected atf0 after the prewhitening (dashed line). Note that to construct the plot we have only used the stars for which data were collected during all observing seasons, s1,. . . , s7 (∼80 per cent of the OGLE sample). Unresolved remnant power is detected in30per cent of BL Her stars,60per cent of W Vir stars and41per cent of RV Tau stars.
To study the amplitude/phase changes, and to get rid of the unwanted power excess at kf0, we use the time- dependent Fourier analysis (Kovács, Buchler & Davis 1987) followed by a time-dependent prewhitening (Moskalik et al.
2015, the Appendix). In a nutshell, the data are divided into chunks of roughly equal length, ∆t. We fix the pulsation
Figure 3. Time-dependent Fourier analysis for W Vir star T2CEP-126. Amplitude and phase changes are plotted in the top and bottom panels respectively. The data were divided into groups of approximately equal length of∆t≈270d (one season;
black circles) or∆t≈50d (red triangles). Data were fitted with cubic splines to better visualise the changes.
frequency,f0, and fit the sine series to each of the chunks separately. Since f0 is fixed, period changes are absorbed in a phase coefficient, φ1. In the next step, we conduct a time-dependent prewhitening. The individual sine series are subtracted from the corresponding data chunks. Amplitudes and phases of the sine series are kept constant within each data chunk. The residuals are inspected for the presence of additional signals. Obviously, the procedure is sensitive only to the amplitude/phase changes on a time scale longer than
∆t. In the data prewhitened this way, any possible changes on a time scale longer than∆tare filtered out.
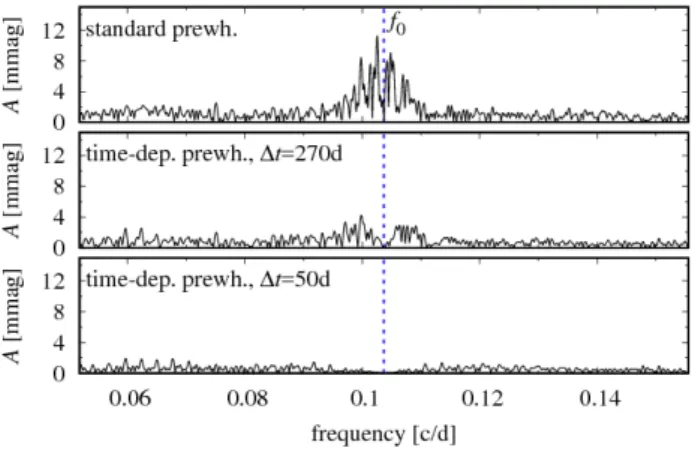
The procedure and the sensitivity of the results to∆t are illustrated in Fig. 3 (time-dependent Fourier analysis) and in Fig.4 (frequency spectra) with the help of W Vir- type star, T2CEP-126 (P0 = 9.64566d). With∆t= 270d (which is∼observing season’s length), amplitude and phase clearly vary in time and the changes are strong, and aperi- odic. As a result, in the frequency spectrum after standard prewhitening with the fundamental mode and its harmon- ics, we find a strong remnant power (top panel of Fig. 4).
After the time-dependent prewhitening with ∆t = 270d, the power excess is reduced, but does not vanish. Significant power, centred atf0 with a broad minimum in the middle, is still observed in the frequency spectrum (middle panel of Fig.4). It indicates that there is a significant variability on a time scale shorter than ∼270 d. Indeed, with∆t= 50d, changes on a time scale of a few tens of days are unam- biguously revealed (triangles and dashed lines in Fig. 3).
The changes are irregular. With∆t= 50d, time-dependent prewhitening effectively cleans the frequency spectrum – no additional significant signals are detected (bottom panel of Fig.4).
In practice, there is a lower limit for ∆t, motivated by the number of data points. In addition, ∆t should be longer than the pulsation period, so at least a few cycles are covered. Only then the amplitudes and phases can be de- termined reliably. The latter constraint becomes important, e.g. for RV Tau stars in which the length of a period-doubled cycle can amount to a significant fraction of the observing season.
We stress that time-dependent prewhitening was con-
Figure 4.Time-dependent prewhitening illustrated for T2CEP- 126 with a section of frequency spectrum centred atf0. Top panel:
standard prewhitening. Middle panel: time-dependent prewhiten- ing with∆t≈270d. Bottom panel: time-dependent prewhitening with∆t≈50d. Dashed vertical line in the panels marks the loca- tion off0.
ducted only when it was necessary, i.e. when strong remnant power was present in the frequency spectrum after stan- dard prewhitening. The value of∆t was adjusted for each star individually, based on the quality of the data (number of data points and their sampling) and the pulsation pe- riod. In many of the analysed stars, time-dependent analysis on a season-to-season basis was the only possibility. Quite often, the following time-dependent prewhitening led to a
∼symmetric structure aroundf0, similar to that in the mid- dle panel of Fig.4. It may mimic the modulation side-peaks, but in fact, it reflects nothing more than irregular variability on a time-scale shorter than observing season.
In this study, the irregular variability of the fundamen- tal mode, clearly worth a separate study (in prep.), is an unwanted complication. The phenomena we are particularly interested in are multi-mode pulsation, period-doubling phe- nomenon (in general, period-kpulsation) and quasi-periodic modulation of pulsation.
In the time domain, the PD phenomenon manifests as alternating deep and shallow brightness maxima/minima.
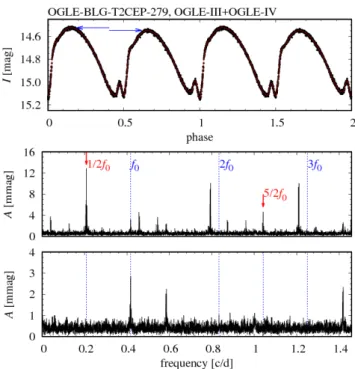
We illustrate it in the top panel of Fig.5with the help of T2CEP-279 (P0 = 2.399260d), the first BL Her stars with period doubling effect. In the frequency spectrum, the PD phenomenon manifests as signals at sub-harmonic frequen- cies, i.e. at(2n+ 1)f0/2. In the case when PD is a regular phenomenon, its signature in the Fourier transform is a set of coherent peaks located exactly at the sub-harmonic fre- quencies. These peaks can be prewhitened with sine waves of constant amplitude/phase. It is illustrated in the bottom panels of Fig.5
Interchanges (switching) of the deep and shallow min- ima/maxima may also occur. We illustrate this in the top panels of Fig. 6 in which we phase the data for RV Tau variable T2CEP-034 (P0 = 22.4498d), for three observing seasons separately. The deep/shallow minima clearly switch between s1 and s3; during s2 the PD effect is barely notice- able. The effect may also be strongly irregular or transient.
Switching PD, or irregular effect, manifest as more complex structures in the frequency spectrum. It is illustrated in the
MNRAS000,1–28(2018)
Figure 5. Top panel: phased light curve for BL Her-type star T2CEP-279 showing clear PD effect. Arrows visualize the differ- ences in the brightness maxima of the consecutive cycles. Mid- dle and bottom panels: frequency spectrum for T2CEP-279 af- ter prewhitening with the fundamental mode and its harmonics (dashed lines). In the middle panel, two signals located at sub- harmonic frequencies (f0/2and5f0/2) are marked with arrows;
other signals are daily aliases. In the bottom panel, all signals de- tected at sub-harmonic frequencies were prewhitened. The only remaining signal is unresolved withf0 (its daily aliases are also present).
bottom panel of Fig.6for T2CEP-034. Power excesses, cen- tred atf0/2and3f0/2are clear, but exactly at the locations of the sub-harmonic frequencies, marked with arrows, min- ima are noticeable. Further examples will be presented in Sect.3.4.
For period-k pulsation, the light curve repeats afterk fundamental mode pulsation cycles. In the frequency spec- trum, we expect to detect signals centred at f0/k and its harmonics.
Periodic modulation of pulsation manifests as equally spaced multiplets centred at the pulsation frequency and its harmonics. Frequency separation within the multiplet cor- responds to the modulation frequency, fm. The signal at the modulation frequency, which corresponds to the mod- ulation of mean stellar brightness, may also be detected.
Amplitudes of the multiplet components may be strongly asymmetric depending, e.g. on the phase relation between the amplitude and phase modulation, see Benkő, Szabó &
Paparó(2011). For low-amplitude modulation and ground- based data, modulation typically manifests as triplets at the pulsation frequency, i.e. peaks atf0 and f0±fm, and also at the harmonics. In case one of the triplet components is missing, we detect doublets, see, e.g.Smolec et al.(2015) or Smolec (2016) in which we analysed low-amplitude modu- lations in the OGLE data for RR Lyrae stars and classical Cepheids, respectively. To claim the modulation we require
Figure 6.Top panels: phased light curves for RV Tau-type star T2CEP-034 plotted separately for three consecutive observing seasons. Interchange of the deep/shallow minima in between s1 and s3 is clear. Bottom panel: frequency spectrum for the three observing seasons of T2CEP-034, after prewhitening with the fun- damental mode and its harmonics (dashed lines). Power excesses, centred at sub-harmonic frequencies, with minima in the middle, are clearly detected.
the detection of at least two peaks related to a modulation with a common frequency.
3 RESULTS
3.1 Double-mode F+1O BL Her stars
Two short-period BL Her stars have been identified as double-mode pulsators.
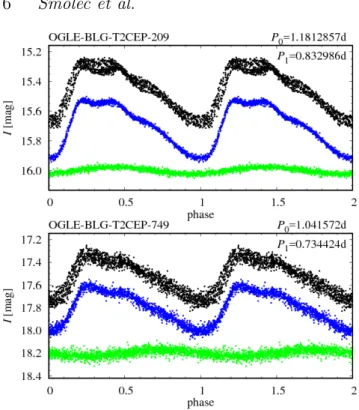
T2CEP-209. Only OGLE-III data are available for the star. In addition tof0= 0.8465353(4)c d−1and its harmon- ics (up to7f0), we detectf1 = 1.200501(3)c d−1 and sev- eral linear combination frequencies (11 in total). We note that three secondary periodicities were given already in the OGLE catalog: one corresponds tof1, the other two cor- respond tof0+f1 and 2f0+f1. The additional periodicity has low amplitude,A1= 0.0237mag (A1/A0= 0.13). In the top panel of Fig.7we present the light curves for T2CEP- 209. From top to bottom the light curves are: original data folded withP0and the disentangled light curves correspond- ing to the dominant mode (middle light curve) and to the low-amplitude variability (bottom light curve; sine wave).
T2CEP-749. In addition to f0 = 0.9600873(9)c d−1 and its harmonics (up to 5f0), we clearly detect f1 = 1.361612(5)c d−1and several linear combination frequencies (f0+f1, 2f0+f1, 3f0+f1, 4f0+f1, f1−f0, f0+ 2f1 and 2f0+ 2f1). The additional periodicity is of low amplitude,
Figure 7. Folded light curves for T2CEP-209 (top panel) and T2CEP-749 (bottom panel). Three curves in each panel corre- spond to: all data folded with fundamental mode period (top) and to disentangled light curves for radial fundamental mode (mid- dle) and radial first overtone (bottom). The two latter curves are shifted in magnitude to allow comparison.
A1 = 0.0267mag (A1/A0 = 0.15). In the bottom panel of Fig.7we present the light curves for T2CEP-749, organised in the same way as for T2CEP-209.
The period ratios,P1/P0= 0.7052for T2CEP-209, and nearly the same value,0.7051, for T2CEP-749, indicate that these might be the first double-mode BL Her stars pulsating simultaneously in the radial fundamental mode and radial first overtone. As we discuss below, their properties fit well into other group of double-mode pulsators identified recently in the OGLE data, the extreme RRd stars (Smolec et al.
2016). With their periods, P0 = 1.1812857(5)d (T2CEP- 209) andP0= 1.041572(1)d (T2CEP-749), very close to the borderline between RR Lyrae and BL Her stars, they would be the longest-period members of this group, now spanning across both classes.
In Fig. 8 we show the Petersen diagram in which we marked the location of classical RRd stars (dots), extreme RRd stars identified bySmolec et al.(2016) – four firm stars (large filled circles) and a few candidates (open circles), and of T2CEP-209 and T2CEP-749 (diamonds). Both BL Her stars have slightly longer periods than OGLE-BLG-RRLYR- 07283, the longest-period double-mode pulsator identified bySmolec et al.(2016), and a slightly larger period ratios.
Smolec et al. (2016) calculated a grid of linear pulsation models and showed that for majority of these long-period double-mode pulsators suitable models, in which radial fun- damental and radial first overtone are simultaneously unsta- ble, can be found. Here we just overplot two sequences of lu- minous models that run close to the locations of BL Her stars (green and red circles). These models have M = 0.5 M,
Figure 8.Petersen diagram for classical RRd stars (small dots) and long-period double-mode pulsators identified in the OGLE Galactic bulge data: RR Lyrae stars (circles) and BL Her stars (diamonds). Two sequences of linear pulsation models, both with M = 0.5 M and L = 70 L, but with different metallicities, [Fe/H] = 0and[Fe/H] =−1.5, ares plotted with circles. Higher metallicity models are plotted with red circles and lower metal- licity ones with green circles.
L = 70 L and [Fe/H] = 0 (red circles) or[Fe/H] =−1.5 (green circles). Consecutive models in a sequence cross the instability strip horizontally with25K-step in effective tem- perature. Further details of the models are given inSmolec et al.(2016), in particular period ratios for the full model grid are plotted in their fig. 12. Filled circles correspond to mod- els in which both radial modes are simultaneously unstable.
Match with the location of both BL Her stars is reasonable.
For T2CEP-209 both model sequences match the position of the star very well, but in these models only the funda- mental mode is unstable. For higher metallicity, the domain in which the two radial modes are simultaneously unstable is closer. For T2CEP-749 the higher metallicity models are clearly better. We note that only for metal rich models, with highL/Mratio, the two radial modes can be simultaneously unstable at long fundamental mode periods and low period ratios. In all discussed long-period double-mode variables it is the fundamental mode that dominates the pulsation. Am- plitude of the first overtone is only a small fraction of the fundamental mode’s amplitude.
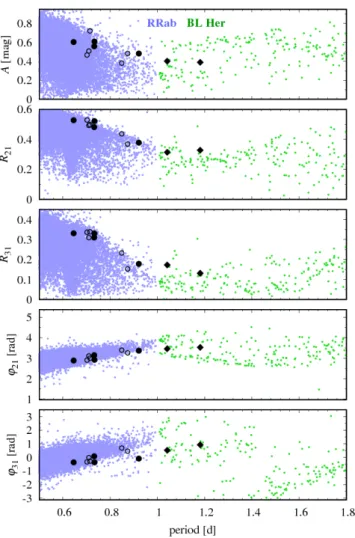
T2CEP-209, T2CEP-749 and extreme RRd stars, cover a rather large area in the Petersen diagram. All these stars have long periods and low period-ratios (as compared to RRd stars), and they have a similar shape of the light curve of the dominant fundamental mode. This is best quantified with the help of the Fourier decomposition parameters (Si- mon & Lee 1981), which we plot in Fig.9. The consecutive panels show peak-to-peak amplitude, amplitude ratios,R21
andR31, and Fourier phasesϕ21andϕ31, plotted vs. the pul- sation period. Parameters for fundamental mode RR Lyrae stars (RRab stars) are plotted with small bluish dots, while parameters for BL Her stars are plotted with green dots.
The other discussed stars are plotted with the same sym- bols as in Fig.8, and they form a well defined group in the Fourier parameter plots. As compared with RRab stars, we note, that at a given period, the peak-to-peak amplitude and
MNRAS000,1–28(2018)
Figure 9.Peak-to-peak amplitude (top panel) and Fourier pa- rameters,R21,R31,ϕ21, andϕ31, plotted against the pulsation period for RRab stars (bluish dots), BL Her variables (green dots) and double-mode variables discussed in the text (large symbols).
amplitude ratios are among the highest observed for RRab stars. The Fourier phases, on the other hand, are among the lowest. The two BL Her star fall well within the progression formed by shorter-period double-mode RR Lyrae stars.
A noticeable feature in the light curves of T2CEP-209 and T2CEP-749 is a bump located on the descending branch (Fig.7). In T2CEP-209, which is of longer period, the bump actually distorts the maximum light. The bump may also be noticed on the descending branch of extreme RRd stars – see fig. 2 inSmolec et al.(2016). Considering the whole group, the bump location depends on the pulsation period – the longer the period the higher the bump location on the de- scending branch. This bump progression may be caused by the 2:1 resonance between the fundamental mode and the second overtone as inferred from fig. 13 in Smolec (2016).
The same resonance may also be crucial for excitation of the double-mode pulsations in these stars. We plan to inves- tigate this possibility in more detail in a separate study.
We conclude that T2CEP-209 and T2CEP-749 are new members of the class first identified bySmolec et al.(2016), which now spans across the RR Lyrae and BL Her classes.
We note that the commonly adopted boundary between
RR Lyrae and BL Her stars, at pulsation period of 1 d is just a convention. Physically, both groups are low-mass, popula- tion II stars that evolve away the ZAHB.
3.2 Period doubling in BL Her variables
In total, three BL Her-type variables show a PD phe- nomenon. Two stars were already reported in the past, based on the analysis of OGLE-III data. T2CEP-279 was the first BL Her star with PD effect, reported bySoszyński et al.(2011) andSmolec et al.(2012). In the same papers, T2CEP-257 was announced as a candidate. For both stars new OGLE-IV data are available. The third star, T2CEP- 820, briefly announced inSmolec et al.(2018), is analysed in detail for the first time. Basic data for these stars are collected in Tab.2.
T2CEP-279(P0= 2.399260d) is the only BL Her star in which PD is a persistent phenomenon and is clearly visible in the phased light curve, which we present in Fig.5. Cur- rently, the OGLE data for this star span more than5550d, which corresponds to more than 2300 fundamental mode pulsation cycles. The phenomenon is very stable, no inter- changes of the deep/shallow minima/maxima are observed.
This is also confirmed by the analysis of the frequency spec- trum, section of which is plotted in the middle and bot- tom panels of Fig.5. In addition to the fundamental mode and its harmonics (detected up to17f0, but without 13f0
and14f0), sub-harmonics atf0/2and from5f0/2to13f0/2 are clearly detected. The peak at f0/2 is the highest with A1/2/A0 = 0.048(Tab.2). Interestingly, there is no signifi- cant signal at3f0/2. The peaks at sub-harmonic frequencies are coherent, see the bottom panel of Fig.5. Residual, unre- solved power is detected atf0, which results from: (i) slow phase drift and, (ii) a slight (≈7mmag) amplitude change between OGLE-III and OGLE-IV observations. As the am- plitude change occurred in between two phases of the OGLE, we cannot rule out the instrumental origin of this change (see Sect.2).
OGLE-III data forT2CEP-257(P0= 2.245698d) were analysed in detail by Smolec et al. (2012). Due to a pe- riod change, only a section of the data was analysed. The only detected sub-harmonic (f0/2) was very weak, with am- plitude of 2.9mmag. The effect was barely visible in the folded light curve. In Fig. 10we show the frequency spec- trum for OGLE-IV data after prewhitening with the fun- damental mode and its harmonics. First we note that f0
and its harmonics are non-stationary; residual, unresolved power remains in the frequency spectrum at their location.
Time-dependent Fourier analysis clearly shows that the pul- sation period slowly changes. The expected locations of sub- harmonic frequencies are marked with arrows, and indeed, several significant peaks are present there. T2CEP-257 has a somewhat unfortunate pulsation frequency, however. As 4.5f0 ≈2c d−1, the location of the sub-harmonics overlap with the location of daily aliases of the residual signals at kf0. Indeed, at the interesting locations we observe a broad- ened peaks with multiple maxima. In the folded light curve (top-right panel of Fig.10) a signature of the PD effect is barely noticeable.
Due to above mentioned unfortunate pulsation fre- quency, we cannot use time-dependent prewhitening to get rid of the period changes that complicate the analysis – this
Table 2.Basic characteristics of BL Her-type variables with PD effect. Consecutive columns contain: star’s ID, period and amplitude of the fundamental mode, amplitude of the highest peak detected atf0/2,A1/2, as determined from the analysis of all OGLE-IV data, and list of all sub-harmonic frequencies detected in the data.
star’s ID P0(d) A0(mag) A1/2(mag) sub-harmonic frequencies T2CEP-279 2.399260(1) 0.2810 0.0134 f0/2,5f0/2−13f0/2 T2CEP-257 2.245698(1) 0.2438 0.0029 f0/2,5f0/2−9f0/2 T2CEP-820 2.4005048(4) 0.2612 0.0014 f0/2
Figure 10.Transient PD phenomenon in BL Her-type star T2CEP-257. The top row shows the analysis of all OGLE-IV data, while the bottom row shows the analysis for s6 only. Left panels show the frequency spectrum after prewhitening with the fundamental mode and its harmonics (dashed lines). Locations of the sub-harmonic frequencies are indicated with arrows. Right panels show the light curve folded with the pulsation period,P0. Even and odd pulsation cycles are plotted with different colours to visualise the PD effect. Insets show zooms around the brightness maximum.
technique would remove the signals at sub-harmonic fre- quencies as well. Instead, we conducted a seasonal analysis.
The bottom row of Fig. 10shows the result for s6. During one season period changes are insignificant and there is no remnant power atkf0. Sub-harmonics are now clearly identi- fied; for peaks atf0/2,5f0/2and7f0/2we have a detection well above the S/N = 4.0. The peak at f0/2 is the high- est withA1/2/A0 = 0.012(Tab.2). Folded light curve also clearly shows the PD effect. Interestingly, the effect seems to be restricted to s6. Only in the preceding season, s5, we have a significant detection of only one sub-harmonic (at f0/2, S/N = 4.3). Hence, PD in T2CEP-257 is a transient phenomenon, present in some of the observing seasons only.
It is also the case for the earlier OGLE-III observations.
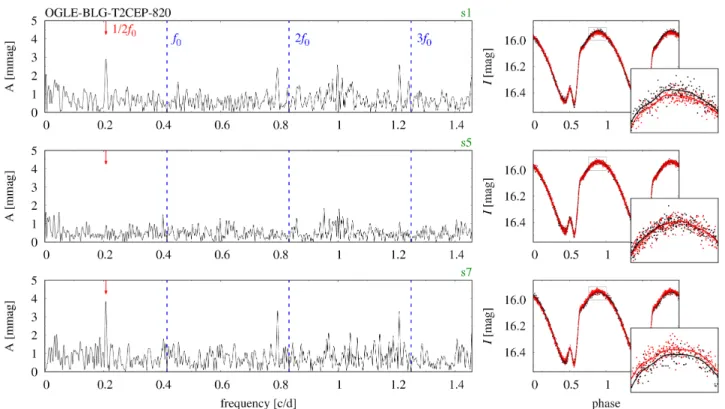
T2CEP-820 (P0 = 2.4005048d) was observed only during the fourth phase of the OGLE project. Signature of PD was detected in the frequency spectrum as a sig- nal at sub-harmonic frequency, f0/2. The signal is pro- nounced (S/N = 6.0); still its amplitude is only≈1.4mmag (A1/2/A0= 0.005; Tab.2). We note that in this star season- to-season zero point offsets are significant and must be re- moved in the analysis. Residual power atf0is also detected and time-dependent Fourier analysis indicates it is due to period change. In addition, much weaker signals (all with 3.0<S/N <3.5) centred at 5f0/2, 7f0/2 and 9/2f0 are present in the spectrum. All these signals have a complex structure, similar to that displayed in the bottom panel of Fig.6, which suggests that the PD effect is irregular. It is
confirmed by seasonal analysis of the data, illustrated in Fig.11. Signatures of PD (signals at f0/2) are clear only during s1 (top panel of Fig.11), s6 and s7 (bottom panel of Fig.11). In between, no significant power at sub-harmonic frequencies is detected, as illustrated for s5 – middle panel of Fig. 11. Folded light curves presented in the right pan- els of Fig. 11confirm the frequency analysis. The effect is noticeable close to the brightness maximum during s1 and s7, and is not present in s5. Interestingly, the deep/shallow maxima interchange.
We postpone a more detailed discussion of the PD effect in BL Her-type stars to Sect.4. Here we just note that all discussed stars occupy a narrow period range and have very similar light curve shapes. In all stars the sub-harmonic at f0/2is the highest, while there is no significant detection at 3f0/2, which appears surprising, as signals at higher- order sub-harmonics are detected (at least in T2CEP-279 and T2CEP-257).
3.3 Period doubling in W Vir stars
The20d borderline between W Vir stars and RV Tau vari- ables is a convention. Not surprisingly, single stars that do show the PD effect and have period slightly shorter than20d were reported, e.g. bySoszyński et al. (2008,2011,2017);
Plachy et al.(2017);Plachy, Kovács & Forgács-Dajka(2018).
W Vir itself (P0≈17.27d), the prototype of the class, also shows a weak PD effect (Templeton & Henden 2007). On the
MNRAS000,1–28(2018)
Figure 11.Transient and switching PD phenomenon in BL Her-type variable T2CEP-820. Separate analysis for three observing seasons, s1, s5 and s7 is presented in three consecutive rows. Left panels show the frequency spectrum after prewhitening with the fundamental mode and its harmonics (dashed lines). Location of thef0/2sub-harmonic frequency is indicated with an arrow. Right panels show the light curve folded with the pulsation period,P0. Even and odd pulsation cycles, and respective Fourier fits, are plotted with different colours to visualise the PD effect. Insets show zooms around the brightness maximum.
other hand, there are type II Cepheids with no PD alterna- tions and periods above 20d. They are formally classified as RV Tau stars in the OGLE catalogues but, as noted by Soszyński et al.(2017), such stars may also be classified as yellow semi-regular variables (SRd stars).
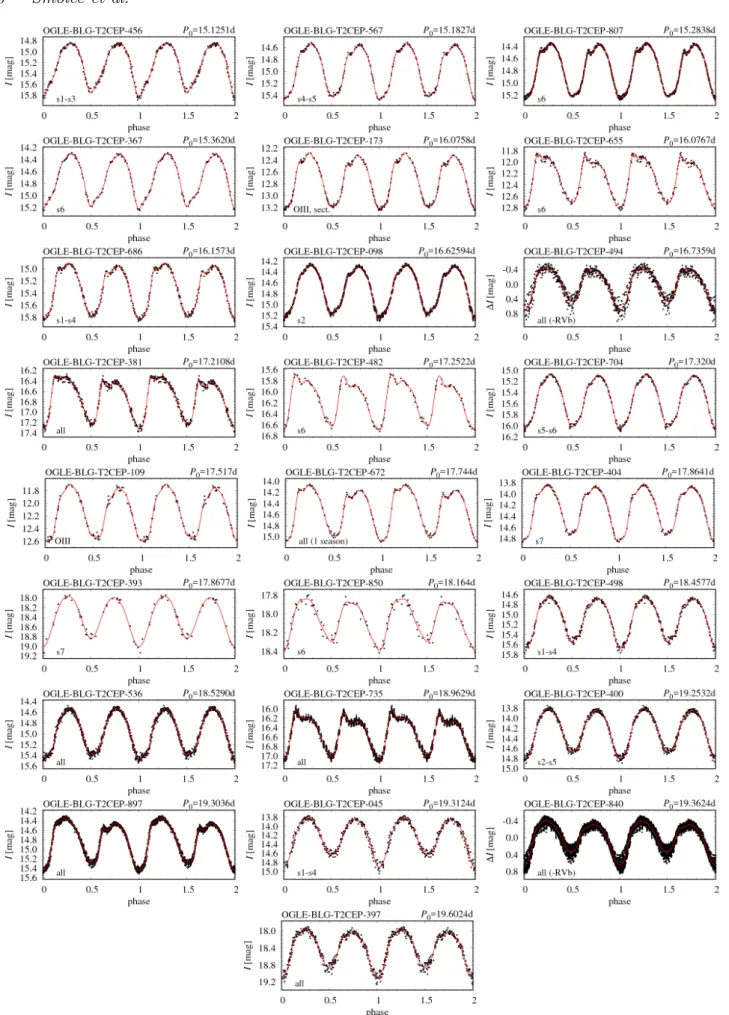
The large number of type II Cepheids in the analysed sample allows us to study the appearance of the PD phe- nomenon in the transition between W Vir and RV Tau classes. In total, we have detected a signature of the pe- riod doubling effect in 25 stars with periods shorter than 20d, and thus formally classified as W Vir stars. Two of them, T2CEP-045 and T2CEP-494, were reported earlier bySoszyński et al.(2011,2017). To claim the PD effect we require: (i) the detection of a significant power excess cen- tred at sub-harmonic frequencies in the frequency spectrum of all data or of their section, possibly after time-dependent prewhitening, and (ii) direct detection of the alternations in the light curve for all data or for their section. In Tab.3we have collected the basic properties of period doubled W Vir stars. Consecutive columns list: star’s ID, period and ampli- tude of the fundamental mode,P0 andA0, amplitude of the highest peak atf0/2,A1/2, list of the detected sub-harmonic components (broad structures centred at sub-harmonic fre- quency are indicated with parenthesis) and remarks. For all the stars light curves folded with 2P0 are presented in Fig.12. In Fig.13we show the sections of the corresponding frequency spectra after prewhitening with the fundamental mode and its harmonics (dashed lines). Exact locations of the sub-harmonic frequencies,f0/2 and3f0/2, are marked with arrows and thin dotted lines.
We note that T2CEP-672 was observed for only one sea- son, hence the peaks in the frequency spectrum in Fig.13are particularly wide. For T2CEP-735 scarce data are available for all observing seasons, but only two seasons are densely sampled, which gives rise to peculiar appearance of peaks in its frequency spectrum. Nevertheless, for both stars the PD effect is clearly visible in the light curves as Fig.12shows (for T2CEP-735 alternations are best visible for brightness maxima).
In T2CEP-494 and T2CEP-840 additional long-period variation is superimposed on the pulsation light curves – a phenomenon observed in RV Tau stars of the ‘b’-type (RVb).
It was subtracted from the light curves displayed in Fig.12.
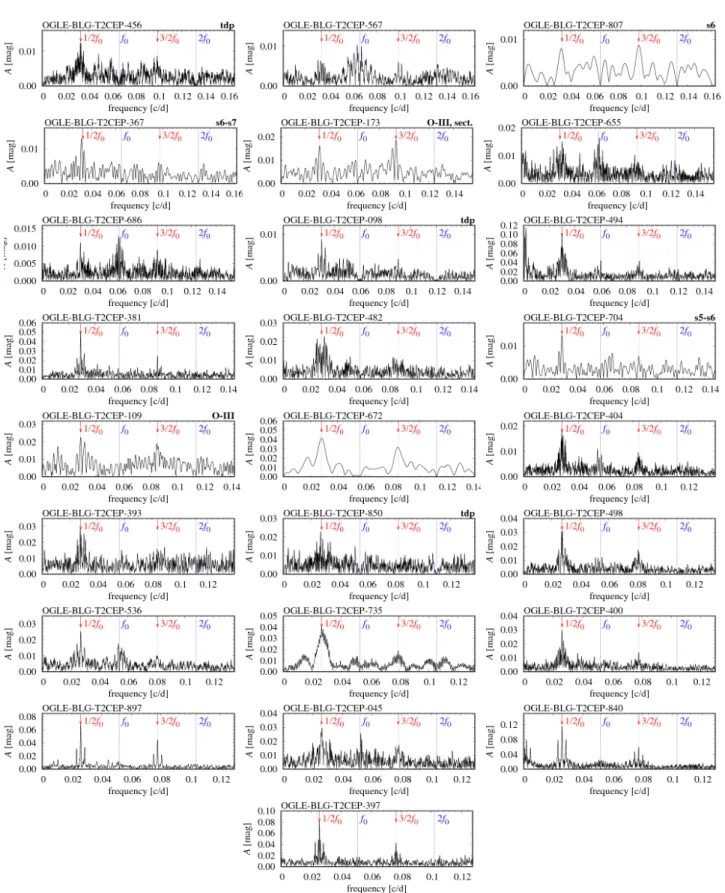
The PD effect becomes more regular as period in- creases. This is well visible in the frequency spectra shown in Fig. 13. For stars with shorter periods, below ≈18 d, the peaks located at sub-harmonic frequencies are typically non-coherent (remnant power remains after the prewhiten- ing), or we observe more complex structures centred at sub- harmonic frequencies (e.g. wide structures in T2CEP-655, T2CEP-494, or in T2CEP-482). In the time domain, such structures correspond either to the transient (PD is present in only some of the observing seasons) or irregular nature of the effect (e.g. varying depth of alternations; ‘iPD’ in the remarks column of Tab.3), or to the switching of the deep and shallow pulsation cycles (‘sPD’ in the remarks column of Tab.3). For this reason, for some stars displayed in Fig.12, we used data for specific observing seasons only (indicated in the bottom left corners of the panels) to better visualise the PD effect. Switching of the deep and shallow cycles is
Figure 12.A collection of light curves for type II Cepheids with periods in the 15−20d range that show the PD effect. Star’s ID, pulsation period and data that were used in the plot are given in each panel. Stars are sorted by the increasing pulsation period.
MNRAS000,1–28(2018)
Figure 13.A collection of frequency spectra for type II Cepheids with periods in the15−20d range that show the PD effect. Each panel shows a section of the frequency spectrum in the(0,2.5f0)range after prewhitening with the fundamental mode and its harmonics (blue dashed lines). In some cases, time-dependent prewhitening was used, which is indicated with ‘tdp’ in the top right corner of the plots. Red arrows indicate the location off0/2and3f0/2sub-harmonics. Stars are sorted by the increasing pulsation period.
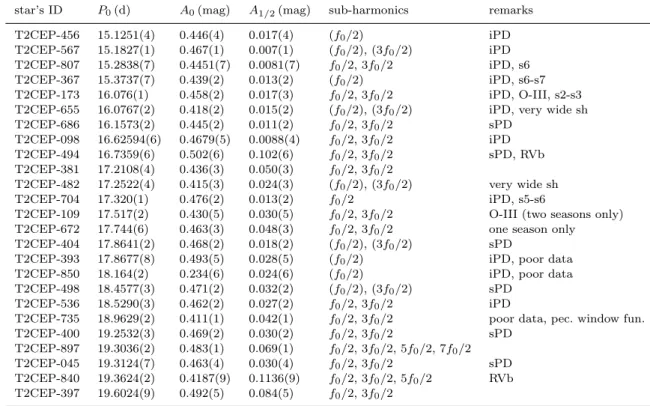
Table 3.Data for type II Cepheids with periods shorter than20d, and thus formally classified as W Vir stars, that show the PD effect.
The consecutive columns contain: star’s ID, pulsation period, pulsation amplitude, amplitude of the sub-harmonic at f0/2, list of all sub-harmonics detected (broad structures centred at sub-harmonic frequency are indicated with parenthesis) and remarks. Amplitudes are derived from the analysis of all OGLE-IV data, unless specific season(s) is(are) indicated in the last column.
star’s ID P0(d) A0(mag) A1/2(mag) sub-harmonics remarks
T2CEP-456 15.1251(4) 0.446(4) 0.017(4) (f0/2) iPD
T2CEP-567 15.1827(1) 0.467(1) 0.007(1) (f0/2), (3f0/2) iPD T2CEP-807 15.2838(7) 0.4451(7) 0.0081(7) f0/2,3f0/2 iPD, s6
T2CEP-367 15.3737(7) 0.439(2) 0.013(2) (f0/2) iPD, s6-s7
T2CEP-173 16.076(1) 0.458(2) 0.017(3) f0/2,3f0/2 iPD, O-III, s2-s3 T2CEP-655 16.0767(2) 0.418(2) 0.015(2) (f0/2), (3f0/2) iPD, very wide sh T2CEP-686 16.1573(2) 0.445(2) 0.011(2) f0/2,3f0/2 sPD
T2CEP-098 16.62594(6) 0.4679(5) 0.0088(4) f0/2,3f0/2 iPD T2CEP-494 16.7359(6) 0.502(6) 0.102(6) f0/2,3f0/2 sPD, RVb T2CEP-381 17.2108(4) 0.436(3) 0.050(3) f0/2,3f0/2
T2CEP-482 17.2522(4) 0.415(3) 0.024(3) (f0/2), (3f0/2) very wide sh
T2CEP-704 17.320(1) 0.476(2) 0.013(2) f0/2 iPD, s5-s6
T2CEP-109 17.517(2) 0.430(5) 0.030(5) f0/2,3f0/2 O-III (two seasons only) T2CEP-672 17.744(6) 0.463(3) 0.048(3) f0/2,3f0/2 one season only T2CEP-404 17.8641(2) 0.468(2) 0.018(2) (f0/2), (3f0/2) sPD
T2CEP-393 17.8677(8) 0.493(5) 0.028(5) (f0/2) iPD, poor data
T2CEP-850 18.164(2) 0.234(6) 0.024(6) (f0/2) iPD, poor data
T2CEP-498 18.4577(3) 0.471(2) 0.032(2) (f0/2), (3f0/2) sPD T2CEP-536 18.5290(3) 0.462(2) 0.027(2) f0/2,3f0/2 iPD
T2CEP-735 18.9629(2) 0.411(1) 0.042(1) f0/2,3f0/2 poor data, pec. window fun.
T2CEP-400 19.2532(3) 0.469(2) 0.030(2) f0/2,3f0/2 sPD T2CEP-897 19.3036(2) 0.483(1) 0.069(1) f0/2,3f0/2,5f0/2,7f0/2 T2CEP-045 19.3124(7) 0.463(4) 0.030(4) f0/2,3f0/2 sPD T2CEP-840 19.3624(2) 0.4187(9) 0.1136(9) f0/2,3f0/2,5f0/2 RVb T2CEP-397 19.6024(9) 0.492(5) 0.084(5) f0/2,3f0/2
detected in T2CEP-686, T2CEP-494, T2CEP-404, T2CEP- 498, T2CEP-400 and T2CEP-045. This phenomenon is fre- quent in longer-period RV Tau stars and will be discussed in more detail in Sect.3.4.
This numerous sample of period-doubled W Vir stars allows us to demonstrate that the emergence of the PD ef- fect is a gradual process that starts at pulsation periods slightly above 15 d. This is illustrated in Tab. 4. We have divided the sample into five bins with pulsation periods in the range 15−16d, 16−17d, till 19−20d, as given in the first column of Tab. 4. The second column shows the number of period doubled stars within a bin, the third col- umn shows the total number of stars in a bin and the fourth column gives the corresponding incidence rate. In all bins a few (4–7) period doubled stars are present. But the overall number of stars rapidly decreases as pulsation period gets longer. Consequently, the incidence rate of the period dou- bling effect increases from 12 per cent (15−16d) to 70 per cent (19−20d). For periods above 20 d the period doubling effect is common and only in a few stars with periods longer than 20 d the effect is not present.
We also note that the amplitude of the PD increases with the increasing pulsation period. This is quantified with the average amplitude ratios, hA1/2/A0i, computed in the just discussed period bins, given in the last column of Tab.4.
The effect is clear, but not very pronounced.
3.4 Period doubling in RV Tau stars
Period doubling is a characteristic feature of RV Tau vari- ables. Stars classified as RV Tau, but without noticeable
Table 4.The occurrence of period doubled W Vir stars in the 1-d wide period bins defined in the first column. The second and third columns give a number of period doubled (NPD) and all (N) W Vir stars, respectively. The fourth column gives the inci- dence rate and the last column lists the average amplitude ratio, hA1/2/A0i.
P NPD N NPD/N hA1/2/A0i 15. . . 16 d 4 33 0.12±0.06 0.025±0.005 16. . . 17 d 5 23 0.22±0.09 0.06±0.03 17. . . 18 d 7 14 0.50±0.13 0.07±0.01 18. . . 19 d 4 9 0.44±0.17 0.08±0.01 19. . . 20 d 5 7 0.71±0.17 0.14±0.04
alternating deep and shallow minima are rare, seeSoszyński et al. (2008, 2017) for details about the OGLE classifica- tion. Period doubling in RV Tau stars manifests as pro- nounced alternations of the deep and shallow brightness minima/maxima. The excellent coverage of OGLE data al- lows us to study the effect in detail. There are only a few RV Tau stars in which the effect is very regular, i.e. light curve shape repeats after two pulsation cycles with a roughly constant minima and maxima (a very nice example is, e.g.
T2CEP-193). In such a case, in the frequency spectrum we observe coherent signals located at sub-harmonic frequen- cies.
In the majority of stars, the effect is irregular on a short time scale, as already noted, e.g. bySoszyński et al.(2008, 2017). There are stars in which the effect is transient: al- ternations are present in some observing seasons only. In other stars we observe varying depth of the minima/maxima,
MNRAS000,1–28(2018)
but the deep and shallow cycles do not switch. In the fre- quency spectra, we observe non-coherent signals centred at sub-harmonic frequencies then. In several stars we observe switching of the deep and shallow cycles. In the frequency spectra of such stars we observe signals centred at sub- harmonic frequencies with a local minimum in the middle.
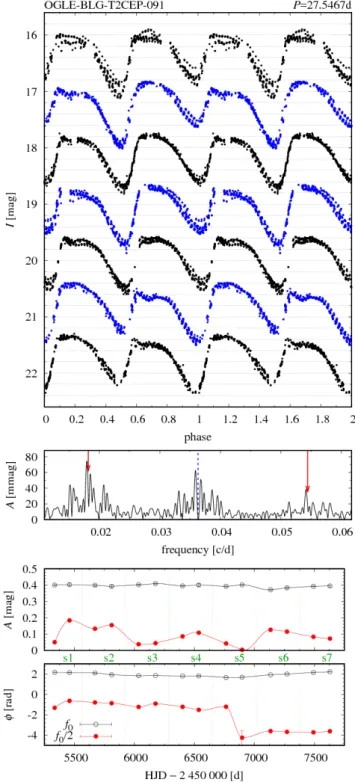
It was already illustrated in Sect.2, in the bottom panel of Fig.6for T2CEP-034. Here we show the effect in more de- tail with the help of T2CEP-091 (P0= 27.5467d). The top panel of Fig.14shows the data folded with2P0 separately for the seven observing seasons. The shallow minimum vis- ible in s1–s4 at phase 1, becomes the deep minimum for s6 and s7. Middle panel of Fig.14 shows the frequency spec- trum after prewhitening with the fundamental mode and its harmonics. Signals centred at f0/2and 3f0/2(weak), with minimum in the middle, are well visible. Further insight into the switching phenomenon is possible thanks to the time- dependent Fourier analysis illustrated in the bottom panel of Fig. 14. To increase the time resolution, each observing season was divided into two equal parts and amplitude and phase change of signals atf0 andf0/2was followed (open and filled symbols, respectively). The amplitude and phase of the fundamental mode slowly vary which gives rise to unresolved remnant power at f0 well visible in the middle panel of Fig.14. The changes are much more pronounced for the signal at f0/2. In s1 the amplitude significantly varies, which is also well visible in the top panel of Fig.14. Light curve for s1 is characterised with relatively large scatter. For s2–s4 the depths of the minima change, but otherwise light curve phases well with2P0. The switching occurs within s5, in which amplitude of the signal atf0/2drops to≈0. Indeed, no alternations are visible in the time series at the end of s5. The phase (bottom panel of Fig.14) changes byπ, and switch of the deep and shallow cycles occurs. In s6 and s7 the minimum at phase 1 is the deeper one.
Switching of the deep and shallow cycles clearly occurs in at least 23 stars of our sample. They cover a wide period range, from slightly above 20 d to more than 40 d. For these stars, the effect is illustrated in a series of figures analogous to that of Fig.14(folded light curves for s1–s7 and frequency spectra) attached to this paper as Supplementary Online Material (Appendix A).
For some long-period stars the PD effect becomes strongly irregular. However, there is no rule that the longer the pulsation period, the more irregular the PD is.
There are very nice examples of pretty regular long-period RV Tau stars (e.g. T2CEP-782, T2CEP-761, T2CEP-095 and T2CEP-542, all withP0>45d).
3.5 Period-4 RV Tau candidate
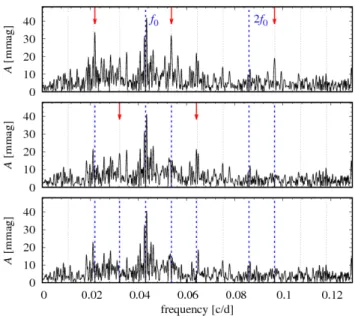
In the frequency spectrum of T2CEP-135, illustrated in the top panel of Fig.15, we detect a signature of period-4 pulsation. After prewhitening with the fundamental mode (P0 = 23.2681(4)d) and its harmonics, peaks centred at 5f0/4 (f /f0 = 1.2500) and 9f0/4 (f /f0 = 2.2471) are well visible and significant. In addition we see unresolved remnant power at f0 and a peak located close to f0/2 (f /f0= 0.5094). After prewhitening with the above signals, middle panel of Fig.15, a structure centred at3f0/2becomes visible. In addition a signal centred at3f0/4(f /f0= 0.7483) can be noticed, but it is very weak. The bottom panel of
Figure 14.Illustration of switching of the deep and shallow pul- sation cycles in T2CEP-091. The top panel shows light curves folded with2P0 separately for seven observing seasons: from s1 (top light curves) to s7 (bottom light curve) artificially shifted in vertical direction to allow comparison. The middle panel shows frequency spectrum after prewhitening with the fundamental mode and its harmonics (dashed line). Arrows indicate the ex- act location off0/2and3f0/2. The two bottom panels show the results of time-dependent Fourier analysis – amplitude and phase changes – for signals atf0 andf0/2(followed with a time resolu- tion of half of the observing season; open and filled symbols, re- spectively; formal errors are typically smaller than symbol’s size).
Data were fitted with spline function just to guide the eye.
Fig. 15 shows the frequency spectrum prewhitened with these two additional peaks. The most pronounced peaks that remain in the spectrum correspond to remnant unresolved power atf0,f0/2and3f0/2.
Period-4 pulsation is also visible in the time domain, but it is clearly an irregular effect, not present in all observ- ing seasons. It is best visible in s2–s5. In the consecutive panels of Fig. 16, we plot the data folded with4P0 for s1, jointly for s2–s5, s6 and s7. While data for s1, s6 and s7 phase well also with2P0, with relatively little scatter around light curve minima/maxima, it is not the case for s2–s5. Data in these seasons follow a very similar pattern and phase much better with4P0. These observations are nicely confirmed by the time-dependent analysis in which we followed the ampli- tudes and phases of signals atf0/2and5f0/4on a season- to-season basis – bottom panels of Fig. 16. We recall that these are the highest peaks corresponding to, respectively, the period doubling and the period-4 behaviour. Amplitude of the5f0/4signal is the highest during s2–s5 and is notice- ably lower during s1, s6 and s7. In s7 it is very small, while amplitude of the signal atf0/2is the highest. Indeed, nice PD effect is visible in s7. Interestingly, amplitudes of the signals atf0/2and at5f0/4are anticorrelated. Phase vari- ation for both signals is rather moderate. For the last two seasons, we observe strong increase of phase of the signal at 5f0/4. Since its amplitude nearly vanishes in s7, its phase is not well determined then. Clearly, it will be interesting to revisit T2CEP-135 in the future, to check whether period-4 behaviour will appear with larger amplitude again.
For seasons s2–s5, some scatter around light curve min- ima/maxima is still noticeable. Period-4 pulsation is only a meanstate around which some variation is present. It is best visible in the data alone, which have good enough quality to trace the individual pulsation cycles. They are displayed in Fig.17for seasons s4 and s5.
OGLE-III data for T2CEP-135 are also available, but the sampling is much more scarce. The star appears as or- dinary, period-doubled RV Tau star. No trace of period-4 pulsation is apparent in the time domain. In the frequency spectrum, after prewhitening with the fundamental mode and its harmonics, signals centred atf0/2and3f0/2domi- nate the spectrum. In addition, there is a signal near5f0/4 but it is weak and significantly offsets the exact5f0/4posi- tion (f /f0= 1.2385).
In a few other stars we have found rather weak hints for period-4 pulsation; definitely more data with better sam- pling are needed for verification of these cases. In T2CEP- 224 (P0 = 37.746d), for which OGLE-III data are only avail- able, RV Tau alternations are pronounced, but rather large scatter is visible in the light curve. In the frequency spec- trum, after prewhitening with f0, its harmonics, and sub- harmonics, two peaks symmetrically placed around 3f0/4 are detected, which suggests period-4 pulsation. Inspec- tion of seasonal light curves folded with 4P0 is inconclu- sive however, due to poor data sampling. T2CEP-853 (P0= 28.268d) is a similar case; here we detect a weak signal centered at 5f0/4, but again, data sampling is too poor to reveal possible period-4 pulsation in the seasonal light curves folded with4P0. Finally, in the frequency spectrum of T2CEP-810 (P0 = 28.6085d) we detect, besides f0, its harmonics and sub-harmonics (f0/2, 3f0/2, and 5f0/2), a significant power excess centred on 2f0/3. All data nicely
Figure 15.Frequency spectra during consecutive prewhitening steps for T2CEP-135, a period-4 candidate. Thin grey vertical lines form a grid with a separation off0/4. Prewhitened frequen- cies are marked with thick dashed blue lines, new identified fre- quencies are marked with red arrows. Fundamental mode and its harmonics are prewhitened in all panels.
fold with6P0. However we do not detect any other signals that would support period-6 pulsation. Excitation of addi- tional non-radial mode or contamination are likely explana- tions too.
3.6 Periodic modulation of pulsation: BL Her variables
Based on the analysis of frequency spectra (equidistant pat- terns) we identified 16 modulated BL Her stars. Basic data for these stars are collected in the top section of Tab. 5.
In the consecutive columns we provide star’s ID, pulsation period, modulation period, amplitude of the fundamental mode and amplitudes of the modulation peaks detected at fm,f0−fmandf0+fm. Information about additional mod- ulation side-peaks and remarks are given in the last column.
In several stars, ID’s of which are marked with superscript
‘A’, the amplitude of the modulation is large enough to vi- sualise the effect with an animation. These animations can be found as a Supplementary Online Material. For all stars discussed in this section, in Fig.18we show the light curves folded with the pulsation period. It is immediately visible, that the modulations are of low amplitude. In none of the light curves the effect is immediately visible, as it is the case, e.g. for RR Lyrae stars and the Blazhko effect. For all modulated stars the frequency spectra showing the most prominent modulation peaks are presented either below, or as Supplementary Online Material, Appendix B.
Modulated BL Her stars cover a relatively wide range of pulsation periods (≈1.4–3.9 d) and modulation periods (≈15.8–970 d). In the majority of stars, modulation mani- fests through equidistant triplets centred atf0 and by a sig- nal at the modulation frequency,fm. Strongly asymmetric modulation patterns (doublets) are less frequent. In many
MNRAS000,1–28(2018)