genomic 5-hydroxymethylcytosine levels in hematopoietic cells
Borbala Vet}o1,2, Pal Szabo3, Caroline Bacquet1, Anna Apro1, Edit Hathy4, Judit Kiss1, Janos M. Rethelyi 4,5, Flora Szeri 1,†, David Sz€uts1and Tamas Aranyi 1,6
1 Institute of Enzymology, RCNS, HAS, Budapest, Hungary
2 Doctoral School of Molecular Medicine, Semmelweis University, Budapest, Hungary 3 MS Metabolomics Laboratory, Core Facility, RCNS HAS, Budapest, Hungary
4 MTA-SE NAP-B Molecular Psychiatry andin vitroDisease Modeling Research Group, Budapest, Hungary 5 Department of Psychiatry and Psychotherapy, Semmelweis University, Budapest, Hungary
6 CNRS UMR 6214, INSERM U1083, University of Angers, Angers, France
Keywords
5-aza-20-deoxycytidine;
5-hydroxymethylcytosine; 5-methylcytosine;
ascorbate; LC-MS/MS Correspondence
T. Aranyi, Institute of Enzymology, RCNS, HAS, Magyar tudosok krt. 2., Budapest 1117, Hungary
Tel: +36 1 3826 790
E-mail: aranyi.tamas@ttk.mta.hu
†Present address
Sidney Kimmel Medical College, Thomas Jefferson University, Philadelphia, PA, USA (Received 2 November 2017, revised 17 January 2018, accepted 17 January 2018) doi:10.1002/2211-5463.12392
5-Hydroxymethylcytosine (5hmC) is produced from 5-methylcytosine (5mC) by Ten-eleven translocation (TET) dioxygenases. The epigenetic modification 5hmC has crucial roles in both cellular development and dif- ferentiation. The 5hmC level is particularly high in the brain. While 5mC is generally associated with gene silencing/reduced expression, 5hmC is a more permissive epigenetic mark. To understand its physiological function, an easy and accurate quantification method is required. Here, we have developed a novel LC-MS/MS-based approach to quantify both genomic 5mC and 5hmC contents. The method is based on the liberation of nucle- obases by formic acid. Applying this method, we characterized the levels of DNA methylation and hydroxymethylation in mouse brain and liver, pri- mary hepatocytes, and various cell lines. Using this approach, we confirm that the treatment of different cell lines with the DNA methyltransferase inhibitor 5-aza-20-deoxycytidine leads to a decrease in 5mC content. This decrease was accompanied by an increase in 5hmC levels in cell lines of hematopoietic origin. Finally, we showed that ascorbate elevates the levels of 5hmC and augments the effect of 5-aza-20-deoxycytidine without signifi- cantly influencing 5mC levels.
In mammals, CpG dinucleotides are prone to become methylated. CpG methylation plays important roles in transcriptional gene silencing, genomic imprinting, and X chromosome inactivation [1]. Methylation patterns are established by the de novo methyltransferases DNMT3A and DNMT3B. Existing methylation pat- terns are preserved during cell divisions by the mainte- nance DNA methyltransferase DNMT1. This enzyme
preferentially binds hemimethylated DNA (methylated only on one strand) and consequently replicates the parental DNA methylation to the newly synthesized DNA strand. DNA demethylation can be executed by demethylase enzymes [2]. DNA methylation is consid- ered to be a reversible modification as methylation patterns can be established de novo, maintained through generations, or undergo dynamic changes
Abbreviations
5azadC, 5-aza-20-deoxycytidine; 5caC, 5-carboxylcytosine; 5fC, 5-formylcytosine; 5hmC, 5-hydroxymethylcytosine; 5mC, 5-methylcytosine;
DNMT, DNA methyltransferase; IDH, isocitrate dehydrogenase; LC-MS/MS, liquid chromatography coupled with mass spectrometry; TET, Ten-eleven translocation.
genomewide or at specific loci, reflecting environmental conditions [3–6].
Recently, the presence of another modified base, 5-hydroxymethylcytosine (5hmC), was discovered in the central nervous system [7] and in other mam- malian tissues [8]. 5hmC is a key metabolite in the demethylation process. 5mC levels are fairly constant in different tissues due to CpG methylation (4–5%
of all cytosines). In contrast, 5hmC levels are vari- able with the highest level detected in brain (approxi- mately 1% or more) and 10–100 times lower in other cell types [7,8] or even lower in iPSCs (0.12%) [4] or cell lines [9].
The DNA demethylase Ten-eleven translocation (TET) enzymes are Fe2+- and a-ketoglutarate-depen- dent oxidases, which efficiently convert 5mC into 5hmC bothin vitro and in vivo [2]. Furthermore, TET can further oxidize 5hmC to 5-formylcytosine (5fC) and 5-carboxylcytosine (5caC) [10]. Accordingly, the availability of a-ketoglutarate, a key molecule of the citric acid cycle, can have significant consequences on the epigenetic control of genome activity and thereby has substantial impact on health and disease. Indeed, recent studies have shown that the catalytic activity of TET proteins is impaired due to mutations in the isocitrate dehydrogenase (IDH) genes leading to the formation of 2-hydroxyglutarate instead of a-ketoglu- tarate in various tumors (reviewed in [11]). Ascorbate was also reported to play a role in oxidative demethy- lation of DNA. It is a substantial factor necessary for the full catalytic activity of TET dioxygenases (DNA demethylase) [12,13] and also of Jmjc histone demethy- lases [14]; thus, it appears to be a mediator at the interface between the genome and environment [15,16]
The role of ascorbate is the reduction of Fe3+ to Fe2+, which is necessary for the catalytic activity of these enzymes.
Several methods have been developed to detect covalent DNA modifications (reviewed in [17]). Bisul- fite conversion was set up for mapping 5mC nucleo- tides, and it is accepted as the gold standard [18].
However, using this chemical conversion it is impossi- ble to distinguish 5mC from 5hmC [19]. Affinity enrichment methods are based on the immunoprecipi- tation of fragmented genomic DNA with 5mC and 5hmC antibodies (MeDIP and hMeDIP) followed by PCR or sequencing, and they are widely used for this purpose. Another method to distinguish the two main covalent DNA modifications is the specific glucosyla- tion of 5hmC combined with MspI digestion, where the glucosylated DNA sites are resistant to cleavage, thus allowing single-nucleotide 5hmC mapping [20].
However, these methods are not sufficiently exact for quantitative analysis [21].
An alternative approach for exact quantification of DNA methylation is the highly reliable and simple global genomic quantification by liquid chromatogra- phy coupled with mass spectrometry (LC-MS/MS).
This is considered as the most accurate for simultane- ously measuring global 5mC and 5hmC levels in genomic DNA [4,8] after digesting the genomic DNA into nucleotides by a multienzyme cocktail. We have recently developed an alternative approach based on the liberation of nucleobases by formic acid to quan- tify genomic 5mC content. Using this method, we have previously reported the highly dynamic nature of DNA methylation [22]. Our aim here was to improve this technique by developing genomic 5hmC detection. Furthermore, we intended to investigate the role of 5-aza-20-deoxycytidine on 5hmC levels in a panel of human cell lines. The FDA-approved epige- netic drug, 5-aza-20-deoxycytidine (5azadC or decita- bine), is a potent methyltransferase inhibitor [23] that reduces the level of 5mC in genomic DNA. Here, we show that 5-aza-20-deoxycytidine treatment increases 5hmC levels in hematopoietic cells. Moreover, cotreatment with decitabine and ascorbate allows a decitabine-dependent increase in 5hmC levels in HeLa cells.
Materials and methods
Cell culture
A375 melanoma, A2058 melanoma, HepG2 hepatocarci- noma, HeLa cervix carcinoma, MES-SA uterine sarcoma, H1650 bronchoalveolar carcinoma, HTR8 placenta, BeWo choriocarcinoma, HL60 promyeloblast, and K562 lymphoblast cell lines were obtained from ATCC. They were cultured either in Dulbecco’s modified Eagle’s med- ium (A375, A2058, HeLa, MES-SA, and H1650 cells), advanced MEM (HepG2 cells), or RPMI-1640 (HL60, K562, and HTR8 cells) supplemented with 10% fetal bovine serum (FBS), 1% glutamine, 1% penicillin/strepto- mycin, or F-12 medium supplemented with 20% FBS (BeWo cells). DT40 cells were cultured in RPMI-1640 medium (Gibco) supplemented with 7% FBS, 3%
chicken serum, 50lM b-mercaptoethanol, and penicillin/
streptomycin. No ascorbate was added to the culture media. Human iPSCs were differentiated into NPCs as described in Ref. [24]. Briefly, iPSC-derived free-floating embryoid bodies were treated with human recombinant Noggin and DKK1, SB431542, and cyclopamine for 21 days. After rosette formation, NPCs were dissociated and propagated using FGF2. This protocol gives rise to
dorsal telencephalic neural progenitors that can be fur- ther differentiated into PROX1 expressing dentate gyrus granule cells.
Drug treatments
Cells were treated with vehicle (DMSO) or 1lgmL1 5-aza-20-deoxycytidine for 48 h. When indicated, cells were treated with 100lgmL1 ascorbate (approx. 500lM) for 48 h. Medium was changed after 24 h, and fresh medium was also supplemented with the drugs used for the treatments. DNA was extracted according to the Puregene (158745; Qiagen, Hilden, Germany) protocol.
Animals and animal studies
C57BL/6J mice were derived from mice purchased from The Jackson Laboratories. Mice were kept under routine laboratory conditions in an approved animal facility. The RCNS, Hungarian Academy of Sciences Institutional Ani- mal Care and Use Committees approved the animal stud- ies. Mouse liver and forebrain were taken out freshly from the animals and frozen. Genomic DNA was prepared with DNeasy Blood & Tissue Kit (Qiagen).
Primary mouse hepatocyte culture
A total of 12- to 16-week-old male C57BL/6 mice were used. Primary mouse hepatocyte culture was prepared as previously, except for the addition of the upper layer of matrigel [25]. Briefly, mice were anaesthetized (20 mgkg1 tiletamine, 20 mgkg1 zolazepam, 12.5 mgkg1 xylazine, and 3 mgkg1butorphanol), and livers were perfused with 75 mL oxygenized perfusion buffer (120 mmolL1 NaCl, 5.4 mmolL1KCl, 0.9 mmolL1 NaH2PO4, 26 mmolL1 NaHCO3, 5.6 mmolL1 glucose, pH 7.4) supplemented with EGTA (0.5 mmolL1), followed by a second perfu- sion with 75 mL perfusion buffer without EGTA. Collage- nase digestion was performed by 75 mL perfusion buffer supplemented with 2.5 mmolL1 CaCl2and 0.2 mgmL1 collagenase (C5138, Sigma). The digested liver was taken out of the abdominal cavity and minced using tweezers, thereby releasing the hepatocytes. Cells were washed in ice- cold sterile suspension buffer (10 mmolL1 HEPES, 142 mmolL1 NaCl, 7 mmolL1 KCl, pH 7.4), filtered through a 100-lm mesh membrane and centrifuged for 4 min at 4°C at 80g. After one additional washing step, dead cells were removed by Percoll (Sigma) centrifugation.
After checking their viability by trypan blue exclusion staining, cells were seeded on 6-well plates precoated with 5lgcm2 collagen I (BD, 356234) at a density of 0.5x10⁶cells/well in Williams E medium (Gibco) supple- mented with hepatocyte thawing/plating supplement (Gibco) and 10% FBS. Cells that did not attach were
removed by refreshing the culture medium after 1 h. 24 h postseeding, the medium was renewed.
MS measurement
DNA was hydrolyzed to nucleobases by chemical means using formic acid as described previously [26]. Briefly, 100lL formic acid (100%) was added to 5–20lL of samples and pipetted into a 2-mL glass vial. The tightly crimped vial was kept at 130°C for 90 min. After nitrogen evaporation, the samples were reconstituted in 80 lL of acetonitrile:wa- ter:formic acid 49.5 : 49.5 : 1 solution and pipetted into a 200-lL microvial. Chemical standards such as dCTP, 5mdCTP, and 5hmdCTP were used to optimize the mass spectrometer to get the highest sensitivity. A Sciex 6500 QTrap mass spectrometer equipped with turboV ion source was used. Perkin Elmer Series200 system (consisting of bin- ary pump, autosampler, and column oven) was used for sep- aration. Water containing formic acid in 0.1% (eluent A) and acetonitrile containing formic acid in 0.1% (eluent B) was used for separation using gradient elution: A/B 30/70(1)- 4.5–90/10(1.5)-1.5-30/70(4.5). An Agilent RX-Sil column (25094.6 mm, 5um) was used for the separation. The flow rate was 1 mLmin1. 40lL of the samples was injected. The column temperature was ambient, and samples were kept at 5°C in the autosampler. Source conditions in mass spectro- metric measurements were as follows: spray voltage 5000 V, evaporation temperature: 500°C, curtain, evaporation, and drying gases 45, 45, and 50 instrument units, respectively.
50 ms dwell time and 5 ms pause times were used for each MRM transitions. Collision energy was set to 30 eV.
Calibration
Calibration was performed on nucleotides. The same sam- ple preparation protocol was applied as for the genomic DNA. A ten-point calibration curve in the range of 1–10%
of mC and a nine-point calibration curve in the range of 0.01–1% of hmC relative to C were made by mixing the individual nucleotide base solutions. Due to the high dynamic range of the mass spectrometer, the relative con- centration values were independent of the absolute amount of nucleotides mixed. While the area ratios of 5mC/C and 5hmC/C were measured, the lowest calibration points were not equal to the lowest limit of quantitation (LOQ). The LOQ and limit of detection (LOD) values depend on the absolute amount of 5hmC. This allowed us to use extrapo- lated ratios based on relatively strong peaks for integration even if the area ratios were out of the range.
Results and Discussion
We have developed a new HPLC-MS method to detect 5mC and 5hmC levels in the genome with liquid
chromatography–mass spectrometry (LC-MS/MS).
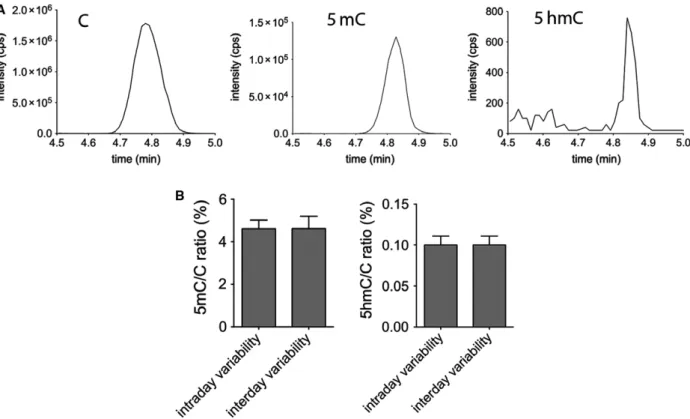
The method uses formic acid to hydrolyze DNA to nucleobases instead of enzymatic digestion often described in the literature [4,8]. Although the retention times of the nucleobases are close to each other, the selectivity of MRM scan mode enables the LC-MS/
MS to detect them selectively according to their differ- ent weights of molecular and fragment ions (Fig.1A).
We have not investigated in the present study, but with further improvements, formylcytosine and car- boxylcytosine levels could be also detected in the gen- ome by the same approach. The technique is sufficiently sensitive to detect the low levels of 5hmC found in the genome. Next, we examined the variabil- ity of the MS measurement. To investigate this, geno- mic DNA extracted from a C57BL/6 mouse liver was divided into 21 identical samples. The samples were measured by MS at three distinct time points to deter- mine intraday and interday variabilities. Each day seven parallels were measured. Fig.1B shows the intra- and interday variabilities of the MS measure- ment detecting genomic 5mC/C and 5hmC/C ratios in mouse liver. The coefficients of variation (SD/mean) for intraday variability were 0.08 and 0.10, respec- tively. Very similar interday coefficients of variation were observed: 0.12 and 0.18, respectively. Although small and similar intra- and interday variabilities were determined for both 5hmC/C and 5mC/C measure- ments, all the parallels of an individual experiment on one cell type presented in this study were always pro- cessed together from the beginning (treatment of the cells) to the analysis of DNA methylation and hydrox- ymethylation levels following MS detection.
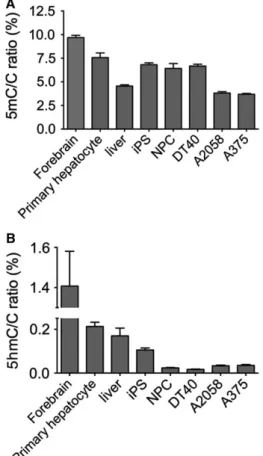
Next, we investigated the genomic 5mC and 5hmC levels in different types of cells and tissues. Fig.2A shows the detected genomic 5mC/C ratios. It has been shown previously that the tissue-specific distribution of 5mC is relatively stable among different tissues, but it is highly variable for 5hmC [8]. However, we have observed very high 5mC/C ratios in mouse forebrain (9,6%). This high level of DNA methylation probably corresponds to the reported high level of non-CpG methylation in brain [27,28]. We also observed a slightly higher level of DNA methylation in murine primary hepatocytes relative to the methylation level detected in mouse liver samples, which was similar to the previously reported values [29]. The difference might be explained by the loss of nonhepatocyte cells with lower methylation and/or by the hypermethyla- tion of the primary hepatocytes in the culture condi- tions. This potential de novo methylation might also include non-CpG methylation, as de novomethyltrans- ferases efficiently methylate CpA dinucleotides, as well
[30,31]. In addition, we observed relatively high (approximately 6,5%) genomic 5mC/C ratios in human-induced pluripotent stem cells (iPSCs) and their derivatives, neuronal progenitor cells (NPCs).
This high level of DNA methylation is typical for iPSCs [32]. A similar level of methylation was detected in chicken DT40 B-cell lymphoma, while the immortal- ized cancer cell lines (A375 human melanoma, A2058 human melanoma) contained less than 4% 5mC. The highest genomic DNA methylation level was approxi- mately three times higher than the lowest.
A much higher degree of variation of 5hmC levels was detected in our array of cell lines and tissue sam- ples (Fig.2B). Almost a hundred-fold more 5hmC was measured in the samples with the highest 5hmC level compared to those with the lowest. In the mouse fore- brain, we detected high 5hmC level with a 5hmC/C ratio of 1.4%, which is similar to previous studies on brain-derived cells [7]. In accordance with previous reports, low level of 5hmC was detected in the genome of adult mouse liver [8,9,33]. Here, we also show simi- lar level of approx. 0.2% 5hmC/C for mouse primary hepatocytes. The iPSCs had a clearly lower 5hmC level than brain and liver cells. Furthermore, a striking dif- ference of 5hmC levels was observed between immor- talized cell lines and the samples mentioned above.
DT40, A2058, and A375 cells have low genomic 5hmC/C ratios (below 0.06%), confirming that cell cul- ture conditions result in a dramatic reduction in global 5hmC levels [9]. As reported previously, differentiating NPCs were also characterized by low 5hmC levels [34], which was similar to that observed in the case of immortalized cells. Altogether, these experiments demonstrate the applicability of our newly developed sensitive and simple method to quantify global 5hmC levels.
5azadC is a molecule frequently used to inhibit genomic DNA methylation for research purposes and to treat myelodysplastic syndrome and AML in clinics.
A paradoxical increase in the 5hmC level in HL60 human promyeloblast cells upon decitabine treatment has been recently reported [35]. The authors explained their observation by the preferential demethylation of hemimethylated relative to methylated DNA strands by the TET enzymes. These strands appear during replication and remain hemimethylated as a result of the inability of the cells to remethylate them due to decitabine treatment. However, the authors did not test any cell types other than HL60. Therefore, to assess whether the described phenomenon is ubiqui- tous, the effect of the hypomethylating agent on 5hmC level was investigated in a broader range of cell lines in our next set of experiments by taking advantage of
the newly developed sensitive technique (Fig.3). Cells were selected to represent various tissues of origin (hematopoietic, liver carcinoma, uterine carcinoma, melanoma lung carcinoma, and choriocarcinoma). As seen previously, they exhibited variable but mostly low (below 5%) methylation and very low (below 0.05%) 5hmC levels. We have chosen a 48-h treatment to increase the number of cells undergoing division and the amount of hemimethylated DNA strands in the population investigated. As expected, treatment with the DNA methyltransferase inhibitor 5azadC resulted in systematic and significant decrease in 5mC levels.
Upon the 48-h treatment, 5mC/C ratios diminished to approximately 50% compared to vehicle-treated cells (Fig.3A). When we looked at the effect of 5azadC first, we could confirm that the treatment results in a paradoxical increase in 5hmC level in HL60 cells ele- vating the initial level of 0.05% to 0.12% (Fig.3B).
However, it is necessary to emphasize that the 5mC decrease is much greater than 5hmC increase, as the most important part of 5mC loss is due to the absence of remethylation on the newly synthetized strands and only a small part could be attributed to the TeT activ- ity at hemimethylated loci. Furthermore, 5hmC is less stable and can eventually become further oxidized to
other cytosine derivatives, such as carboxylcytosine, formylcytosine, or cytosine [8].
Interestingly, we found that the paradoxical effect of 5azadC on 5hmC levels was only detectable in hematopoietic cells. For instance, in HepG2 cells we could not detect any quantitative 5hmC change. Sur- prisingly, in other cells of hepatic origin (Huh7) 5azadC treatment was shown to lead to reorganize nuclear 5hmC by immunostaining [36]. In the case of BeWo choriocarcinoma, 5azadC treatment resulted in significant loss of genomic 5hmC level. However, we found that the initial observation reported in the liter- ature showing that decitabine treatment leads to increased 5hmC/C ratios was characteristic of hematopoietic cells we investigated. In addition to HL60 human promyeloblast cells, K562 human myel- ogenous leukemia and DT40 chicken lymphoblastoma cells also showed significantly increased 5hmC levels upon 5azadC treatment (P <0.05,t-test) (Fig.3). This might suggest that a particular mechanism specific to the hematopoietic cells is responsible for the observed phenomenon. One can hypothesize that expression levels of TeT genes are different in these cells than in the others. It is a conceivable hypothesis that the expression levels of TeT genes are higher in
Fig. 1.Detection of cytosine derivatives (C, 5mC, and 5hmC) by LC-MS/MS. Peak intensities from genomic DNA (A) Note the difference of scale. Intra- and interday variability (B). Genomic 5mC/C and 5hmC/C ratios (%) in mouse liver are detected by MS. Error bars indicate SD n=8.
hematopoietic cellsper se. Alternatively, originally low TeT expression levels could be highly increased upon treatment. However, based on publicly available data (proteinatlas.org [37]) none of these seems to be the case. Although K562 cells seem to have high TeT1 expression, they have moderate TeT2 and TeT3 expression levels. HL60 cells have higher TeT2 and TeT3 expression level accompanied with lower TeT1 level. These expression levels were not dramatically dif- ferent from those of other cells tested in our panel. In particular, BeWo cells had similar expression to K562 with a markedly different effect of 5azadC on their 5hmC levels. Similarly, other related gene expression levels (IDH1 and IDH2 responsible for the synthesis ofa-ketoglutarate or DNMTs) do not allow establish- ing an obvious correlation between the effect of 5azadC on 5hmC levels in hematopoietic cells and the absence of the effect in cells of different origin.
We therefore hypothesized that the lack of clear effect of 5azadC on 5hmC level is due to the different
oxidative balance in the cells. This might lead to very low activity of TeT enzymes in some cells due to their inability of efficiently reducing Fe3+ back to Fe2+ at the end of the catalyzed reaction. As stated above, ascorbate was reported to regulate DNA methylation as a substantial cofactor for the full catalytic activity of TET dioxygenases by reducing back Fe3+ to Fe2+
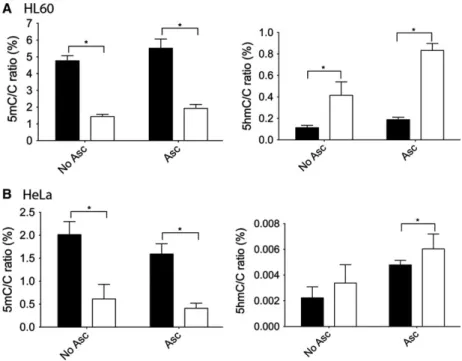
[12,13]. Therefore, the effect of ascorbate was investi- gated. Plasma ascorbate concentration was reported to be between 50 and 100 or as high as 200lmolL1 [38–40]. As ascorbate has a short half-life, we used a 100lgmL1 (approx. 500lM) concentration in our experiments. Here, we show that ascorbate treatment of human HL60 and HeLa cells did not induce global DNA methylation changes. Furthermore, cotreatment of the same cells with ascorbate and decitabine did not cause a greater 5mC decrease than decitabine alone.
However, the global 5hmC levels became significantly elevated in our experiments on the tested human hematopoietic cells upon ascorbate treatment (Fig. 4A and B). This increase was much more robust than that observed upon 5azadC treatment alone, indicating that the two molecules have synergistic effect, and suggests that even in HL60 cells ascorbate is not present at suf- ficient level for the full activity of the TeT enzymes.
Furthermore, we could demonstrate the increase in 5hmC levels upon 5azadC treatment in HeLa cells
Fig. 2.Genomic 5mC/C (A) and 5hmC/C (B) ratios (%) in cell lines, primary cells, and tissues. No ascorbate was added to the culture media. Error bars indicate SD n=4–6. [Corrections added after online publication on 28 February 2018: y-axis of part (B) amended to 5hmC]
Fig. 3.Genomic 5mC/C (A) and 5hmC/C levels (B) detected by LC-MS upon 5-aza-20-deoxycytidine treatment. Black and white columns indicate vehicle and 5-aza-20-deoxycytidine treatment, respectively. No ascorbate was added to the culture media. Error bars indicate SDP<0.05.n=3–5. [Corrections added after online publication on 28 February 2018: y-axis of part (B) amended to 5hmC]
only in the presence of ascorbate. Altogether, these data suggest that some cell lines do not have function- ally fully active TeT enzymes and are therefore unable to respond to decitabine treatment by 5hmC increase probably due to a scarcity of ascorbate.
Our data reported here demonstrate that decitabine treatment reduces global 5mC and increases 5hmC levels in different cells, particularly those originating from hematopoietic malignancies. There is increasing evidence that DNA hydroxymethylation and TET2 function is highly dysregulated in hematologic malig- nancies (T-ALL, AML, CML), suggesting that TET proteins can act as tumor suppressors (reviewed in [41]). Indeed, the expression level of TeT2 positively correlated with tumor-free survival according to a recent study in CLL patients [42]. Our data suggest that decitabine treatment in patients with hematopoi- etic tumors might simultaneously lead to DNA demethylation and increased 5hmC levels, the latter playing a putative positive role in the therapeutic effect of the drug. Recent data suggest that decitabine could also be used efficiently in solid tumors alone or in a combination therapy (for a recent review [43]).
In these cases, gene-specific DNA methylation changes were considered due to the treatment, but global effects and potential normalization of 5hmC level might also play a role in the molecular action
of the drug. Our results also raise the possibility that cotreatment with dietary ascorbate and decitabine might lead to an increased effect and thereby an increased overall survival in hematopoietic, or poten- tially in other malignancies.
Acknowledgements
DS is supported by Momentum Grant LP2011-015 of the Hungarian Academy of Sciences and by project no. FIEK_16-1-2016-0005 of the National Research, Development and Innovation Fund of Hungary. TA was supported by a grant from Angers University (IPMEE). JMR and TA were supported by a grant from the MedinProt Program of the Hungarian Acad- emy of Sciences. EH and JMR are supported by the National Brain Research Program of Hungary (Grant NAP-B KTIA_NAP_13-2014-0011). FSZ is supported by the Fulbright Research Scholar Grant by J. Wil- liam Fulbright Foreign Scholarship Board.
Author contributions
TA and DS conceived and designed the project; BV, PS, CB, AA, EH, JK, JMR, and FS acquired the data.
TA, DS, PS, and BV analyzed and interpreted the data; TA and BV wrote the manuscript.
Fig. 4.Genomic 5mC/C and 5hmC/C ratios (%) in HL60 (A) and HeLa cells (B). Treatment was performed for 48 h with vehicle or ascorbate (Asc) or ascorbate and 5-aza-20-deoxycytidine (Aza). Black and white columns indicate vehicle and 5-aza-20-deoxycytidine treatment, respectively. Error bars indicate SDP<0.05.n=4–5.
References
1 Bird A (2002) DNA methylation patterns and epigenetic memory.Genes Dev16, 6–21.
2 Ito S, D’Alessio AC, Taranova OV, Hong K, Sowers LC and Zhang Y (2010) Role of Tet proteins in 5mC to 5hmC conversion, ES-cell self-renewal and inner cell mass specification.Nature466, 1129–1133.
3 Pastor WA, Aravind L and Rao A (2013) TETonic shift: biological roles of TET proteins in DNA
demethylation and transcription.Nat Rev Mol Cell Biol 14, 341–356.
4 Le T, Kim KP, Fan G and Faull KF (2011) A sensitive mass spectrometry method for simultaneous
quantification of DNA methylation and
hydroxymethylation levels in biological samples.Anal Biochem412, 203–209.
5 Aranyi T, Stockholm D, Yao R, Poinsignon C, Wiart T, Corre G, Touleimat N, Tost J, Galy A and Paldi A (2016) Systemic epigenetic response to recombinant lentiviral vectors independent of proviral integration.
Epigenetics Chromatin9, 29.
6 Metivier R, Gallais R, Tiffoche C, Le Peron C, Jurkowska RZ, Carmouche RP, Ibberson D, Barath P, Demay F, Reid Get al.(2008) Cyclical DNA methylation of a transcriptionally active promoter.Nature452, 45–50.
7 Kriaucionis S and Heintz N (2009) The nuclear DNA base 5-hydroxymethylcytosine is present in Purkinje neurons and the brain.Science324, 929–930.
8 Globisch D, Munzel M, Muller M, Michalakis S, Wagner M, Koch S, Bruckl T, Biel M and Carell T (2010) Tissue distribution of 5-hydroxymethylcytosine and search for active demethylation intermediates.
PLoS One5, e15367.
9 Nestor CE, Ottaviano R, Reddington J, Sproul D, Reinhardt D, Dunican D, Katz E, Dixon JM, Harrison DJ and Meehan RR (2012) Tissue type is a major modifier of the 5-hydroxymethylcytosine content of human genes.Genome Res22, 467–477.
10 Ito S, Shen L, Dai Q, Wu SC, Collins LB, Swenberg JA, He C and Zhang Y (2011) Tet proteins can convert 5-methylcytosine to 5-formylcytosine and
5-carboxylcytosine.Science333, 1300–1303.
11 Pagliaroli L, Veto B, Aranyi T and Barta C (2016) From genetics to epigenetics: new perspectives in tourette syndrome research.Front Neurosci10, 277.
12 Blaschke K, Ebata KT, Karimi MM, Zepeda-Martinez JA, Goyal P, Mahapatra S, Tam A, Laird DJ, Hirst M, Rao Aet al.(2013) Vitamin C induces Tet-dependent DNA demethylation and a blastocyst-like state in ES cells.Nature500, 222–226.
13 Minor EA, Court BL, Young JI and Wang G (2013) Ascorbate induces ten-eleven translocation (Tet) methylcytosine dioxygenase-mediated generation of 5- hydroxymethylcytosine.J Biol Chem288, 13669–13674.
14 Klose RJ and Zhang Y (2007) Regulation of histone methylation by demethylimination and demethylation.
Nat Rev Mol Cell Biol8, 307–318.
15 Kriukiene E, Liutkeviciute Z and Klimasauskas S (2012) 5-Hydroxymethylcytosine–the elusive epigenetic mark in mammalian DNA.Chem Soc Rev41, 6916–6930.
16 Hore TA, von Meyenn F, Ravichandran M, Bachman M, Ficz G, Oxley D, Santos F, Balasubramanian S, Jurkowski TP and Reik W (2016) Retinol and ascorbate drive erasure of epigenetic memory and enhance reprogramming to naive pluripotency by complementary mechanisms.Proc Natl Acad Sci USA 113, 12202–12207.
17 Laird PW (2010) Principles and challenges of
genomewide DNA methylation analysis.Nat Rev Genet 11, 191–203.
18 Clark SJ, Harrison J, Paul CL and Frommer M (1994) High sensitivity mapping of methylated cytosines.
Nucleic Acids Res22, 2990–2997.
19 Jin SG, Kadam S and Pfeifer GP (2010) Examination of the specificity of DNA methylation profiling techniques towards 5-methylcytosine and
5-hydroxymethylcytosine.Nucleic Acids Res38, e125.
20 Robertson AB, Dahl JA, Vagbø CB, Tripathi P, Krokan HE and Klungland A (2011) A novel method for the efficient and selective identification of
5-hydroxymethylcytosine in genomic DNA.Nucleic Acids Res39, e55.
21 Matarese F, Santa Carrillo-de Pau E and Stunnenberg HG (2011) 5-Hydroxymethylcytosine: a new kid on the epigenetic block?Mol Syst Biol7, 562.
22 Yamagata Y, Szabo P, Szuts D, Bacquet C, Aranyi T and Paldi A (2012) Rapid turnover of DNA
methylation in human cells.Epigenetics7, 141–145.
23 Christman JK (2002) 5-Azacytidine and 5-aza-20- deoxycytidine as inhibitors of DNA methylation:
mechanistic studies and their implications for cancer therapy.Oncogene21, 5483–5495.
24 Yu DX, Di Giorgio FP, Yao J, Marchetto MC, Brennand K, Wright R, Mei A, McHenry L, Lisuk D, Grasmick JMet al.(2014) Modeling hippocampal neurogenesis using human pluripotent stem cells.Stem Cell Reports2, 295–310.
25 Jansen RS, Duijst S, Mahakena S, Sommer D, Szeri F, Varadi A, Plomp A, Bergen AA, Oude Elferink RP, Borst Pet al.(2014) ABCC6-mediated ATP secretion by the liver is the main source of the mineralization inhibitor inorganic pyrophosphate in the systemic circulation-brief report.Arterioscler Thromb Vasc Biol 34, 1985–1989.
26 Kok RM, Smith DE, Barto R, Spijkerman AM, Teerlink T, Gellekink HJ, Jakobs C and Smulders YM (2007) Global DNA methylation measured by liquid chromatography-tandem mass spectrometry: analytical
technique, reference values and determinants in healthy subjects.Clin Chem Lab Med45, 903–911.
27 Guo JU, Su Y, Shin JH, Shin J, Li H, Xie B, Zhong C, Hu S, Le T, Fan G et al. (2014) Distribution, recognition and regulation of non-CpG methylation in the adult mammalian brain. Nat Neurosci 17, 215–222.
28 Kinde B, Gabel HW, Gilbert CS, Griffith EC and Greenberg ME (2015) Reading the unique DNA methylation landscape of the brain: Non-CpG methylation, hydroxymethylation, and MeCP2.Proc Natl Acad Sci USA112, 6800–6806.
29 Ivanov M, Kals M, Kacevska M, Barragan I, Kasuga K, Rane A, Metspalu A, Milani L and Ingelman- Sundberg M (2013) Ontogeny, distribution and potential roles of 5-hydroxymethylcytosine in human liver function.Genome Biol14, R83.
30 Aranyi T, Kerjean A, Toth S, Mallet J, Meloni R and Paldi A (2002) Paradoxical Methylation of the tyrosine hydroxylase gene in mouse preimplantation embryos.
Genomics80, 558–563.
31 Ramsahoye BH, Biniszkiewicz D, Lyko F, Clark V, Bird AP and Jaenisch R (2000) Non-CpG methylation is prevalent in embryonic stem cells and may be mediated by DNA methyltransferase 3a.Proc Natl Acad Sci97, 5237–5242.
32 Nishino K, Toyoda M, Yamazaki-Inoue M,
Fukawatase Y, Chikazawa E, Sakaguchi H, Akutsu H and Umezawa A (2011) DNA Methylation dynamics in human induced pluripotent stem cells over time.PLoS Genet7, e1002085.
33 Lin IH, Chen Y-F and Hsu M-T (2017) Correlated 5-Hydroxymethylcytosine (5hmC) and gene expression profiles underpin gene and organ-specific epigenetic regulation in adult mouse brain and liver.PLoS One 12, e0170779.
34 Wheldon LM, Abakir A, Ferjentsik Z, Dudnakova T, Strohbuecker S, Christie D, Dai N, Guan S, Foster JM, Correa IR Jret al.(2014) Transient accumulation of 5-carboxylcytosine indicates involvement of active demethylation in lineage specification of neural stem cells.Cell Rep7, 1353–1361.
35 Chowdhury B, McGovern A, Cui Y, Choudhury SR, Cho IH, Cooper B, Chevassut T, Lossie AC and Irudayaraj J (2015) The hypomethylating agent Decitabine causes a paradoxical increase in
5-hydroxymethylcytosine in human leukemia cells.Sci Rep5, 9281.
36 Sajadian SO, Tripura C, Samani FS, Ruoss M, Dooley S, Baharvand H and Nussler AK (2016) Vitamin C enhances epigenetic modifications induced by
5-azacytidine and cell cycle arrest in the hepatocellular carcinoma cell lines HLE and Huh7.Clin Epigenetics8, 46.
37 Uhlen M, Fagerberg L, Hallstrom BM, Lindskog C, Oksvold P, Mardinoglu A, Sivertsson A, Kampf C, Sjostedt E, Asplund Aet al.(2015) Proteomics. Tissue- based map of the human proteome.Science347, 1260419.
38 Levine M, Conry-Cantilena C, Wang Y, Welch RW, Washko PW, Dhariwal KR, Park JB, Lazarev A, Graumlich JF, King Jet al.(1996) Vitamin C pharmacokinetics in healthy volunteers: evidence for a recommended dietary allowance.Proc Natl Acad Sci USA93, 3704–3709.
39 Naidu KA (2003) Vitamin C in human health and disease is still a mystery? An overview.Nutr J2, 7.
40 Banhegyi G, Benedetti A, Margittai E, Marcolongo P, Fulceri R, Nemeth CE and Szarka A (2014) Subcellular compartmentation of ascorbate and its variation in disease states.Biochim Biophys Acta1843, 1909–1916.
41 Han JA, An J and Ko M (2015) Functions of TET Proteins in Hematopoietic Transformation.Mol Cells 38, 925–935.
42 Van Damme M, Crompot E, Meuleman N, Maerevoet M, Mineur P, Bron D, Lagneaux L and Stamatopoulos B (2016) Characterization of TET and IDH gene expression in chronic lymphocytic leukemia:
comparison with normal B cells and prognostic significance.Clin Epigenetics8, 132.
43 Nie J, Liu L, Li X and Han W (2014) Decitabine, a new star in epigenetic therapy: the clinical application and biological mechanism in solid tumors.Cancer Lett 354, 12–20.