ISSN 2416-2140
European Ecocycles Society
Ecocycles, Vol. 6, No. 2, pp. 19-24 (2020) DOI: 10.19040/ecocycles.v6i2.173
OPINION
Human geography of drylands. I. Planning the database: Physical, built-up, chemical, biological (ecological), and social indicators
Matyas Arvai
1, Karoly Fekete
2, Laszlo Pasztor
1, Tamas Komives
3,41Institute for Soil Sciences and Agricultural Chemistry, Centre for Agricultural Research, LERN, Herman Otto 15, 1022 Budapest, Hungary;
2Lake Balaton Development Coordination Agency, Batthyany u. 1, 8600 Siófok, Hungary; Karoly Robert Campus, Szent Istvan University, Matrai ut 36, 3200 Gyongyos, Hungary, 4Plant Protection Institute, Centre for Agricultural Research, LERN, Herman Otto 15, 1022
Budapest, Hungary
E-mail addresses: arvai.matyas@atk.hu, karoly.fekete@balatonregion.hu, pasztor.laszlo@atk.hu, komives.tamas@atk.hu
Abstract – We propose a method based on multilayered mapping for investigating the current problems of people who live in drylands and we urge decision-makers to support such studies to establish the foundations for future decisive and preventive actions. This paper contains an expandable compilation of the environmental indicators (mostly mappable) that may influence the human geography of a certain region. We believe that this geospatial approach may help to resolve convoluted physical, chemical, and social relationships and, at the same time, generate a valuable database for further research. The application of the concept, if successful, will give directions to tackle certain contemporary problems in drylands and predict future ones caused by global climate change.
Keywords – drylands, human geography, database, GIS, geoinformation, geodata, multilayered mapping, social sciences Received: July 24, 2020 Accepted: October 5, 2020
...the least initial deviation from the truth is multiplied later a thousandfold.
Aristotle, 350 BC INTRODUCTION
The rapid development of the geographic information system (GIS) during the last quarter of a century has led to a diversity of uses in data visualization and analysis and paved the method’s way for a wide range of scientific disciplines, including agriculture (Gaborjanyi et al., 2003), geology, environmental science (Healy and Walshe, 2019), and most recently in social sciences (Ballas et al., 2017; Carter 2019;
Lechner et al., 2019). Thus, human geography (also called anthropogeography) studies investigate political-economic, cultural-social, and human-environment relations by using the multilayered mapping feature of GIS to resolve convoluted social relationships and, at the same time, generate valuable databases for further research (Li et al., 2019). The most important benefit of the method is that it can
visualize a vast variety of data. From the maps, valuable information can be extracted and used in feasibility studies or to achieve better-informed decisions (Ballas et al., 2017).
In this paper, we outline a concept of a) using multilayered mapping for studying current, day-to-day existential problems of people who live in drylands and b) present an expandable compilation of the environmental indicators (mostly mappable) that may influence the human geography of a dryland region. The application of the concept, if successful, will give directions to tackle certain contemporary problems and predict future ones caused by global climate change in drylands.
DRYLANDS
Approximately one-fifth of the total surface area of the Earth is defined as habitable by humans (Cervigni and Morris, 2016). Human habitats are conditions in which people live.
Besides, to be accessible, a human habitat needs to be able to
20
provide shelter, uncontaminated water, clean energy, unpol- luted environment, and an adequate amount of nutritious food. Furthermore, the habitat should not be vulnerable to cli- mate or other natural or human hazards (Filho et al., 2018).
Dryland type human habitats are specific areas defined by a scarcity of water. The United Nations Environment Program defines drylands as tropical and temperate areas characterized with an aridity index (AI, the ratio of the annual precipitation and potential evapotranspiration totals) less than 0.65 (Plaza et al., 2018).
All dryland countries, although widely different in many re- spect (resources, opportunities, etc.), need to address contin- uously problems related to the variability (and possible fur- ther changes) in the climate that influence the countries’ via- bility and may lead to social turbulence. COST Action CA16233 of the European Union has been initiated to im- prove the coordination of drylands research between scien- tific disciplines and different geographical areas. (Anon., 2019).
To carry out a human geography project the following tasks need to be executed:
a) database design: selection of indicators for multilayered mapping
b) data collection
c) data processing, analysis, and interpretation
d) proposals for tackling the current key problems of the study area and forecasting future ones
e) action, followed by monitoring and reflection.
DESIGN OF THE DATABASE Selection of indicators
We propose, for consideration, the indicators listed in Tables 1-12 as possible attributes (preferably in time-course format) for building a geoinformation database on drylands.
Naturally, except for the general indicators in Table 1, during the construction of the database, all Tables 2 to 12 would be united into a single table of attributes. Our list of indicators in the Tables, although it covers a wide range of environmental factors (physical, chemical, biological, and social) is not intended to be complete: criticism, additions, and corrections are welcome.
Indicator redundancy and identifiability
The number of indicators included in this paper may be considered unnecessarily extensive. Besides, several of the indicators listed in the Tables do not have yet established, widely-accepted scientific definitions, and quantifiable measures and units. Pilot investigations need to address the complex problems of indicator redundancy and identifiability using well-established complex mathematical models (Little et al., 2010).
For practical reasons, a pilot study may use a very narrow set of dryland-specific indicators and a composite indicator that
characterizes the human carrying capacity of the region studied.
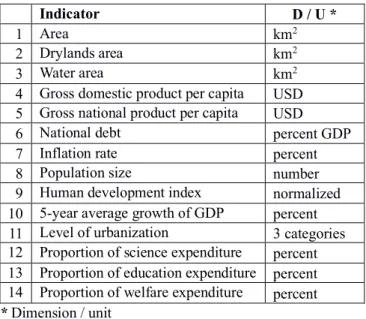
Table 1. General information on the country studied
Indicator D / U *
1 Area km2
2 Drylands area km2
3 Water area km2
4 Gross domestic product per capita USD 5 Gross national product per capita USD
6 National debt percent GDP
7 Inflation rate percent
8 Population size number
9 Human development index normalized 10 5-year average growth of GDP percent 11 Level of urbanization 3 categories 12 Proportion of science expenditure percent 13 Proportion of education expenditure percent 14 Proportion of welfare expenditure percent
* Dimension / unit
Table 2. Physical and natural environment: resources and hazards [mappable data]
Indicator D / U *
1 Average yearly temperature °C 2 Average monthly temperature °C
3 Sunshine duration h/year
4 Relative humidity percent
5 Precipitation (yearly) mm
6 Precipitation (monthly) mm
7 Volume of collected precipitation km3
8 Aridity Index composite
9 Number of reservoirs number
10 Reservoir capacity km3
11 Irrigated area km2
12 Total water consumption km3 13 Residential water consumption km3 14 Disasters: crop area affected km2 15 Disasters: size of affected population percent 16 Disasters: economic losses per centGDP
17 Flooding hazard composite
18 Land area of the admin. district km2
19 Arable land km2
20 Soil texture composite
21 Soil coarse fragments composite
22 Soil depth m
23 Soil drainage 5 classes
24 Soil available water capacity liter/m3
25 Soil sodicity composite
26 Soil salinity dS/m
27 Soil pH number
28 Soil organic matter content percent 29 Soil cation exchange capacity composite
21
30 Soil calcium carbonate content percent
31 Slope percent
32 Erosion tons/hectare
33 Terrain (elevation, slope, shelter) composite 34 Seismic (earthquake) hazard composite 35 Volcanic activity hazard composite
36 Sandstorm hazard composite
37 Green areas in cities km2
38 Crops: total area km2
39 Forest area km2
40 Edible wild plants Y/N
41 Edible wild animals Y/N
42 Predator hazard composite
43 Poisonous plant and animal hazard composite
44 Vectors of diseases composite
45 Emerging invasive species composite
* Dimension / unit
Table 3. Built environment [mappable data]
Indicator D / U *
1 Built-up area km2
2 Sewage system percent
3 Internet Y/N
4 Public lighting Y/N
5 Transport: rural access index composite 6 Transport: internatl. roughness index composite
7 Public transportation Y/N
8 Museums number
9 Theatres number
1 0
Film theatres number
11 Concert halls number
1
2 Schools number
1
3 Hospitals number
* Dimension / unit
Table 4. Environment: extent of pollution [mappable data]
Indicator D / U *
1 Pollution management projects USD 2 Environmental infrastructure projects USD
3 Utilized waste products percent
4 Waste water managed percent
5 Industrial sulfur dioxide emission
managed percent
6 Industrial soot emission managed percent
7 Air pollution managed percent
8 Water pollution managed percent
* Dimension / unit
Table 5. Social environment: population [mappable data]
Indicator D / U *
1 Population tree image
2 Average age number
3 Aged below 35 y percent
4 Aged below 15 y percent
5 Density people km-2
6 Sociodynamics composite
7 Fertility rate number
* Dimension / unit
Table 6. Social environment: community problems [map- pable data]
Indicator D / U *
1 Illegal drug use composite
2 Alcohol use composite
3 Crime composite
4 Youth violence composite
5 Child abuse composite
6 Discrimination (minority issues) composite 7 Availability of recreational activities composite
8 Racism composite
9 Homelessness composite
10 Poverty composite
11 Smoking status composite
12 Obesity composite
13 Malnutrition composite
14 Housing: renters percent
15 Housing: single-family dwellings percent
* Dimension / unit
Table 7. Social environment: economy [mappable data]
Indicator D / U *
1 Average income USD
2 Availability of food composite
3 Extractable geological materials composite
4 Tourism: guest nights number
5 Tourism: proportion of local GDP percent 6 Annual electricity consumption GW 7 Residential electricity consumption GW 8 Liquefied petroleum gas consumption m3
* Dimension / unit
Table 8. Social environment: healthcare [mappable data]
Indicator D / U *
1 Health care in GDP percent
2 Life expectancy index composite
3 Mental health composite
4 Availability of hospitals composite 5 Availability of local doctors composite 6 Infectious disease hazard composite
* Dimension / unit
Table 9. Social environment: education [mappable data]
Indicator D / U *
1 Mean years of schooling index number 2 Expected years of schooling index composite
3 Education index composite
22
4 Illiteracy percent
5 Availability of adult education composite
* Dimension / unit
Table 10. Social environment: culture [mappable data]
Indicator D / U *
1 Arts (performing, visual) composite 2 Education (primary, secondary, tertiary) composite
3 Literature composite
4 Gastronomy composite
5 Architecture composite
6 Politics composite
7 Clothing composite
8 Entertainment composite
9 Sports composite
10 Traditions composite
11 Mass media composite
12 Religion composite
* Dimension / unit
Table 11. Social environment: creativity [mappable data]
Indicator D / U *
1 Human capital index composite
2 Creative class index composite
3 Scientific talent index composite
4 Innovation index composite
5 R&D index composite
6 Global social tolerance index composite
* Dimension / unit
Table 12. Social environment: security [mappable data]
Indicator D / U *
1 Unemployment percent
2 Language skills composite
3 Inequality (Gini coefficient) composite
4 Work ethics composite
5 Opportunities for youth composite
6 Social structure composite
7 Social net composite
8 Social care composite
9 Democracy level composite
10 Mobility composite
11 Migration composite
12 Wealth distribution composite
13 Family structure composite
14 Leisure composite
15 Crime and public safety composite
* Dimension / unit DATA COLLECTION
Building a database of this scale is a tremendous task, that can be achieved only through a very large amount of human ef- fort: collecting and sifting through existing quantitative and qualitative data, evaluating existing written and digital rec- ords from libraries and satellite images.
On a positive note, artificial intelligence can be used to mon- itor and analyze social media with automation, improved ac- curacy, and reduced input of human labor (Perakakis et al., 2019). Furthermore, in addition to professionals (e.g., teach- ers and researchers), volunteers, activists, and the general public may provide unprecedented contributions via social media and citizen science (Roy et al., 2018).
DATA PROCESSING, ANALYSIS, AND INTERPRETA- TION
Several goals may be considered when evaluating the data.
For example,
a) evaluation of resource and environmental carrying capacity (Li, 2019) (Bao et al., 2020)
b) multi-criteria analysis of land suitability (Niles et al., 2015) c) factors limiting adaptation (Nguyen et al., 2015)
d) community health, population and environment, neighbor- hood effects, land use, fertility, migration (Logan et al., 2010) e) population dynamics (Organ, 2019)
f) ecological risk assessment using fuzzy analytical hierarchy process (Radionovs and Užga-Rebrovs, 2016)
g) multi-criteria decision analysis (Vaissi and Sharifi, 2019) h) local and regional vulnerability assessment (Polese et al., 2020).
CONCLUDING REMARKS
This paper contains an expandable compilation of environmental indicators (mostly mappable) that may influence the human geography of a certain region. We believe that a geospatial approach may help to resolve convoluted physical, chemical, and social relationships and, at the same time, generate a valuable database for further research. The application of the concept, if successful, will give directions to tackle certain contemporary problems and predict future ones caused by global climate change.
ACKNOWLEDGMENTS
The authors gratefully acknowledge the contribution of COST Action CA 16233 and helpful discussions with Dr. Pe- ter Pal Toth (Demography Institute, Hungarian Central Statis- tical Office) and Dr. Tamas Hermann (Pannon University, Keszthely).
PUBLIC INTEREST STATEMENT
The purpose of the paper was to outline a concept based on the application of multilayered mapping for investigating contemporary problems of inhabitants of drylands. It presents an expandable compilation of a large number of environ- mental indicators (mostly mappable) that may influence the human geography of a dryland territory. We conclude that the technique of multilayered mapping may help scientists and decision-makers in resolving convoluted physical, chemical, and social relationships and, at the same time, generate a valuable database for further research. Besides, the concept may provide guidance to tackle current dryland-related
23
problems and forecast ones caused by global climate change.
REFERENCES
Anon., 2019. Action CA16233 [WWW Document]. COST.
https://www.cost.eu/actions/CA16233/#tabs|Name:overview (Accessed 07.17.2020).
Aristotle (350 BC), On the Heavens. Book 1, Part 5, Paragraph 1. Translated by John L. Stocks. The Internet Classics Archive.
http://classics.mit.edu/Aristotle/heavens.1.i.html (Accessed 07.20.2020)
Ballas, D., Clarke, G., Franklin, R.S., Newing, A., 2017. GIS and the Social Sciences: Theory and Applications.
Routledge.
DOI: 10.4324/9781315759326
Bao, H., Wang, C., Han, L., Wu, S., Lou, L., Xu, B., Liu, Y., 2020. Resources and environmental pressure, carrying capacity, and governance: A case study of Yangtze River Economic Belt. Sustainability 12, 1576.
DOI: 10.3390/su12041576
Carter, J.C., 2019. Introduction to Human Geography Using ArcGIS Online. Esri Press.
Cervigni, R., Morris, M., 2016. Confronting drought in Africa’s drylands: Opportunities for enhancing resilience, Africa Development Forum. The World Bank.
DOI: 10.1596/978-1-4648-0817-3
Filho, W.L., Al-Amin, A.Q., Nagy, G.J., Azeiteiro, U.M., Wiesböck, L., Ayal, D.Y., Morgan, E.A., Mugabe, P., Aparicio-Effen, M., Fudjumdjum, H., Chiappetta Jabbour, C.J., 2018. A comparative analysis of climate- risk and extreme event-related impacts on well-being and health: Policy implications. Int. J. Environ. Res. Public.
Health 15(2) 331.
DOI: 10.3390/ijerph15020331
Gaborjanyi, R., Pasztor, L., Papp, M., Szabo, J., Mesterhazy, Á., Nemeth, T., Komives, T., 2003. Use of remote sensing to detect virus-infected wheat plants in the field. Cereal Res. Commun. 31, 113–120.
DOI: 0.5281/zenodo.3054549
Healy, G., Walshe, N., 2019. Real-world geographers and geography students using GIS: relevance, everyday applications and the development of geographical knowledge. Int. Res. Geogr. Environ. Educ. 29, 178–196.
DOI: 10.1080/10382046.2019.1661125
Lechner, A.M., Owen, J., Ang, M., Kemp, D., 2019. Spatially integrated social sciences with qualitative GIS to support impact assessment in mining communities. Resources 8, 47.
DOI: 10.3390/resources8010047
Li, K., Jin, X., Ma, D., Jiang, P., 2019. Evaluation of resource and environmental carrying capacity of China’s rapid- urbanization areas - A case study of Xinbei District, Changzhou. Land 8, 69.
DOI: 10.3390/land8040069
Little, M.P., Heidenreich, W.F., Li, G., 2010. Indicator identifiability and redundancy: Theoretical consider- ations. PLOS ONE 5, e8915.
DOI: 10.1371/journal.pone.0008915
Logan, J.R., Zhang, W., Xu, H., 2010. Applying spatial thinking in social science research. GeoJournal 75, 15–27.
DOI: 10.1007/s10708-010-9343-0
Michalek, J., Zarnekow, N., 2012. Application of the rural development index to analysis of rural regions in Poland and Slovakia. Soc. Indic. Res. 105, 1–37.
DOI: 10.1007/s11205-010-9765-6
Nguyen, T.T., Verdoodt, A., Van Y, T., Delbecque, N., Tran, T.C., Van Ranst, E., 2015. Design of a GIS and multi- criteria based land evaluation procedure for sustainable land-use planning at the regional level. Agric. Ecosyst.
Environ. 200, 1–11.
DOI: 10.1016/j.agee.2014.10.015
Niles, M.T., Lubell, M., Brown, M., 2015. How limiting factors drive agricultural adaptation to climate change.
Agric. Ecosyst. Environ. 200, 178–185.
DOI: 10.1016/j.agee.2014.11.010
Organ, J., 2019. Changing weather, crop yields and Chadian population dynamics.
DOI: 10.13140/RG.2.2.19959.57768
Perakakis, E., Mastorakis, G., Kopanakis, I., 2019. Social media monitoring: An innovative intelligent approach.
Designs 3, 24.
DOI: 10.3390/designs3020024
Plaza, C., Zaccone, C., Sawicka, K., Méndez, A.M., Tarquis, A., Gascó, G., Heuvelink, G.B.M., Schuur, E.A.G., Maestre, F.T., 2018. Soil resources and element stocks in drylands to face global issues. Sci. Rep. 8.
DOI: 10.1038/s41598-018-32229-0
Polese, M., Di Ludovico, M., Gaetani d’Aragona, M., Prota, A., Manfredi, G., 2020. Regional vulnerability and risk assessment accounting for local building typologies. Int.
J. Disaster Risk Reduct. 43, 101400.
DOI: 10.1016/j.ijdrr.2019.101400
Radionovs, A., Užga-Rebrovs, O., 2016. Fuzzy analytical hierarchy process for ecological risk assessment. Inf.
Technol. Manag. Sci. 19.
DOI: 10.1515/itms-2016-0005
Roy, H., Groom, Q., Adriaens, T., Agnello, G., Antic, M., Archambeau, A.-S., Bacher, S., Bonn, A., Brown, P., Brundu, G., López, B., Cleary, M., Cogălniceanu, D.,
24
Groot, M. de, Sousa, T.D., Deidun, A., Essl, F., Pečnikar, Ž.F., Gazda, A., Gervasini, E., Glavendekic, M., Gigot, G., Jelaska, S., Jeschke, J., Kaminski, D., Karachle, P., Komives, T., Lapin, K., Lucy, F., Marchante, E., Marisavljevic, D., Marja, R., Torrijos, L.M., Martinou, A., Matosevic, D., Mifsud, C., Motiejūnaitė, J., Ojaveer, H., Pasalic, N., Pekárik, L., Per, E., Pergl, J., Pesic, V., Pocock, M., Reino, L., Ries, C., Rozylowicz, L., Schade, S., Sigurdsson, S., Steinitz, O., Stern, N., Teofilovski, A., Thorsson, J., Tomov, R., Tricarico, E., Trichkova, T., Tsiamis, K., Valkenburg, J. van, Vella, N., Verbrugge, L., Vétek, G., Villaverde, C., Witzell, J., Zenetos, A.,
Cardoso, A.C., 2018. Increasing understanding of alien species through citizen science (Alien-CSI). Res. Ideas Outcomes 4, e31412.
DOI: 10.3897/rio.4.e31412
Vaissi, S., Sharifi, M., 2019. Integrating multi-criteria decision analysis with a GIS-based siting procedure to select a protected area for the Kaiser’s mountain newt, Neurergus kaiseri (Caudata: Salamandridae). Glob. Ecol.
Conserv. 20, e00738.
DOI: 10.1016/j.gecco.2019.e00738
© 2020 by the author(s). This article is an open-access article distributed under the terms and conditions of the Creative Commons Attribution (CC-BY) license (http://creativecommons.org/licenses/by/4.0/).
![Table 12. Social environment: security [mappable data]](https://thumb-eu.123doks.com/thumbv2/9dokorg/769856.34249/4.892.67.430.495.644/table-social-environment-security-mappable-data.webp)
