CH A P T E R 9
Compositional Variation and Heterogeneity of Nucleic Acids and Protein in Bacteria
N . SU E O K A
I. I n t r o d u c t i o n 419
420 420 421 429 430 431 434 440 I I . D N A B a s e C o m p o s i t i o n
A. V a r i a t i o n B . H e t e r o g e n e i t y C. S e q u e n c e A n a l y s i s . . . . I I I . B a s e C o m p o s i t i o n of R N A
I V . A m i n o A c i d C o m p o s i t i o n of P r o t e i n V. D i s c u s s i o n
R e f e r e n c e s I. Introduction
Interrelationship among the three biological macromolecules, D N A (deoxyribonucleic acid), R N A (ribonucleic acid), and protein, has been a central subject of biological and biochemical investigations for the last decade. T h e achievements obtained so far from such studies are truly re
markable. F u n d a m e n t a l questions of genetics involving gene structure, action, replication, mutation, recombination, and transmission are now at least partially understood in molecular terms. Enzymic steps involved in the biosynthesis of the macromolecules have been discovered and fairly well characterized. T h e conceptual connection of the three macromolecules is understood as the flow of genetic information stored in D N A to protein.
Variation and heterogeneity in the over-all base composition of D N A and R N A in the amino acid composition of protein are statistical averages of each system and by themselves do not directly define a mechanism.
Nevertheless, a systematic knowledge of compositional information is im
portant. I t helps to grasp the entire picture, allows interpretation of specific cases relative to this total picture, and suggests theories which m a y open new experimental approaches.
I n the present chapter, the accumulated d a t a on the base composition of D N A will first be presented in detail. Then, the base composition of R N A and the amino acid composition of protein will be discussed in relation to the base composition of D N A . Our primary purpose will not be to m a k e an exhaustive compilation of existing data, but to present an over-all picture of the problem. For further information, appropriate review articles m a y be consulted.1 - 6
419
420 N . S U E O K A
Several aspects of the compositional studies of D N A , R N A , and pro
tein are listed below.
1. Structural regularities of the macromolecules inferred from composi
tional regularities.
2. Comparative aspects (variation) of composition among different or
ganisms.
3. Compositional heterogeneity among the D N A molecules of an or- ganism.
4. Compositional correlation between different macromolecules.
5. Genetic interaction and similarity of D N A base composition between different organisms.
6. Compositional change of the macromolecules.
These aspects of the compositional studies of macromolecules have played a number of initiating roles in the development of present-day molecular biology. A couple of examples will be enough to illustrate the point. Equimolarity of adenine and thymine, and of guanine and cytosine, in D N A , which had been deduced from data on the chromatographic base a n a l y s i s7 , 8 provided essential information for the formulation of the Watson-Crick structure of D N A .9 The first physical evidence of the existence of messenger R N A was in the similarity of its base composition to t h a t of D N A .1 0
II. D N A Base Composition
Overwhelming d a t a have been accumulated on the average base compo
sition of double-stranded D N A , which show the equimolar contents of guanine (G) with cytosine ( C ) , and adenine (A) with thymine ( T ) .1 Consequently, in this review the composition will be expressed as the percentage of guanine plus cytosine (GC-content; D o t y et al.11). The base composition of D N A has two basic features: the variation of the mean D N A base composition in different organisms, and the heterogeneity of the base composition of the D N A molecules within an individual or a species. These two features will be described in the following sections.
A. VA R I A T I O N
A compilation of existing data on species difference of the average base composition is presented in Table I from which the following features are apparent :
1. Lower forms of life have more variability in the D N A base composi
tion.
Higher organisms definitely tend to have a narrower range of variation in the D N A base composition (Table I) when one organism is compared to another. However, higher organisms possess a larger compositional
9. V A R I A T I O N A N D H E T E R O G E N E I T Y O F N U C L E I C A C I D S A N D P R O T E I N 421
heterogeneity within the D N A of a single organism. W e shall return to this point later.
2. T h e range of D N A base composition is approximately between 25 and 75% GC.
T h e mean of D N A GC-contents of bacteria and protozoa is found in the range of 25 to 75%, and this extends over the range of the mean D N A GC-content of higher organisms. The absence of natural D N A outside this range (with one exception noted below) m a y suggest t h a t the genetic information necessary for the survival of an organism cannot be stored by adenine and thymine or guanine and cytosine alone.
3. Phylogenetic relations are reflected in the mean GC-content.
This point was first raised by Lee et al.23 from their analysis of the base composition of bacterial D N A . Belozersky and Spirin2 4 added further evidence. Among bacterial species there are several cases in which taxo- nomically related bacteria have similar values of GC-content. For example, some genera of the Enterobacteriaceae, Escherichia, Salmonella, and Shigella, have similar GC-contents of their D N A . A number of such ex
amples have been discussed in their p a p e r s .2 3 , 2 4 Moreover, both groups of authors have suggested t h a t reclassification m a y be made for some species of bacteria according to the D N A base composition. I n higher organisms, the feature is even more evident. F o r example, all forms of vertebrates so far tested have a mean GC-content of 40 to 44% (Table I ) . Examples found in protozoa and algae give more examples supporting the idea
(Table I ) . T h e mean D N A GC-content of various strains of Tetrahymena pyriformis lies within a narrow range (25-31%), and yet the difference in the GC-content is rather uniform among the m o l e c u l e s .1 8 , 2 5 A similar situation is found in other species of protozoa.1 9 A comprehensive treat
ment of this issue has recently been provided by M a r m u r et al. 6
Β . HE T E R O G E N E I T Y
E a r l y evidence of compositional heterogeneity of D N A was based on salt fractionations of D N A molecules from its complex with basic pro
teins of various kinds, and on chromatographic analysis of base composi
tion of fractionated D N A . T h u s Chargaff et al.26 succeeded in separating calf t h y m u s D N A into fractions containing 35 to 50% GC. Brown and W a t s o n2 7 report compositional fractionation of calf t h y m u s D N A by using a histone-kieselguhr column. F u r t h e r fractionation was applied to the D N A of pig liver, h u m a n spleen, and coliphage T 6 by Crampton et al28 Except in the coliphage D N A , existence of heterogeneity was demon
strated.
T h e nature of the heterogeneity became much clearer when two proper
ties of D N A , hyperchromicity and density, were found to be dependent on
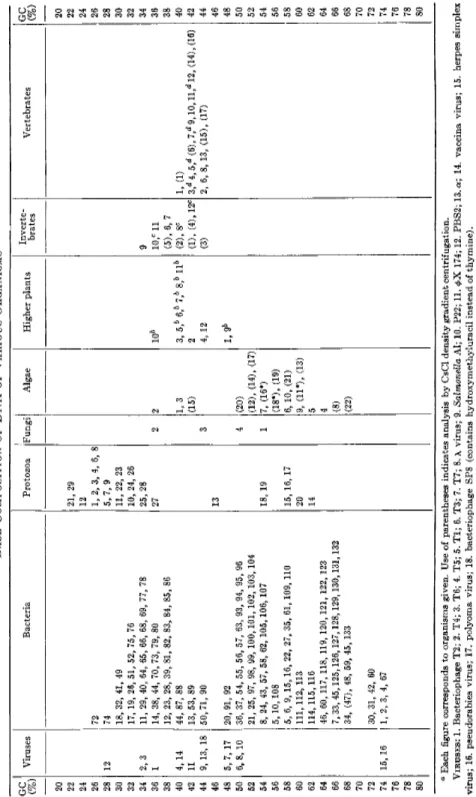
TABLE I BASE COMPOSITION OF DNA OF VARIOUS ORGANISMS" GC (%) Viruses Bacteria Protozoa Fungi Algae Higher plants Inverte brates Vertebrates GC (%) 20 20 22 21, 29 22 24 12 24 26 72 1, 2, 3, 4, 6, 8 26 28 12 74 5,7, 9 28 30 18, 32, 41, 49 11, 22, 23 30 32 17, 19, 26, 51, 52, 75, 76 10, 24, 26 32 34 2, 3 11, 29, 40, 64, 65, 66, 68, 69, 77, 78 25, 28 9 34 36 1 14, 38, 44, 70, 73, 79, 80 27 2 2 106 10,c 11 36 38 12, 23, 28, 39, 81, 82, 83, 84, 85, 86 (5), 6, 7 38 40 4,14 44, 87, 88 1, 3 3, 5b 6,b 7b Sb llb (2), 8C 1, (1) 40 42 11 13, 53, 89 (15) 2 (1), (4),12c 3,d 4,5,d (6), 7,d 9,10, ll,rf 12, (14), (16) 42 44 9, 13, 18 50,71, 90 3 4, 12 (3) 2, 6, 8,13, (15), (17) 44 46 13 46 48 5,7, 17 20, 91, 92 1, 9& 48 50 6, 8,10 36, 37, 54, 55, 56, 57, 63, 93, 94, 95, 96 4 (20) 50 52 21, 25, 97, 98, 99, 100,101, 102, 103, 104 (12), (14), (17) 52 54 8, 24, 43, 57, 58, 62, 105, 106, 107 18, 19 1 7, (16*) 54 56 5,10,108 (18*), (19) 56 58 5, 6, 9, 15, 16, 22, 27, 35, 61, 109, 110 15, 16, 17 6,10, (21) 58 60 111, 112, 113 20 9, (11*), (13) 60 62 114, 115,116 14 5 62 64 66 68
46, 60, 117, 118, 119, 120, 121, 122, 123 7, 33, 45,125,126,127, 128, 129,130,131,132 34, (47), 48, 59, 45, 133 4 (8) (22)
64 66 68 70 70 72 30, 31, 42, 60 72 74 15, 16 1, 2, 3, 4, 67 74 76 76 78 78 80 80 ° Each figure corresponds to organisms given. Use of parentheses indicates analysis by CsCl density gradient centrifugation. VIRUSES: 1. Bacteriophage T2; 2. T4; 3. T6; 4. T5; 5. Tl; 6. T3; 7. Τ7; 8. λ virus; 9. Salmonella Al; 10. P22; 11. φΧ 174; 12. PBS2; 13. α; 14. vaccina virus; 15. herpes simplex virus; 16. pseudorabies virus; 17. polyoma virus; 18. bacteriophage SP8 (contains hydroxymethyluracil instead of thymine).
422
References: Organisms 1-11 (cited in ref. 4); 12 (ref. 12); 13 (ref. 13); 14 (ref. 14); 15, 16 (ref. 15); 17 (ref 16); 18 (ref. 17). BACTERIA: 1. Actinomyces globisporus flaveolus; 2. Actinomyces globisporus streptomycini; 3. Actinomyces griseus; 4. Actinomyces viridochromogenes; 5. Aerobacter aerogenes; 6. Agrobacteria tumefaciens; 7. Alcaligenes faecalis; 8. Azotobacter agile; 9. Azotobacter chroococcum; 10. Azotobacter vinelandii; 11. Bacillus cereus; 12. Bacillus mtegaterium; 13. Bacil- lus subtilis; 14. Bacillus thuringiensis; 15. Bifidibacterium bifidum; 16. Brucella abortus; 17. Clostridium bifermentans; 18. Clostridium perfringens; 19. Clostridium valerianicum; 20. Corynebacterium acnes; 21. Corynebacterium diphtheriae; 22. Corynebacterium parvum; 23. Diplococcus pneumoniae; 24. Erwinia carotovora; 25. Escherichia coli; 26. Fusiformis fusiformis; 27. Fusiformis polymorphus; 28. Hemophilus influenzae; 29. Micrococcus asaccharolyticus; 30. Micromonospora coerulea; 31. Micrococcus lysodeikticus; 32. Micrococcus pyogenes; 33. Mycobacterium phlei; 34. Mycobacterium tuberculosis; 35. Mycobacterium vadosum; 36. Neisseria gonorrhoeae; 37. Neisseria meningitidis; 38. Pasteurella aviseptica; 39. Pasteurella boviseptica; 40. Pasteurella tularensis; 41. Plectridium saprogenes; 42. Proactinomyces citreus;AZ. Proteus morganii; 44. Proteus vulgaris ; 45. Pseudomonas aeruginosa; 46. Pseudomonas fluorescens; (47) Pseudomonas saccharophila; 48. Pseudomonas tabaci; 49. Ramibacterium ramosum; 50. Rickettsia burneti; 51. Rickettsia prowazeki; 52. Ristella clostridiformis; 53. Ristella insolit; 54. Salmonella enteritidis; 55. Salmonella gallinarum; 56. Salmonella paratyphi; 57. Salmonella typhimurium; 58. Salmonella typhosa; 59. <Sar- cina flava; 60. Sarcina lutea; 61. Serratia marcescens; 62. Shigella dysenteriae; 63. Shigella paradysenteriae; 64. Staphylococcus pyogenes; 65. Streptococcus faecalis; 66. Streptococcus foetidus; 67. Streptococcus griseus; 68. Streptococcus pyogenes; 69. Streptococcus zymogenes; 70. Veillonella parvula; 71. Vibrio cholerae; 72. Welchia perfringens; 73. Micoplasma gallisepticum (PPLO A5969). 74. Spirillum linum; 75. Flavobacterium aquatile; 76. Cytophaga johnsonii; 77. Leptospira pomona; 78. Sporocytophaga myxocaccoides; 79. Strep- tococcus faecium; 80. Treponema pallidum; 81. Streptococcus bovis; 82. Streptococcus crempris; 83. Streptococcus viridans; 84. Streptococcus sanguis; 85. Cytophaga fermentans; 86. Cytophaga aurantiaca; 87. Leptospira biflexa; 88. Pseudomonas cruciviae; 89. Vibrio metschnikovii; 90. Saprospira grandis; 91. Flavobacterium acidificum; 92. Spirillum serpens; 93. Shigella dispar; 94. Shigella sonnei; 95. Salmonella abony; 96. Erwinia rhapontica; 97. Erwinia milletiae; 98. Erwinia chrysanthemi; 99. Erwinia nimipressuralis; 100. Klebsiella aerogenes; 101. Klebsiella edwardsii; 102. Klebsiella atlantae; 103. Erwinia ananas; 104. Erwinia cypripedii; 105. Klebsiella rhinoscleromatis; 106. Erwinia nigrifluens; 107. Alcaligenes faecalis ; 108. Aeromonas punctata; 109. Corynebacterium ilicis; 110. Aeromonas formicans; 111. Pseudomonas fragii; 112. Ftùno tyrogenes; 113. Vibrio cuneatus; 114. Xanthomonas pelargoni; 115. Xanthomonas hederae; 116. Arthrobacter globiformis; 117. Xanthomonas phaseoli; 118. Xanthomonas pisi; 119. Vibrio percolans; 120. i7a- vebactenum vitarumens; 121. Pseudomonas stutzeri; 122. Pseudomonas putida; 123. Microcyclus sp.; 125. Pseudomonas diminuta; 126. Pseudomonas maltiphilia; 127. Myxococ- oo CMS fulvus; 128. Myxococcus virescens; 129. M#xococcus xanthus; 130. Flavobacterium falavescens; 131. Flavobacterium arborescens; 132. Flavobacterium suaveolens; 133. Flavobacter- ium ester oar omaticum.
TABLE I—Continued References: Organisms 1-73 (cited in ref. 5) ; 74-133 (cited in ref. 6). PROTOZOA: 1. Tetrahymena pyriformis 1-A; 2. l-WH-52; 3. 1-1L-12; 4. 2-1; 5. 3-1; 6.7-1; 8. 8-2; 9. 9-1; 10. E; 11. GL; 12. Tetrahymenarostrata; 13. Euglena gracilis; 14. Isochrysis galbana; 15. Prymnesium parvum; 16. Crithidia lucilliae; 17. Crithidia fasciculata; 18. Strigomonas oncopelti; 19. Leishmania tarentolae; 20. Trypanosoma lewisi; 21. Tetrahymena patula LFF; 22. Tetrahymena pyriformis W; 23. Paramecium aurelia 51.7s; 24. Colpidium colpidium Carolina; 25. Colpidium colpidium Burbank; 26. Colpidium camphylum; 27. Colpidium truncatum; 28. Glaucoma chattoni; 29. Dictyostelium discoideum NC-4. References: Organisms 1-12 (cited in ref. 18); 13-29 (ref. 19). FUNGI: 1. Neurospora crassa; 2. yeast; 3. Psalliota campestris; 4. Aspergillus niger. References: Organisms 1-2 (cited in ref. 5) ; 3, 4 (ref. 3). ALGAE: 1. Chaetoceros decipiens; 2. Rhabdonema adriaticum; 3. Thalassiosira Nordenscheldii; 4. Scenedesmus acuminatus; 5. Scenedesmus quadricauda; 6. Ankistrodesmus sp.; 7. Hydrodictyon reticulatum; 8. Chlamydomonas reinhardi; 9. Chlorella ellipsoidea; 10. Cystosirabarbata; 11.* Chlamydomonas eugametos; 12. Polytomauvella;13. Chlamydomonas moewusii; 14. Monodus subterraneus; 15. Polytoma agilis; 16.* Chlorogonium elongatum; 17. Phormidium luridum; 18.* Astasia longa; 19. Ulothrix fimbriata; 20. Navicula closte- rium; 21. Navicula pelliculosa; 22. Chlamydomonas angulosa. * Satellite DNA present. References: Organisms 1-10 (cited in ref. 5); 11-22 (ref. 20). HIGHER PLANTS: 1. Alnus barbata; 2. Salix acubifolia; 3. Salix caprea; 4. Crylus avelana; 5. Papaver somniferum; 6. Cucurbita pepo; 7. Phaseolus vulgaris; 8. Arachis hypogaea; 9. Triticum vulgare; 10. Allium cepa; 11. Pinus sibirica; 12. Corulus avelana. References: Organisms 1-11 (cited in ref. 5); 12. (ref. 21). INVERTEBRATES: 1. Cancer borealis (the major DNA); 2. Cancer irroratus (the major DNA); 3. Carcinus maenas; 4. Lumbricas terrestris (earthworm); 5. Venus mercenaria (clam); 6. Arbacia lixula (sea urchin); 7. Arbacia punctulata (sea urchin); 8. Echinusesculentus (sea urchin); 9. Echinocardium cordatum (sea urchin); 10. Paracentrotus lividus (sea urchin); 12. Psammechinus miliaris (sea urchin); 12. Locusta migratoria (locust). References: Organisms 1-12 (cited in ref. 5). VERTEBRATES: 1. Man (thymus, liver, spleen, sperm); 1 man (kidney, tissue culture); 2. horse (spleen); 3. ox (thymus, spleen, liver, pancreas, kidney, testes, sperm); 4. sheep (thymus, liver, spleen, sperm) ; 5. pig (thymus, liver, spleen, thyroid) ; 6. mouse (sarcoma) ; 6. mouse (testes and spleen) ; 7. rat (bone marrow) ; 8. hen (erythrocytes, egg) ; 9. salmon (sperm); 10. trout (sperm); 11. herring (testes); 12. shad (testes); 13. turtle (erythrocytes); 14. frog (Rana pipiens) (testes); 15. alligator (liver, brain, spleen); 16. monkey (rhesus) (liver, brain, spleen); 17. guinea pig (liver, kidney, spleen). References: Organisms 1-14 (cited in ref. 5); 15-17 (ref. 22). & 3.8-6.4% 5-methylcytosine has been reported. c 0.2-1.8% 5-methylcytosine has been reported. 1.0-2.8% 5-methylcytosine has been reported.
9. V A R I A T I O N A N D H E T E R O G E N E I T Y O F N U C L E I C A C I D S A N D P R O T E I N 4 2 5
base composition. M a r m u r and D o t y2 9 found t h a t the temperature (Tm) at which D N A configuration changes from the double-stranded state to the random coil state measured by the hyperchromic shift in the ultraviolet, is a linear function of the base composition of D N A . D N A ' s with higher GC-content required higher temperatures for their denaturation. T h u s the profile of the hyperchromicity should be indicative of the extent of heterogeneity. Another technique which became available was density gradient centrifugation using cesium chloride as originated by Meselson et al.30 Using this technique, a positive correlation between density and GC-content of D N A was found independently by Rolfe and Meselson3 1 and Sueoka et al?2 T h e correlation was studied more extensively later by Schildkraut et al?3
1. UN I M O D A L I T Y
A wide survey of D N A in CsCl density gradient centrifugation5' 3 1 - 3 3
revealed t h a t in the majority of cases D N A forms one band, indicating t h a t the distribution of the base composition has an unimodal character.
T h e width of the distribution, however, depends on the organism of origin.
I n general, higher organisms have a wider distribution t h a n the lower organisms. Since the band profile of a D N A sample is very much affected by both its molecular weight and heterogeneity, an accurate estimation of heterogeneity is not easily obtainable. An approximate picture can be obtained from the results given in Table I I . Analyzing distributions of different genetic markers in CsCl density gradient, heterogeneity has been shown in transforming principles of pneumococcus3 4' 3 5 and of Bacillus subtilis?6 Inactivation of markers by heat denaturation also indicated heterogeneity of base c o m p o s i t i o n ,3 7 , 3 8 although irreversible denaturation occurs when the most heat-resistant p a r t of the molecule is separated.3 8
There are several cases in which D N A shows a secondary band or bands in relatively small amounts in the density gradient field. These will be discussed in the following section.
2 . SA T E L L I T E D N A
T h e first observation of satellite (or secondary) bands were made in calf thymus, mouse testis and spleen, and crab testis D N A .5 Since then, numerous cases have been reported (Table I I I ) . I n most cases, the nature and function of such bands are not clear, but the following are of particular interest. First, M a r m u r et al?Q showed t h a t the interspecific transfer of episome F from Escherichia coli to Serratia marcescens44 was accompanied by the appearance of a satellite band. This satellite band has a density similar to t h a t of E. coli.44 This finding is important, since it proposes one of mechanism which m a y account for the origin of satellite bands in gen-
426 N. SUEOKA
eral. Second, cases found in higher plants and a l g a e4 5 suggest t h a t the satellite bands in these organisms m a y be connected to some cytoplasmic self-duplicating unit, possibly chloroplast. A third example is the k a p p a particle in Paramecia aurelia.*1 I n this case the infectious particle itself has D N A of a different base composition from the host D N A , which m a y represent a category of intracellular symbiosis. Under this category, a
T A B L E I I
HETEROGENEITY OF D N A B A S E COMPOSITION ESTIMATED BY D E N S I T Y
GRADIENT CENTRIFUGATIONΑ
Source 2σ (in GC-content, %) Ref.
V e r t e b r a t e s
H u m a n k i d n e y cells M o u s e s p l e e n F r o g t e s t i s Calf t h y m u s
< 9 . 6
< 7 . 6 6.2
9.6 31
B a c t e r i a
Diplococcus pneumoniae
Bacillus megaterium Bacillus subtilis Escherichia coli
Micrococcus lysodeikticus Micrococcus pyogenes aureus Serratia marcescens Shigella dysenteriae Sarcina lutea
Pseudomonas aeruginosa
3.9
< 6 . 0
31
a T h e s i g n < i n d i c a t e s t h a t t h e σ ( s t a n d a r d d e v i a t i o n ) h a s b e e n c a l c u l a t e d from t h e t o t a l v a r i a n c e ( σΤ2 ) of t h e D N A d i s t r i b u t i o n in t h e d e n s i t y g r a d i e n t field, w h i c h g i v e s t h e m a x i m u m e s t i m a t e of t h e h e t e r o g e n e i t y .
If we t a k e t h e n u m b e r - a v e r a g e m o l e c u l a r w e i g h t as 5 Χ 106, w e will n o t be t o o far from r e a l i t y . T h e n , c o r r e s p o n d i n g 2σ e x p e c t e d , is a b o u t 1.0.
trypanosomatid flagellate, Crithidia oncopelti, contains a bacterial endo- symbiote whose D N A is responsible for the satellite D N A of the flagel
l a t e .4^ A fourth example is found in the recent report by R o l f e4 6 on satel
lite D N A bands in exponentially growing bacteria, E. coli, Bacillus subtilis, and Bacillus megaterium. These findings are important because these satel
lite bands could be a implicative form of D N A .4 6 A fifth example is the satellite D N A which exists in several species of marine crabs both in the Atlantic and in the Pacific5- 42> 4 7 (Table I I I ) . The density of the satellite
9. VARIATION AND HETEROGENEITY OF NUCLEIC ACIDS A N D PROTEIN 427 band is similar to t h a t of the deoxyadenylate-thymidylate polymer enzy
mically synthesized.4 8 T h e satellite D N A was isolated4 9 by the methylated albumin-kieselguhr column technique.5 0 I t has double helical characteris
t i c s4 7 and contains about 3 % GC. I t can act as a primer for D N A poly
merase a n d t h e resulting deoxyadenylate and deoxythymidylate residues are found in alternating sequence.5 1 T h e biological significance of the poly
mer is not clear a t the moment. A sixth example is a light satellite D N A of
T A B L E I I I
SATELLITE D N AA
Organism
Main DNA Satellite DNA
Notes Ref.
Organism
Density GC (%) Density GC (%) Amt. (%)
Notes Ref.
Serratia marscesens with E. 1.718 58 1.709 50 0.1-0.2 E. coli episome 39 coli episome
Halobacterium salinarium 1.727 67 1.718 53 20 40
Halobacterium cutirubrum Small satellite 40
Paramecium aurelia 1.689 29 1.696 36 Kappa particle 41
Cancer borealis 1.702 42 1.681 2.7 30 Analyzed by Swartz et 5 al*a
Cancer irroratus 1.700 42 1.680 11 5
Cancer antennaris Stimpson 1.700 42 1.677 26 42
Cancer gracilis Dana 1.700 42 1.680 9 42
Cancer magister Dana 1.701 42 1.677 14 42
Cancer productus Randall 1.701 42 1.679 32 42
Calf thymus 1.704 44 1.715 55 43
Mouse testis and spleen 1.702 43 1.692 33 43
Guinea pig 1.703 44 1.697 38 22
Escherichia coli, Bacillus sub- Rolfe43 reports that in these bacteria DNA from exponentially growing cells tilis, B. megaterium show two satellite bands in CsCl density gradient centrifugation, one heavier than the main band, the other slightly lighter than the average of the main band
Chlamydomonas reinhardi, Chun et αϊ.4 5 find two satellite bands in these organisms, at least one ol Euglena, spinach which may correspond to DNA in chloroplasts. Some species of algae
have satellite DNA (see Table I) which are not listed here because of the preliminary nature of the observation
° In order to make the density values of DNA comparable, the system3 3 in which the density of E. coli DNA was taken as 1.710 was adopted in this table.
mouse testis and spleen.5 , 22> 5 2 T h e density of the satellite band is lighter than the main band (Ap — —0.010) a n d corresponds to 32% GC. However, the lightness of this D N A m a y not be due to a lower GC-content. Cheng and S u e o k a4 3 fractionated mouse testis D N A on a methylated albumin column which can separate nucleic acids by base composition4 9 as well as by size.5 0 The satellite D N A elutes in a lower concentration of N a C l t h a n t h e main D N A , which is opposite to the result expected. T h e narrowness of the satel
lite band in t h e density gradient suggests t h a t t h e elution p a t t e r n cannot be explained b y a small molecular size. T h e result indicates, therefore, ei-
428 N . SUEOKA
ther t h a t the light satellite band contains a high content of an unusual base, or t h a t it is combined firmly with other material of low density. This is compared with the heavy satellite band of calf thymus D N A which be
haves as we expect, i.e., it elutes with a lower concentration of N a C l . There are several other cases where satellite D N A bands (Table I I I ) exist, but their nature and significance remain to be elucidated.
3. INTERCHAIN B I A S E S
Although equimolarity of A to Τ and G to C holds in the Watson-Crick double helical structure of D N A , there can be two orientations of the base pairs, namely, A - T or T-A, and G-C or C-G.9 If the two orientations are equally frequent for each base pair, each of the two complementary chains of D N A should have four bases of equal frequency. On the other
T A B L E I V
UNBALANCED B A S E COMPOSITIONS OF NUCLEIC ACIDS
Organism Nucleic acid C G T ( U ) A Ref.
φΧ 174 S i n g l e - s t r a n d e d D N A 1 8 . 5 24.1 3 2 . 7 2 4 . 7 54 P h a g e a D o u b l e - s t r a n d e d D N A
S t r a n d 1 2 1 . 3 2 4 . 1 2 4 . 5 3 0 . 1 13
S t r a n d 2 2 4 . 2 19.9 3 2 . 1 2 4 . 0
P h a g e f 2 R N A 27 26 25 22 55
S o u t h e r n b e a n m o s a i c R N A 23 26 25 26 56
v i r u s
T o m a t o b u s h y s t u n t R N A 21 28 25 28 56
v i r u s
C u c u m b e r v i r u s R N A 19 26 30 26 56
T o b a c c o m o s a i c v i r u s R N A 19 26 27 29 56
T u r n i p y e l l o w v i r u s R N A 38 17 22 23 56
P o l i o v i r u s R N A 22 24 25 29 57
hand, if there is a bias in the orientation, the A / T a n d / o r G / C of each chain m a y be different. This point was raised first by D a v e r n .5 3 Known cases where D N A and R N A have biased orientations of base pairs are summarized in Table IV. Various phages of B. subtilis have different den
sities for the two chains of their D N A , possibly because of the biased con
tents of 5-hydroxymethyl-deoxyribouridylic acid between the two comple
mentary c h a i n s .5 3 a T h e bias is bound to have biological significance ; this will be discussed later.
4. INTRAMOLECULAR HETEROGENEITY
D a t a on intramolecular heterogeneity of D N A base composition are very scarce. When calf t h y m u s and pneumococcus D N A molecules are
9. V A R I A T I O N A N D H E T E R O G E N E I T Y O F N U C L E I C A C I D S A N D P R O T E I N 429 fragmented by sonication without breaking hydrogen bonds, the increase of the D N A b a n d width in the CsCl density gradient does not exceed a p preciably the value expected from the reduction of the molecular weight.5 8 I n this case, original D N A samples had molecular weights of 10 Χ 106 for calf t h y m u s and pneumococcus, and after sonication, 0.8 Χ 106 and 1.6 Χ 106, respectively. This indicates t h a t intramolecular base distribu
tion is fairly uniform. However, the technique cannot be applied for smaller molecular weights because of the difficulty of banding small molecules in CsCl density gradient centrifugation. T h e nearest neighbor frequency analyses of various D N A (Josse et al.67) indicate the frequencies of different dinucleotides fairly close to those expected from the frequency of each base in the D N A sample for random sequence of the bases. This indicates t h a t distribution of bases along the D N A chain is rather uniform.
Heterogeneity in small regions of the D N A molecule should come from studies on simpler systems, like phage D N A or episomes. I n this connec
tion, mention should be made of recent studies on genetics5 9 and physico- chemical studies of phage λ6 0 and of phage T 2 .6 1 Another technique is the isolation of messenger R N A of a particular locus, which should allow us to infer the base composition of the locus. Such a technique is being devel
oped.6 2 , 6 3
5. TI S S U E DI F F E R E N C E
N o definite case in which the mean base composition is different among different tissues has been reported to the author's knowledge. On the other hand, there are a number of cases which give similar D N A base composi
tions of different tissues (see Chargaff's review) ,1 More recently, K i t6 4 , 6 5 , 6 6
found no difference in D N A base composition between normal tissues and tumors of mice. K i t2 2 also examined D N A from different tissues of the mouse, monkey, guinea pig, and alligator by CsCl density gradient cen
trifugation. Again there was no tissue difference in the D N A profiles.
Mice and guinea pig D N A had a satellite D N A , which was found in all tissues examined.
C. SE Q U E N C E AN A L Y S I S
T h e more detailed and direct approach, of course, is to analyze the nucleotide sequence of D N A . A t the moment, only indirect methods are available. I t should be pointed out, however, t h a t unique information can be provided by indirect methods.
1. NE I G H B O R AN A L Y S I S
Using the differential cleavage of phosphodiester linkages of D N A , Josse et al.67 analyzed the frequencies of neighboring nucleotides. T h e nearest neighbor analysis with a variety of D N A primers yielded results